Measurement of Forchlorfenuron in Grapes by Surface - Enhanced Raman Spectroscopy coupled with Gold Nano substrates
Qian H1, Lin M1*, Zhou P2
1 Food Science Program, Division of Food Systems & Bioengineering, University of Missouri, Columbia, MO, USA.
2 School of Food Science and Technology, Jiangnan University, Wuxi, Jiangsu Province, China.
*Corresponding Author
Mengshi Lin,
Food Science Program, Division of Food Systems & Bioengineering,
University of Missouri, Columbia, MO 65211,
USA.
Tel: (573) 884-6718
Fax: (573) 884-7964
E-mail: linme@missouri.edu
Received: December 09, 2015; Accepted: January 14, 2016; Published: January 18, 2016
Citation: Qian H, Lin M, Zhou P (2016) Measurement of Forchlorfenuron in Grapes by Surface - Enhanced Raman Spectroscopy coupled with Gold Nano substrates. Int J Food Sci Nutr Diet. 5(1), 258-264. DOI : dx.doi.org/10.19070/2326-3350-1600046
Copyright: Lin M© 2016. This is an open-access article distributed under the terms of the Creative Commons Attribution License, which permits unrestricted use, distribution and reproduction in any medium, provided the original author and source are credited.
Abstract
The objective of this study was to use surface-enhanced Raman spectroscopy (SERS) for rapid detection and characterization of trace amounts of forchlorfenuron extracted from fruits. Forchlorfenuron is a plant growth regulator widely used in grapes and has negative effects on human health. In this study, gold-coated nanosubstrates were used for SERS measurements. Partial least squares (PLS) analysis was used as a statistical method for quantitative analysis of the spectral data. Our results demonstrate that enhanced Raman signals acquired from samples exhibited characteristic spectral patterns. The PLS results for quantification of forchlorfenuron were obtained: R= 0.96, RMSEP=9.336×10⁻⁶. The detection limit for forchlorfenuron by SERS is 3.15ppm for pure forchlorfenuron solutions and 4.43 ppm for forchlorfenuron extracted from grape skin. In addition, HPLC was also used to measure forchlorfenuron and verify SERS results. A good linear relationship was observed between 0 - 100 ppm with an R value of 0.999. These results demonstrate that SERS coupled with gold nanosubstrates is a rapid and simple method and it requires little sample preparation. It could be a practical approach to combine SERS with HPLC method to screen and analyze food samples for chemical contaminants and residues.
2.Introduction
3.Materials and Methods
3.1 Materials
3.2 Sample preparation
3.3 SERS Substrates
3.4 SERS Measurement
3.5 Data Analysis
4.Results and Discussion
5.Conclusions
6.Acknowledgements
7.References
Keywords
Forchlorfenuron; Grapes; SERS; Gold Nano Substrates.
Introduction
In recent years, there has been a growing trend of using pesticides and other chemicals on fruits. Forchlorfenuron (1-(2-chloro-4- pyridyl)-3-phenyl urea) is a phenyl urea compound that has strong cytokinin activity of promoting cell division and cell enlargement [1]. It can be used as a plant growth regulator on grapes, raisins, kiwifruits, and melons to improve fruit size and weight [2]. However, excessive use of forchlorfenuron can cause exploding of fruits, contamination of the environment, and may cause negative long-term effects on human health [2, 3]. Therefore, there has been increasing awareness in recent years about the residues of this synthetic chemical on fruits and vegetables. Thus, much attention has been drawn on monitoring the chemical contaminants in fruits and vegetables because most of them are eaten raw, which usually results in higher levels of chemical residues compared to other food groups [4].
Current methods to detect and quantify forchlorfenuron include high-performance liquid chromatography (HPLC) [4, 5], mass spectrometry [6], immunochromatographic assay [7], and other chromatography-based methods. However, these methods are time-consuming, labor-intensive, and expensive. Therefore, novel analytical techniques are needed for rapid detection of chemical contaminants in foods with high accuracy and sensitivity.
Raman spectroscopy is one of the vibrational spectroscopic methods and has been considered a useful analytical technique to assess food quality [8]. Inelastic light scattering of the incident light from a sample creates the Raman signals, which is related to characteristic molecular vibrations of analyte molecules. This gives unique Raman shift in the frequency or wavelength resulting in characteristic Raman emission [9]. Therefore, Raman spectroscopy can provide useful Raman spectral information on various chemicals and biochemical components. One advantage of Raman spectroscopy is that chemicals can be tested in a complex system and is non-invasive. It requires minimum sample preparation with little destruction of samples [10, 11]. However, because only one out of one million photons undergoes Raman scattering, Raman spectroscopy is only suitable for measuring components that are in high concentration [11].
Since the 1970s, scientists have discovered and developed surfaceenhanced Raman spectroscopy (SERS) that can detect samples based on significantly enhanced Raman signals compared to traditional Raman [12-14]. This significant enhancement is mainly attributed to two contributions: electromagnetic field enhancement and chemical enhancement [15, 16]. The electromagnetic field enhancement factor is caused by localized surface plasmon resonance that is excited by electromagnetic radiation and arises the coherent oscillation of the surface conduction electrons [17]. When the light is incident on the nanostructured substrate, it drives the electron into collective oscillation and then generates large electromagnetic fields on the roughened surface of the nanosubstrate [16]. The electromagnetic enhancement plays a major role in SERS and is influenced by size, shape, and roughened surface of the nanomaterial [16]. Chemical enhancement mechanism has an average enhancement factor of 100 which is a charge-transfer state created between the metal and analyte molecules [18]. The molecules are directly adsorbed to the roughened surface of the nanosubstrate, which enables the resonance excitation. Nowadays, many novel nano substrates are applied in SERS to increase Raman signals and gold and silver are two most common nanomaterials used as SERS substrates [15].
There has been increasing use of SERS for rapid detection and characterization of different food contaminants, including melamine, organophosphonate, and seafood antibiotics [19-21]. The objective of this study was to detect and characterize forchlorfenuron extracted from grape skins by SERS method coupled with gold nano substrates. HPLC was also used to verify and compare with SERS results. Partial least squares analysis (PLS) was used as a statistical method to analyze the SERS spectral data.
Materials and Methods
Forchlorfenuron was purchased from Sigma-Aldrich (St Louis, MO, USA). Organic grapes were purchased from a local market and washed to ensure no pesticide residues on grapes.
A stock solution of forchlorfenuron (100 μg/mL) was prepared by dissolving forchlorfenuron powders in 50% acetonitrile that was used as the solvent system (acetonitrile: deionized water = 1:1, v/v), and stored at 4°C. A serial concentrations of forchlorfenuron solutions (0, 0.1,1, 5, 10, 50, and 100ppm) were prepared by dilution from the stock solution. The 0 μg/mL solution was used as the control group.
The sample preparation procedure and extraction method were based on our previous paper [20] with some modifications. Briefly, grapes were weighed and their sizes were measured. The surface area of the fruit was then calculated accordingly. Based on the concentrations of standard forchlorfenuron solutions, the mass of forchlorfenuron that should be spiked on 1 cm² of fruit skin was obtained. The samples were peeled and different concentrations of forchlorfenuron solutions were dropped evenly on 4 cm² of grape skins. The skins of the samples were then blow-dried using an air dryer, cut into small pieces, and placed in conical tubes containing 4 mL of mixed solvent (acetonitrile/ H2O=1:1, v/v). The mixtures were vigorously vortexed for 1 min and then sonicated using an ultrasonic processor for 5min. The supernatants were filtered with a 0.45 μm syringe filter. Finally, the filtrates were used for SERS measurement.
The SERS substrates, Q-SERS™ G1, were obtained from Nanova Inc. (Columbia, MO, USA). Q-SERS™ substrates are gold-coated nano structures fabricated on a silicon wafer. During the measurement, a volume of 0.3 to 0.5 μL of the filtrate was dropped on the surface of a substrate using a micropipette. The substrate was then placed on a hot plate and heated at 35°C until the solvent completely evaporated.
A Renishaw RM1000 Raman spectrometer system (Gloucestershire, UK) equipped with a Leica DMLB microscope (Wetzlar, Germany) was used to test pure forchlorfenuron. This system is equipped with a 785nm near-infrared diode laser source. During the measurement, light from the high power (maximum at 300 mW) diode laser was directed and focused onto the sample at a microscope stage through a ×50 objective. A 578×385 pixels charge-coupled device array detector detected Raman scattering signals. The size of each pixel was 22×22μm. Spectral data were collected by WiRE 3.2 software (Gloucestershire, UK). The detection range for forchlorfenuron is from 500 to 1800 cm-1. Spectra of samples were collected using a × 50 objective with 10s exposure time. For forchlorfenuron extracted from the grape skin, the SERS measurement was conducted using a Renishaw InVia Raman microscope equipped with a Leica Microsystem CMC GmbH using 785nm near-infrared diode laser source. The extracted samples were tested under the condition of 10s exposure time, 1 accumulation, and a ×50 objective with 5% laser power. The spectra were collected by Wire 3.3 software.
For HPLC test, both pure and extracted samples were pretreated by centrifugation at 10000 rpm at 4°C for 10 min, and then stored at 4°C before testing.The measurement was conducted using Agilent 1100 system (Santa Clara, CA, USA) with a C18 column. Parameters for measurement included: a mobile phaseof methanol/water (63:37 v/v), temperature at 40°C, 260 nm detecting UV light, 1mL/min flow rate, and 10 μLinjection volume.
SERS spectral data were collected and analyzed by Delight software version 3.2.1 (D-Squared Development Inc., LaGrande, OR, USA). Data were first processed by second order polynomial subtraction to offset baseline shift. Gaussian smoothing was used at 4 cm-1 to eliminate high frequency instrumental noises. PLS linear regression analysis models were established to predict pesticide concentrations in the samples. The higher an R value is obtained, the better predictability the model indicates [22]. The lowest root mean square error of prediction (RMSEP) value was used to choose the optimum number of PLS latent variables. RMSEP can be calculated in the following equation:
RMSEP = √ [n Σ i ( c^i - ci )² / n ]..........(1)
c^i is the predicted concentration (ppm) of forchlorfenuron solutions, Ci is the actual concentration (ppm) of forchlorfenuron. A higher R value or a lower RMSEP value suggests a better predictability of the PLS model.
The detection limit (DL) for forchlorfenuron can be calculated and expressed from the PLS calibration curve according to both the International Union of Pure and Applied Chemistry (IUPAC) and the American ChemicalSociety (ACS).
DL= 3δ/m..........(2)
Where δ is the standard error in the y-intercept, m is the slope of the PLS model, and 3 represents the model was conducted at 99.86% confidence interval.
The standard PLS calibration curve of forchlorfenuron was obtained by testing different concentrations of standard forchlorfenuron solutions. Two concentrations (5 and 50 ppm) of forchlorfenuron solutions extracted from the grape skins were selected to determine the recovery percentage, which can be calculated based on the following equation:
Recovery % = (Cquantified-Ccontrol) / Cspiked × 100%
where Cquantified is the quantified forchlorfenuron concentration in the spiked grape samples, Ccontrol is the forchlorfenuron concentration in the control grape samples, and Cspiked is the known concentration of spiked forchlorfenuron calculated according to the spiked amount of the pure forchlorfenuron solution and the weight of grape skins.
Results and Discussion
Figure 1 shows the chemical structure of forchlorfenuron and its normal Raman spectra and SERS spectra by measuring 5 ppm of forchlorfenuron solution on a gold slide or on a Q-SERS nano substrate. The Raman signals of forchlorfenuron were significantly enhanced on Q-SERS nano substrates compared with its normal Raman spectra acquired on a gold slide without nanostructures. Characteristic and distinctive spectral features were observed in the SERS spectra. The most predominant peak of forchlorfenuron is at 998 cm-1 due to the symmetric ring stretching of monosubstituted benzene part together with the ring breathing of pyridine part. Another typical peak at 845 cm-1 can be attributed to substituent sensitive vibrations of the pyridine part that includes a C-Cl linkage; a peak at 1271 cm-1 is due to the C-N asymmetric stretching vibration of monosubstituted benzene; a peak at 1328 cm-1 is due to benzene ring skeletal vibrations. The band assignments were summarized in Table 1. SERS spectra of pure forchlorfenuron solutions were consistent with the spectra of the powder form of forchlorfenuron, indicating that there is little interference from the organic solvent.
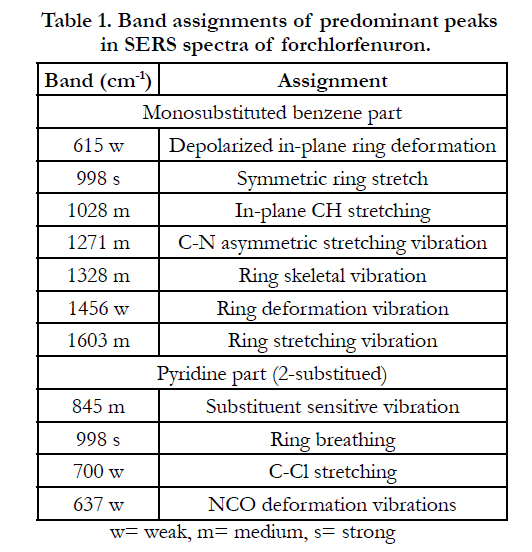

Table 1. Band assignments of predominant peaks in SERS spectra of forchlorfenuron.
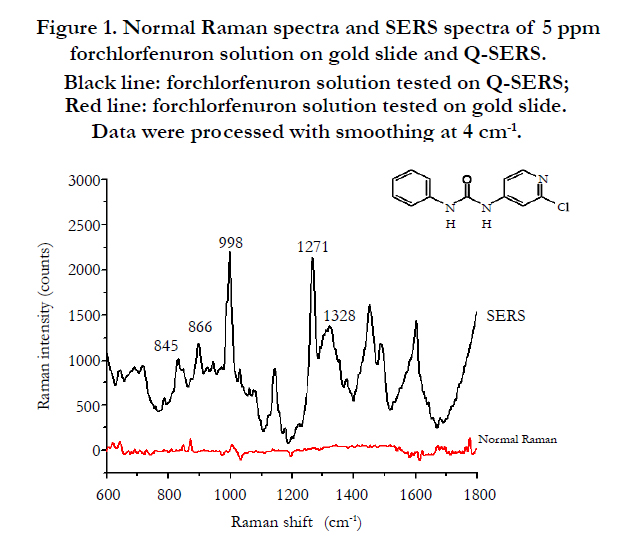
Figure 1. Normal Raman spectra and SERS spectra of 5 ppm forchlorfenuron solution on gold slide and Q-SERS. Black line: forchlorfenuron solution tested on Q-SERS; Red line: forchlorfenuron solution tested on gold slide. Data were processed with smoothing at 4 cm-1.
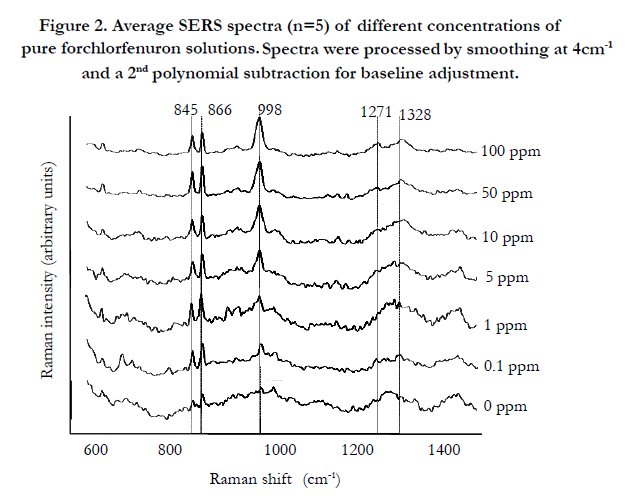
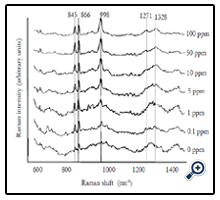
Figure 2. Average SERS spectra (n=5) of different concentrations of pure forchlorfenuron solutions. Spectra were processed by smoothing at 4cm-1 and a 2nd polynomial subtraction for baseline adjustment.
Average SERS spectra (n=5) of different concentrations (0 to 100 ppm) of forchlorfenuron solutions were obtained on Q-SERS. The SERS spectra of forchlorfenuron were distinctive compared to the control (0 ppm of forchlorfenuron in acetonitrile solvent). The Raman intensity of the predominant peaks increased with the increase of sample concentrations. The spectral features at 845, 866, and 998 are still discernible at the 0.1 ppm level. Figure 3 shows the second derivative transformation of the most predominant peak at 998 cm-1. Second derivative transformation was used to adjust baseline shifts and separate overlapping bands. This figure demonstrates that it can clearly differentiate between different concentrations of forchlorfenuron.
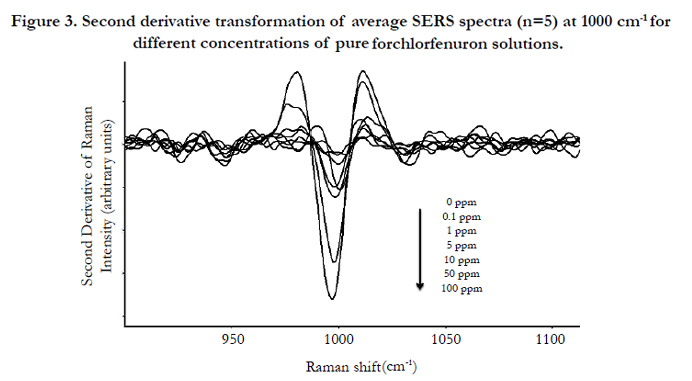
Figure 3. Second derivative transformation of average SERS spectra (n=5) at 1000 cm-1 for different concentrations of pure forchlorfenuron solutions.
RMSEP values obtained from the PLS model are shown in Figure 4. The lowest RMSEP value was achieved when applying four latent variables, indicating that the optimum RMSEP value to construct the PLS model is four. A PLS model was established by plotting predicted concentrations verse actual concentrations of samples using four latent variables (Figure 5). Satisfactory results were obtained with R value of 0.96 and RMSEP of 9.336×10⁻⁶, suggesting that PLS is a reliable analytical tool for quantification of forchlorfenuron in solution. The DL of forchlorfenuron by SERS was calculated based on the equation 2 and are shown in Table 2. The DL for detection of pure forchlorfenuron solutions was 3.15 ppm and 4.43 ppm for samples extracted from the grape skin.
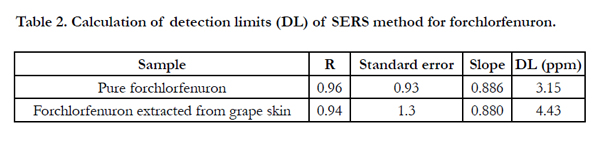
Table 2. Calculation of detection limits (DL) of SERS method for forchlorfenuron.
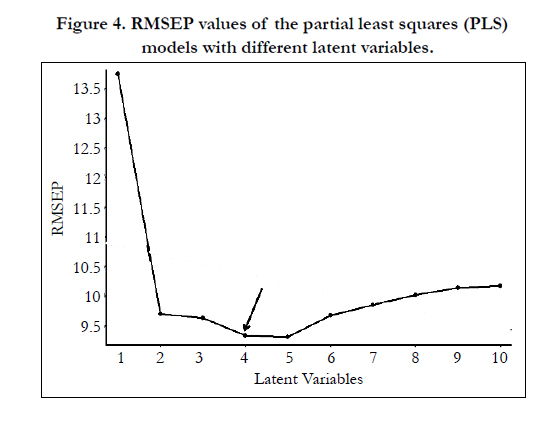
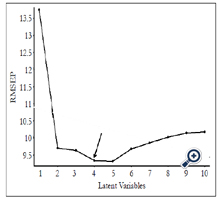
Figure 4. RMSEP values of the partial least squares (PLS) models with different latent variables.
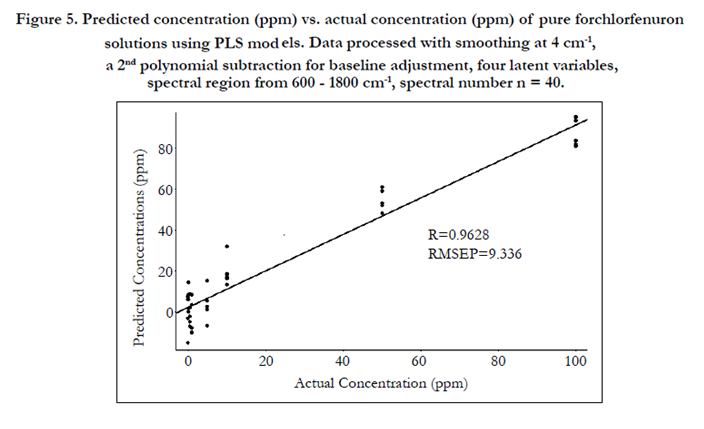
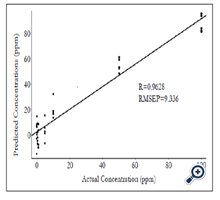
Figure 5. Predicted concentration (ppm) vs. actual concentration (ppm) of pure forchlorfenuron solutions using PLS models. Data processed with smoothing at 4 cm-1, a 2nd polynomial subtraction for baseline adjustment, four latent variables, spectral region from 600 - 1800 cm-1, spectral number n = 40.
To predict the concentration of forchlorfenuron residues and calculate the recovery values, a calibration curve was established (Figure 5). Unlike traditional chromatographic methods of obtaining the calibration curve from pure samples first, and then quantifying the concentrations extracted from food samples accordingly, this method is based on the PLS models and predicts the concentrations of forchlorfenuron directly. As shown in Table 3, the recovery percentage of pure forchlorfenuron with concentrations of 50 and 100 ppm are 111.97% and 79.04%, respectively. While for lower concentrations of samples, the recoveries were low, suggesting that more studies are needed to establish a more sensitive detection protocol with a lower DL.
We also detected and quantified forchlorfenuron extracted from real fruit sample. Five different concentrations (1 to 100 ppm) of forchlorfenuron were spiked on the grapes and then extracted. Average SERS spectra (n = 7) of the extracts were acquired using gold nano substrates (Figure 6). Spectral data were preprocessed by the same transformations as the pure samples. The spectral pattern was highly consistent with that from pure forchlorfenuron (Figure 2). The lowest RMSEP value was achieved at six latent variables with an R value of 0.94 and RMSEP of 1.305 × 10⁻⁵. The DL of forchlorfenuron extracted from grape skin was calculated to be 4.43 ppm (Table 2). This value is a little higher than that obtained from the pure sample, which is reasonable due to the additional extraction procedure. Previous studies suggest that the extracted samples should have the same composition as the standard pure samples [23]. Therefore, the recovery of forchlorfenuron extracted from grape skin was established in the same way as the pure chemical. Results show that the recovery were from 30 to 194.6% for concentrations ranging from 1 to 100 ppm (Table 3).
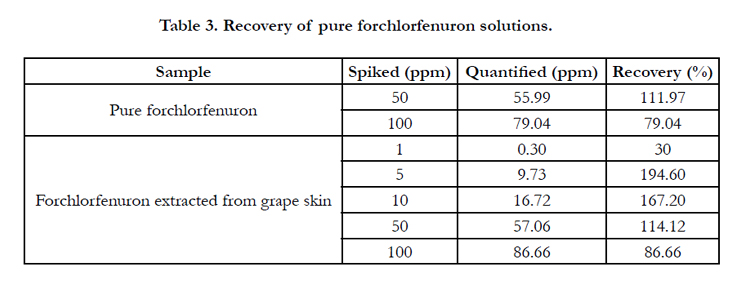
Table 3. Recovery of pure forchlorfenuron solutions.
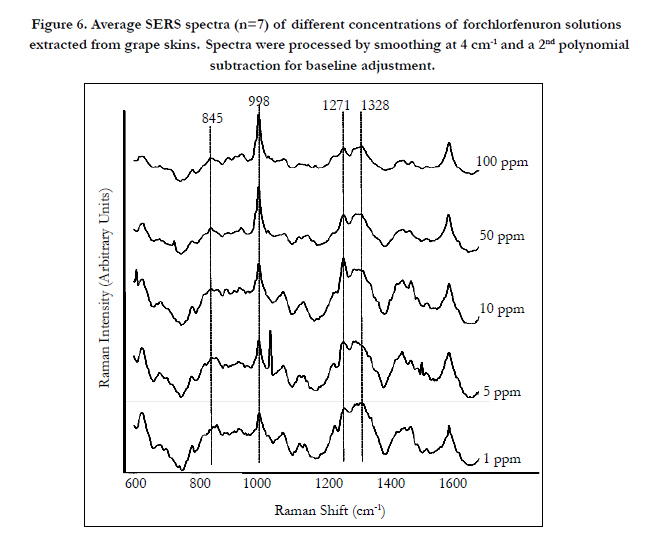
Figure 6. Average SERS spectra (n=7) of different concentrations of forchlorfenuron solutions extracted from grape skins. Spectra were processed by smoothing at 4 cm-1 and a 2nd polynomial subtraction for baseline adjustment.
In addition, HPLC was used for further quantification of forchlorfenuron extracted from grape skin. A calibration curve was established by testing pure chemical solutions ranging from 0 to 100 ppm (Figure 7), exhibiting a linear regression with an R value of 0.99. Five different concentrations of forchlorfenuron from 1 to 100 ppm extracted from grape skin were then tested by HPLC and the recovery percentage was calculated based on the calibration curve, ranging from 72.2 to 158.4% accordingly (Table 4). These results demonstrate that it could be a practical approach to combine SERS with HPLC to screen and analyze large number of food samples for detecting chemical contaminants and residues in fruits. SERS can be used to screen food samples onsite and in real time, eliminate presumptive negative samples of chemical contamination from the sample population, and thenverify presumptive positive samples using HPLC protocols.
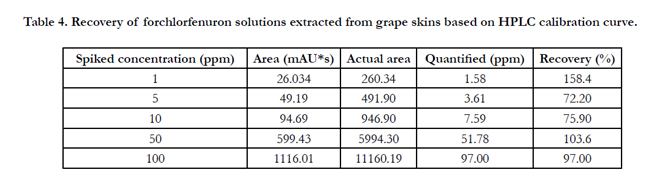
Table 4. Recovery of forchlorfenuron solutions extracted from grape skins based on HPLC calibration curve.
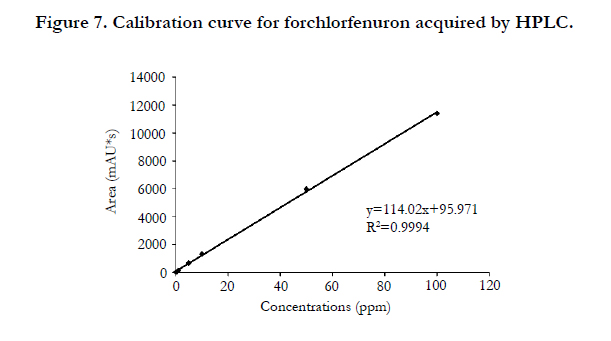
Figure 7. Calibration curve for forchlorfenuron acquired by HPLC.
Conclusions
Forchlorfenuron extracted from grape skins was detected by SERS methods. Characteristic SERS spectra of various concentrations of forchlorfenuron were acquired using gold nano substrates. SERS is a rapid and reliable method for detection of chemical contaminants in various food matrices and there is a great potential in using gold-coated nanosubstrates in SERS. Further research is needed to develop better substrates to improve the results. SERS in combination with other methods such as HPLC will be a novel approach for rapid detection and discrimination of various chemical and biochemical contaminants in foods.
Acknowledgements
We acknowledge the support from Dr. Bo Jiang in the State Key Laboratory of Food Science and Technology at Jiangnan University China and Nanova Inc for providing the substrates.
References
- Chen W, Jiao B, Su X, Zhao Q, Qin D, et al. (2013) Dissipation and residue of forchlorfenuron in citrus fruits. Bull Environ Contam Toxicol 90(6): 756-760.
- EPA. Pesticide fact sheet. Forchlorfenuron. 2004.
- Hu Q, Nelson WJ, Spiliotis ET (2008) Forchlorfenuron alters mammalian septin sssembly, organization, and dynamics. J Biol Chem 283(43): 29563- 29571.
- Chen C, Qian Y, Chen Q, Tao C, Li C, et al. (2011) Evaluation of pesticide residues in fruits and vegetables from Xiamen, China. Food Control 22(7): 1114-1120.
- Hu JY, Li JZ (2006) Determination of forchlorfenuron residues in watermelon by solid-phase extraction and high-performance liquid chromatography. J AOAC Int 89(6): 1635-1640.
- Valverde A, Aguilera A, Ferrer C, Camacho F, Cammarano A (2010) Analysis of forchlorfenuron in vegetables by LC/TOF-MS after extraction with the buffered QuEChERS method. J Agric Food Chem 58(5): 2818-2823.
- Suárez-Pantaleón C, Wichers J, Abad-Somovilla A, van Amerongen A, Abad- Fuentes A (2012) Development of an immunochromatographic assay based on carbon nanoparticles for the determination of the phytoregulator forchlorfenuron. Biosens Bioelectron 42: 170-176.
- Lu X, Al-Qadiri HM, Lin M, Rasco BA (2011) Application of mid-infrared and Raman spectroscopy to the study of bacteria. Food Bioprocess Technol 4(6): 919-935.
- Kneipp K, Kneipp H, Itzkan I, Dasari RR, Feld MS (1999) Ultrasensitive chemical analysis by Raman spectroscopy. Chem Rev 99(10): 2957-2976.
- Lasch P, Naumann D (2000) Infrared spectroscopy in microbiology. Encyclopedia of analytical chemistry.
- Li-Chan ECY (1996) The applications of Raman Spectroscopy in food Science. Trends Food Sci Technol 7(11): 361-370.
- Fleischmann M, Hendra PJ, McQuillan AJ (1974) Raman spectra of pyridine adsorbed at a silver electrode. Chem Phys Lett 26(2): 163-166.
- Albrecht MG, Creighton JA (1977) Anomalously intense Raman spectra of pyridine at a silver electrode. J Am Chem Soc 99(15): 5215-5217.
- Jeanmaire DL, Van Duyne RP (1977) Surface Raman spectroelectrochemistry: Part I. Heterocyclic, aromatic, and aliphatic amines adsorbed on the anodized silver electrode. J Electroanal Chem Interfacial Electrochem 84(1): 1-20.
- Kneipp K, Kneipp H, Itzkan I, Dasari RR, Feld MS (2002) Surface-enhanced Raman scattering and biophysics. J Phys Condens Matter 14(18): R597.
- Haynes CL, McFarland AD, Duyne RPV (2005) Surface-enhanced Raman spectroscopy. Anal Chem 77(17): 338-A.
- Willets KA, Van Duyne RP (2007) Localized surface plasmon resonance spectroscopy and sensing. Annu Rev Phys Chem 58: 267-297.
- Campion A, Kambhampati P (1998) Surface-enhanced Raman scattering. Chem Soc Rev 27: 241-250.
- Lin M, He L, Awika J, Yang L, Ledoux DR, et al. (2008) Detection of melamine in gluten, chicken feed and processed foods using surface enhanced Raman spectroscopy and HPLC. J Food Sci 73(8): T129-T134.
- Liu B, Zhou P, Liu X, Sun X, Li H, et al. (2013) Detection of pesticides in fruits by surface-enhanced raman spectroscopy coupled with gold nanostructures. Food Bioprocess Technol 6(3): 710-718.
- Zhang Y, Yu W, Pei L, Lai K, Rasco BA, et al. (2015) Rapid analysis of malachite green and leucomalachite green in fish muscles with surface-enhanced resonance Raman scattering. Food Chem 169: 80-84.
- Huang Y, Cavinato AG, Mayes DM, Bledsoe GE, Rasco BA (2002) Nondestructive prediction of moisture and sodium chloride in cold smoked Atlantic salmon (Salmo salar). J Food Sci 67(7): 2543-2547.
- Sentellas S, Saurina J, Hernández-Cassou S, Galceran MT, Puignou LS (2001) Multivariate calibration methods for quantification in strongly overlapping capillary electrophoretic peaks. J Chromatogr A 909(2): 259-269.
- Freeman SK (1974) Applications of laser Raman spectroscopy.
- Jehlicka J, Culka A, Edwards HGM (2010) Raman spectra of nitrogen-containing organic compounds obtained in high altitude sites using a portable spectrometer: Possible application for remote robotic Titan studies. Planet Space Sci 58(5): 875-881.
- Dollish FR, Fateley WG, Bentley FF (1974) Characteristic Raman frequencies of organic compounds. Wiley & Sons, New York.
- Klots TD (1995) Vibrational spectra of indene. Part 4. Calibration, assignment, and ideal-gas thermodynamics. Spectrochim Acta Mol Biomol Spectros 51(13): 2307-2324.
- Klots TD, Collier WB (1995) Heteroatom derivatives of indene Part 3. Vibrational spectra of benzoxazole, benzofuran, and indole. Spectrochim Acta Mol Biomol Spectros 51(8): 1291-1316.


