Failure Oriented Accelerated Testing (FOAT), Boltzmann Arrhenius Zhurkov Equation (BAZ), and their Application in Aerospace Microelectronics and Photonics Reliability Engineering
E. Suhir1,2*
1 Portland State University, Portland, USA.
2 Technical University, Vienna, Austria.
*Corresponding Author
E. Suhir,
Portland State University, Portland, USA and Technical University,
Vienna, Austria and ERS Co., 727 Alvina Ct., Los Altos, CA 94024, USA.
Tel: 650.969.1530/408-410-0886
Email: suhire@aol.com
Received: March 18, 2019; Accepted: April 04, 2019; Published: April 05, 2019
Citation: E.Suhir. Failure Oriented Accelerated Testing (FOAT), Boltzmann Arrhenius Zhurkov Equation (BAZ), and their Application in Aerospace Microelectronics and Photonics Reliability Engineering. Int J Aeronautics Aerospace Res. 2019;6(3):185-191. doi: dx.doi.org/10.19070/2470-4415-1900022
Copyright: E.Suhir© 2019. This is an open-access article distributed under the terms of the Creative Commons Attribution License, which permits unrestricted use, distribution and reproduction in any medium, provided the original author and source are credited.
Abstract
The best engineering product is, in effect, the best compromise between its cost, time-to-market and reliability. No successful compromise can be achieved nor can an adequate performance of an electronic or photonic product be assured, if the product's reliability is not quantified. Since nothing is perfect, and the difference between a highly reliable product and an insufficiently reliable one is “merely” in the difference between the levels of their never-zero probabilities of failure, reliability of such products should be evaluated on the probability basis. In the analysis that follows it is shown how this could be done using highly focused and highly cost effective failure-oriented accelerated testing (FOAT) geared to a physically meaningful and flexible Boltzmann-Arrhenius-Zhurkov (BAZ) constitutive equation. FOAT and BAZ are the core of the recently suggested probabilistic design for reliability (PDfR) concept. The following practically important problems are addressed, as suitable examples of the general concept: assessment of the static fatigue lifetime of an optical specialty-fiber intended for high-temperature operations; predicted time-to-failure (TTF) of an electron device subjected to temperature cycling; TTF of a solder material subjected to the combined action of low-temperatures and random-vibrations; and TTF of an electron device under the combined action of an elevated humidity and voltage. Future work should include experimental verification of the theoretical findings, as well as new applications of the suggested technique.
2.Introduction
3.Analysis
3.1 Static fatigue lifetime of an optical fiber proof-tested at an elevated temperature
3.2 Time to failure (TTF) of an electron device subjected to temperature cycling
3.3 Time-to-failure for a solder material subjected to the lowtemperature/random-vibrations bias
3.4 Multi-parametric BAZ model
4.Conclusion
5.References
Abbreviations
FOAT: Failure-Oriented Accelerated Testing; BAZ: Boltzmann-Arrhenius-Zhurkov; PDfR: Probabilistic Design for Reliability; TTF: Time-to-Failure; HALT: Highly Accelerated Life Testing; MTTF: Mean Time to Failure.
Introduction
The almost forty years old highly accelerated life testing (HALT) is currently widely employed, in different modifications, to determine, as it is believed, an electronic product’s reliability weaknesses, assess its reliability limits, and ruggedized the product by applying elevated stresses (not necessarily mechanical and not necessarily limited to the anticipated field stresses) that could cause field failures. HALT provides large, although, actually, unknown, safety margins over expected in-use conditions. HALT tries to “kill many unknown birds with one big stone” and is a “test-fail-fix” process. Its end point is defined by the predetermined number or percent of failures, if any, and its follow up activity is failure (root cause) analysis. In an ideal HALT, no failures occur in a long time.
FOAT, on the other hand, is aimed at understanding the physics of failure, to confirm the use of a particular physically meaningful predictive model and assess the probability of failure. Its end point is also defined by the predetermined number or percent (typically 50%) of failures. The follow-up activity is failure analysis and probabilistic analyses of the test data. An ideal FOAT generates numerous failures in a short time. A highly focused and highly cost effective FOAT is the “heart” of the PDfR concept and is a solid experimental foundation of the PDfR approach. FOAT could be viewed as an extension or a modification of HALT. While HALT is a “black box”, i.e., a methodology, which can be perceived in terms of its inputs and outputs, without a clear knowledge of the underlying physics and the likelihood of failure, FOAT is a “white box", a methodology that clearly identifies its objective to confirm the anticipated physics of failure and to determine the probability of failure. HALT does not measure/quantify reliability, FOAT does. The FOAT based approach could be viewed as a “quantified and reliability physics oriented HALT”. HALT can be used for “rough tuning” of product’s reliability, while FOAT should be employed when “fine tuning” is needed, i.e., when there is a need to quantify, assure and even specify the operational reliability of a material or a device. Since the principle of superposition does not work in reliability engineering, both HALT and FOAT use, when appropriate, combined stressing under various stimuli (stressors). These types of accelerated testing could be carried out separately, or might be partially combined in a particular accelerated test effort. FOAT should be implemented, whenever feasible and appropriate, in addition to HALT, when quantification of the product’s reliability is imperative. In some cases FOAT could be conducted even instead of HALT, especially for new materials and products, whose operational reliability is unclear and for which no experience is accumulated and no best practices exist yet. New products present natural reliability concerns, as well as significant challenges at all the stages of their design, manufacture and use, and an appropriate combination of HALT and FOAT could be especially useful for quantifying reliability of such products.
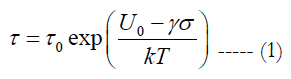
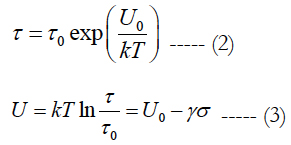
BAZ model [1] formula (1) could be employed withing the framework of an appropriate FOAT effort. This model is the generalization of the well known and still widely used Arrhenius equation [2] introduced in 1889 in the kinetic theory of chemical reactions (1903 Nobel Prize in chemistry). The model formula (2) considers the role of the ratio U0/kT of the activation energy U0 (the term was introduced by Arrhenius to characterize the material’s propensity to get engaged into a chemical reaction), to the thermal energy kT evaluated as the product of the Boltzmann’s constant k = 8.6173303x10- 5eV/K and the absolute temperature T. In the equations (1) and (2), τ is the mean time to failure (MTTF), τ0 is the time constant, and σ (in (1)) is the applied stress per unit volume. Arrhenius’ equation (2) is formally not different of what is known as Boltzmann’s or Maxwell-Bolzmann’s statistics [3] in the kinetic theory of gases. This theory postulates that the absolute temperature of a gas, when it is in thermodynamic equilibrium with the environment, is determined by the average probability of the collisions of the gas particles (atoms or molecules): the higher this probability, the higher is the gas temperature. Chemist Arrhenius was member of physicist Boltzmann’s team in the University of Graz in Austria in 1887 and proposed that Boltzmann’s equation (2) be used to assess the height of the energy barrier determined by the activation energy of the given material to get over this barrier to commence a chemical reaction. The effective activation energy formula (3) plays in the BAZ model (1) the role of the stress-free energy U0 plays in the Arrhenius model (2). Zhurkov and his associates used the model (1) to determine the fracture toughness of materials experiencing combined action of elevated temperature and external loading. It has been shown [4] that the models (1) and (2) can be obtained as steady-state solutions to the Fokker-Planck equation in the theory of Markovian processes (see, e.g., [5]), and that these solutions represent the worst case scenarios, so that the reliability predictions based on the steady-state BAZ model (1) are conservative and, hence, advisable in engineering practice.
In Zhurkov’s tests the loading σ was always a constant mechanical tensile stress applied to notched specimens. It has been suggested [6] that, when the reliability of an electronic or a photonic material is being evaluated, any other loading (stressor, stimulus) of importance (voltage, current, thermal stress, humidity, vibrations, radiation, light output, etc.) can also be used as a stressor, and that, since the principle of superposition does not work in reliability physics, an appropriate combination of relevant stimuli can be considered [7].
The τ value is viewed in the BAZ model as the MTTF. Such an assumption suggests that if the exponential law of the probability of non-failure is used, the MTTF corresponds to the moment of time when the entropy H(P) of the distribution formula (4) reaches its maximum value. Indeed, from the formula H(P) = -P ln P it could be concluded that the maximum entropy H(P) is equal to e-1 and takes place for P = e-1. = 0.3679 In such a situation the equation (4) yields:
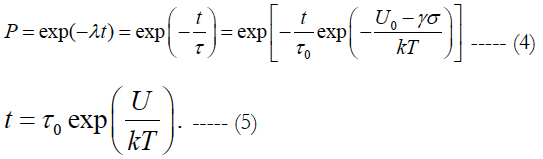
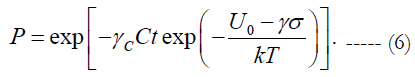
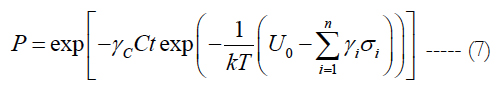
Comparing this result with the equation (1) we conclude that the MTTF expressed by this equation corresponds to the moment of time when the entropy of the time-depending process P = P(t) is the largest and is equal to e-1. Another modification that has been recently introduced to the model (1) has to do with the probabilistic design-for-reliability (PDfR) concept [9-17] and its experimental basis - highly focused and highly cost-effective FOAT [18-21]. Such testing should always be geared to a physically meaningful predictive model, and flexible and easy-to-use BAZ model can be effectively employed in this capacity. It has been suggested also that when a suitable FOAT is considered, the time constant τ0 in the double-exponential distribution (4) is replaced by the quantity (γcCt)-1 where t is time, C is a suitable criterion of failure (such as, say, elevated leakage current or high electrical resistance) and γc is the sensitivity factor. Then the distribution (4) can be written, considering its application in FOAT, as:
In the analysis below this expression or its multi-parametric extension formula (7) are employed to assess the probability of non-failure and time-to-failure (TTF) 1) of an optical fiber proof-tested at an elevated temperature and experiencing static fatigue [22], 2) of an electron device subjected to temperature cycling [23], 3) of a solder material subjected to the low-temperature/random-vibrations bias [24], and 4) of a device subjected to elevated-humidity/ elevated-voltage bias [25].
There is a significant research on reliability and proof-testing of optical fibers (see, e.g., [26-36]). Using the BAZ model, the condition at failure is obvious, and the equation (6) can be assumed in the form:
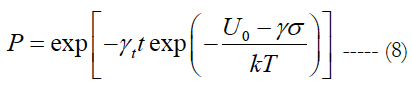
where γt is the sensitivity factor for the testing time. The equation (8) has three unknowns: the activation energy U0 and two sensitivity factors: the applied stress factor γ and the testing time factor γt.
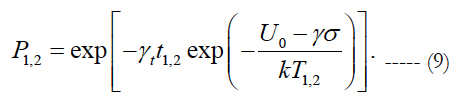
At the first step the FOAT should be conducted for two different temperatures T1 and T2 keeping the level of the applied stress σ the same in both tests. After recording the percentages P1 and P2 of non-failed samples by the long enough times t1 and t2 the following relationships can be obtained:
Since the numerator U0 - γσ was kept the same, the following equation must be fulfilled for the sought time sensitivity factor γt:
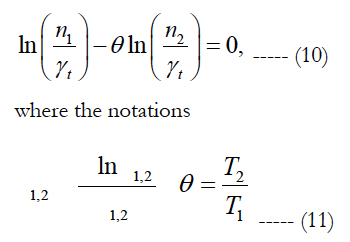
are used. Here t1 and t2 are the times, at which the failures fiber breaks occurred. The equation (10) has the following solution:
At the second step, FOAT at two stress levels, σ1 and σ2, should be conducted for the same temperature. This leads to the following formula for the ratio of the stress sensitivity factor to the thermal energy:
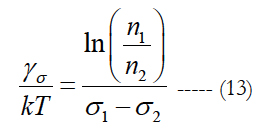
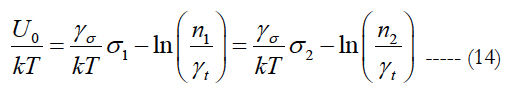
Note that the stress sensitivity factor γ is independent of the temperature sensitivity factor γt. The ratio of the activation energy U0 to the thermal energy can be computed for any consistent levels of stress, temperature and time as:
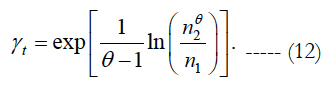
The expected fatigue lifetime can be found from (8) for the given (specified) probability P as:
Clearly, the predicted fatigue lifetime depends on the expected (accepted, specified) probability of non-failure of the fiber subjected to the given loading and temperature. If the acceptable probability of non-failure is low, the estimated fatigue lifetime can be rather long.
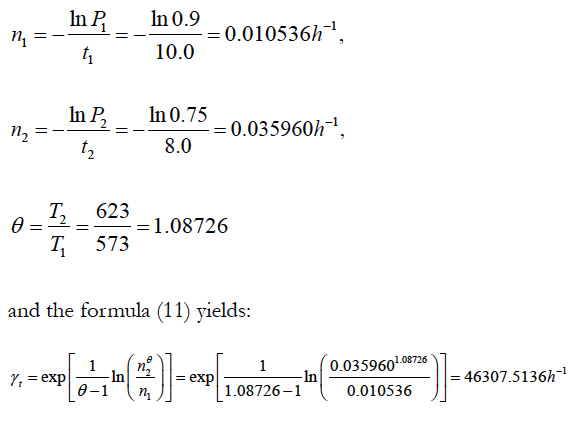
Let, e.g., the following input FOAT information is obtained at the first step of FOAT for a coated specialty fiber intended for elevated temperature operations:
1) After t1 = 10h of testing at the temperature of T1 = 300°C = 573°K, under the stress of σ = 420kg/mm2, 10% of the tested specimens failed, so that the probability of non-failure is P1 = 0.9;
2) After t2 = 8.0h of testing at the temperature of T2 = 350°C = 623°K under the same stress, 25% of the tested samples failed, so that the probability of non-failure is P2 = 0.75
Then the formulas (11) yield:
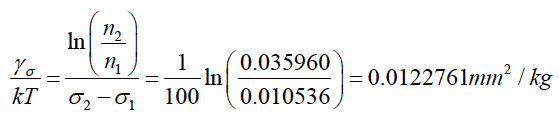
At the second step FOAT has been conducted at the stress levels of σ1 = 420kg/mm2 and σ2 = 320kg/mm2 at the temperature of T = 350°C = 623°K and it has been confirmed that 10% of the tested samples under the stress level of σ1 = 420kg/mm2 failed after t1 = 10.0h of testing, so that P1 = 0.9. The percentage of failed samples tested at the stress level of σ2 = 320kg/mm2 was 5% after t2 = 24h of testing, so that P2 = 0.95. Then the formula (13) results in the following ratio of the stress sensitivity factor to the thermal energy:
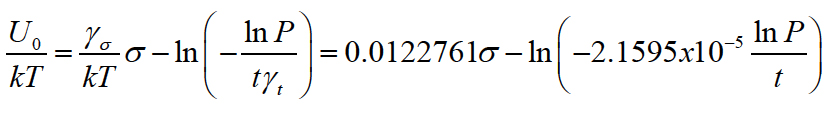
After the sensitivity factors for the time and the stress are determined, the ratio of the stress activation energy to the thermal energy can be found as:
If, e.g., the stress σ = 320kg/mm2 is applied for t = 24h and the acceptable probability of non-failure at the end of this time is, say, P = 0.99 then

This result indicates particularly that the activation energy U0 is determined primarily by the property of the silica material (second term in the above equation), but is affected also, in this approach, by the applied stress: the higher the applied stress is, the higher is the activation energy.
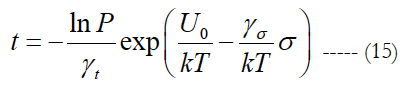
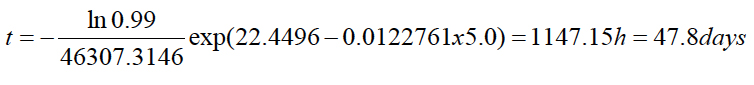
The fatigue lifetime of the fiber can be determined for the acceptable (specified) probability of non-failure using the formula (15). If, e.g., the acceptable probability of non-failure is as low as P = 0.8, the applied temperature is T = 325°C = 598°K and the applied stress is 5.0kg/mm2, then the expected fatigue lifetime of the fiber is:

If the acceptable/specified probability of non-failure is P = 0.99, then the predicted lifetime is only
Using the BAZ model (6), the probability of non-failure of a vulnerable material, such as, e.g., solder joint interconnection experiencing inelastic strains during temperature cycling can be sought in the form:
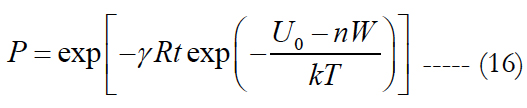
Here U0, eV is the activation energy and is the characteristic of the solder material’s propensity to fracture, W, eV is the damage caused by a single temperature cycle and measured, in accordance with Hall’s concept, by the hysteresis loop area of a single temperature cycle for the strain of interest [37], T, K is the absolute temperature (say, the cycle’s mean temperature), n is the number of cycles, k is Boltzmann’s constant, t, sec, is time, R, Ω is the measured (monitored) electrical resistance at the peripheral joint location, and γ is the sensitivity factor for the resistance.
The above equation makes physical sense. Indeed, the probability P of non-failure is zero at the initial moment of time t = 0 and when the electrical resistance R of the joint material is zero; this probability decreases, because of material aging and/or structural degradation with time, and not necessarily only because of temperature cycling; it is lower for higher electrical resistance (a resistance as high as, say, 450Ω can be viewed as an indication of an irreversible mechanical failure of the joint); materials with higher activation energy U0 have a lower probability of possible failure; the increase in the number of cycles n leads to lower effective activation energy U = U0 - nW, and so does the level of the energy W of a single cycle.
It could be shown that the maximum entropy of the distribution (16) takes place at the MTTF τ expressed as:
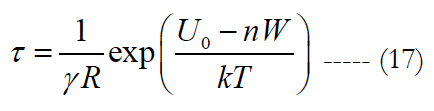
Mechanical failure in solder joints, associated with temperature cycling, occurs, when the number of cycles n is nf = U0/W. When this condition takes place, the temperature in the denominator in the parentheses of the equation (17) becomes irrelevant, and this equation yields: Pf = exp (-tf/τf) where Pf is the measured probability of non-failure and τf = 1/γRf is the MTTF.
If, e.g., 20 devices have been temperature cycled and the high resistance Rf = 450Ω considered as an indication of failure was detected in 15 of them, then Pf = 0.25. If the number of cycles during such FOAT was, say, nf = 2000, and each cycle lasted for 20min = 1200sec., then the time at failure is tf = 2000x1200 = 24x105 sec and
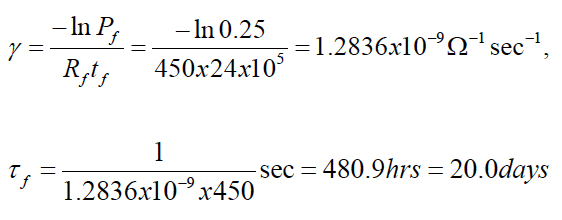
According to Hall’s concept, the energy W of a single cycle should be measured, by running a specially designed test, using strain gages. Let, e.g., the measured area of the hysteresis loop was W = 2.5x10⁻⁴eV Then the stress-free activation energy is U0 = nfW = 2000x4.5x10-4 = 0.9eV. In order to assess the number of cycles to failure in actual operation conditions one could assume that the temperature range in these conditions is, say, half the accelerated test range, and that the area W of the hysteresis loop is proportional to the temperature range.
Then the number of cycles to failure is nf = U0/W = (0.9x2.0)/(2.5x10-4) = 7200 and the time to failure will be tf = 7200days =19.7years, if the duration of one cycle in actual operation conditions is one day.
Although there exist promising ways to avoid inelastic strains in solder joints of the second level of interconnections in IC package designs [38], it still appears more typical than not that the peripheral joints of a package/PCB assembly experience inelastic strains. This takes place at low temperature conditions, when the deviation from the high fabrication temperature is the largest and the induced thermal stresses are the highest. On the other hand, it is well known that it is the combination of low temperatures and repetitive dynamic loading that accelerates dramatically the propagation of fatigue cracks, whether elastic or inelastic. A modification of the BAZ model is developed for the evaluation of the time-to-failure of the second level solder joint interconnections whose peripheral joints experience inelastic strains. The suggested methodology is viewed as a possible, effective and attractive alternative to temperature cycling. The random vibrations are considered as a white noise of the given (m/s2)2/Hz level - the ratio of the acceleration amplitudes squared to the vibration frequency. We use the BAZ equation in the form [39]:
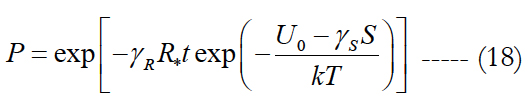
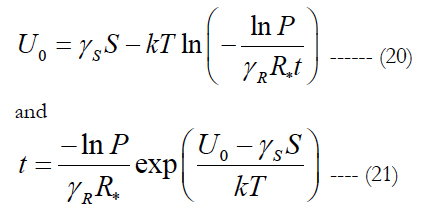
where S is the random vibration spectrum and R* is the measured electrical resistance that is considered high enough, so that the peripheral solder joint(s) most likely lost their integrity. Using the FOAT procedure similar to the one in the previous sections, we obtain the following formula for the sensitivity factor γR:
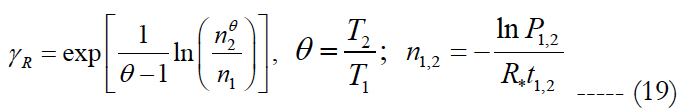
the activation energy U0 and the fatigue lifetime t can be calculated from the equation (18) as:
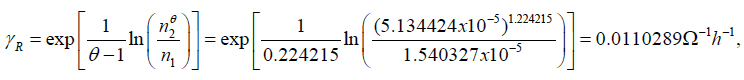
Let, e.g., the first step of testing is conducted until the resistance threshold of R* = 450Ω is reached. Half of the specimen population failed at the temperature of T1 = -50°C = 223°K after t1 = 100h of testing. When testing was conducted at the temperature of T2 = 0°C = 273°K, half of the specimens population failed after t2 = 300h of testing. The level of the vibration power spectrum density S was kept the same in both sets of tests. The last two formulas in (19) yield:
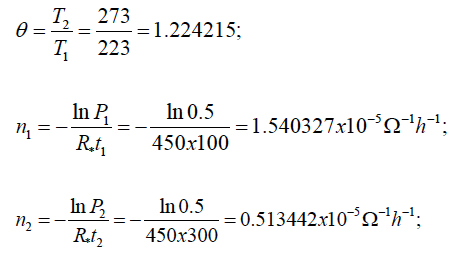
The first formula in (19) results in the following value of the factor γR:
Let the second step of testing be carried out until just 1% of the specimens failed, so that P = 0.99. This took place after t1 = 150h of testing at the temperature of T1 = -30°C = 243°K at the vibration level of S1 = 106 mm2 sec-3 and after t2 = 50h of testing at the temperature of T2 = -50°C = 223°K at the vibration level of S2 = 2x106 mm2 sec-3. The effective activation energy is:
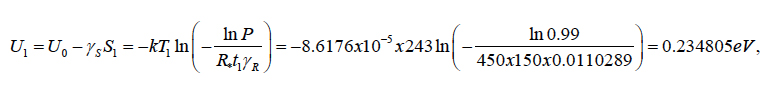
when testing is carried out at the temperature T1 = -30°C = 243° K, and is
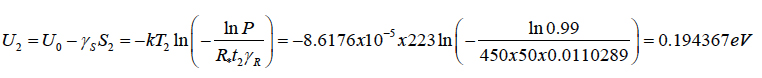
when testing is carried out at the temperature T2 = -50°C = 223° K. Requiring that the zero stress activation energy be loading independent, one can evaluate the vibration related sensitivity factor as
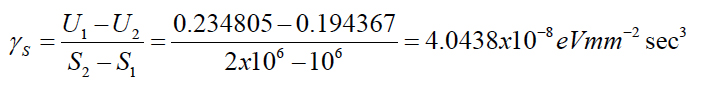
Then the stress-free activation energy can be computed as:

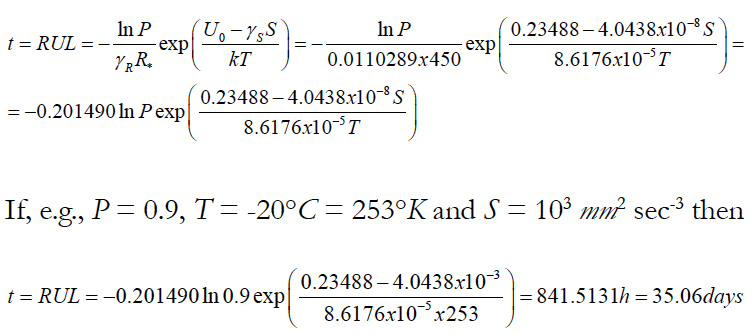
The remaining useful life can be computed for any probability of non-failure, low temperature and vibration spectral density as:
Let us elaborate on the substance of the multi-parametric BAZ model using as an example a situation when the product of interest is subjected to the combined action of the elevated relative humidity H and elevated voltage V. The failure rate of a product is determined by the level of the leakage current: λ = γII. Then the equation (7) can be written as:

Here the γ factors reflect the sensitivities of the device to the change in the corresponding stressors. Although only two stressors are selected – the relative humidity H and the elevated voltage V - the model can be easily made multiparametric, i.e., generalized for as many stimuli as necessary.
The sensitivity factors γ should be determined from the FOAT when the combined action of all the stimuli (stressors) of importance is considered. Because of that the structure of the multiparametric BAZ should not be interpreted as a superposition of the effects of different stressors (as is known, superposition principle does not work in reliability engineering), but rather as a convenient and physically meaningful representation of the FOAT data. The physical meaning of the distribution (22) could be seen from the formulas:
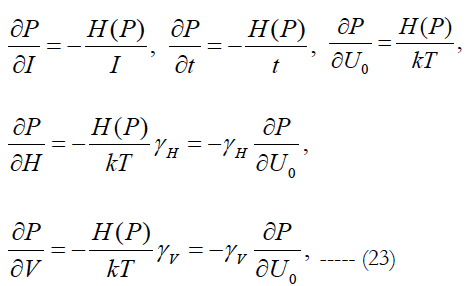
where H(P) = -PlnP is the entropy of the probability P = P(t) of non-failure. The following conclusions can be made based on these formulas:
1) The change in the probability of non-failure always increases with an increase in the entropy (uncertainty) of the distribution. This probability decreases with an increase in the leakage current and with time, which certainly makes physical sense.
2) The last two of the above formulas show the physical meaning of the sensitivity factors γ: they can be found as the ratios of the change in the probability of non-failure with respect to the corresponding stimuli to the change of this probability with the change in the stress-free activation energy.
The equation (22) for the probability of non-failure contains four empirical parameters: the stress-free activation energy U0 and three sensitivity factors γ: leakage current factor, relative humidity factor and elevated voltage factor. Here is how these factors could be obtained from the highly focused and highly cost effective FOAT data.
First, one should run the FOAT for two different temperatures T1 and T2 keeping the levels, low or high, of the relative humidity H and elevated voltage V the same in both tests; recording the percentages (values) P1 and P2 of non-failed samples; assuming a certain criterion of failure (say, when the level of the measured leakage current exceeds a certain level I*), we obtain the following two relationships:

Since the numerators in these relationships are kept the same, the following equation must be fulfilled for the sought sensitivity factor γI of the leakage current:
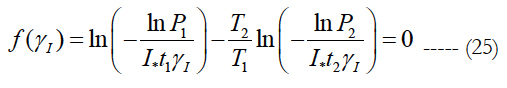
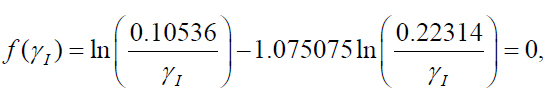
Here t1 and t2 are the times, at which the failures were detected. This equation has the following solution:
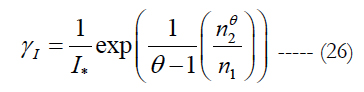
where the notation (11) is used.
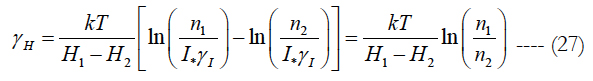
At the second step, FOAT tests at two relative humidity levels H1 and H2 should be conducted for the same temperature and voltage. This leads to the relationship:
Similarly, at the next step of FOAT tests, by changing the voltages V1 and V2, the following expression for the sensitivity factor γv can be obtained:

Finally, the stress-free activation energy can be computed as:

for any consistent humidity, voltage, temperature and time. Let, e.g., the following input information is available:
1) After t1 = 35h of testing at the temperature T1 = 60°C = 333°K, the voltage V=600V and the relative humidity H = 0.85, 10% of the tested modules exceeded the allowable (critical) level of the leakage current of I* = 3.5μA and, hence, failed, so that the probability of non-failure is P1 = 0.9;
2) After t2 = 70h of testing at the temperature T2 = 85°C = 358°K at the same voltage and the same relative humidity, 20% of the tested samples reached or exceeded the critical level of the leakage current and, hence, failed, so that the probability of non-failure is P2 = 0.8.
Then the equation (25) yields:
and its solution is γI = 4926h-1 (μA)-1, so that γII* = 1724h-1. This concludes the first step of testing. At the second step, tests at two relative humidity levels H1 and H2, were conducted for the same temperature and voltage levels. This leads to the relationship:
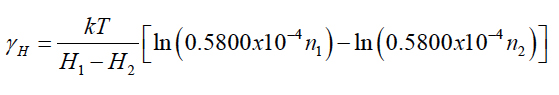
Let, e.g., after t1 = 40h of testing at the relative humidity of H1 = 0.5 at the given voltage (say, V=600V) and temperature (say, T = 60°C = 333°K), 5% of the tested modules failed, so that P1 = 0.95, and after t2 = 55h of testing at the same temperature and at the relative humidity of H2 = 0.85, 10% of the tested modules failed, so that P2 = 0.9. Then the above equation for the γH value, with the Boltzmann constant k = 8.61733x10⁻⁵eV/K yields: γH = 0.03292eV. At the third step, FOAT at two different voltage levels V1 = 600V and V2 = 1000V have been carried out for the same temperature-radiation bias, say, T = 85°C = 358°K and H = 0.85, and it has been determined that 10% of the devices failed after t1 = 40h of testing (P1 = 0.9) and 20% of devices failed after t2 = 80h (P2 = 0.8). Then,

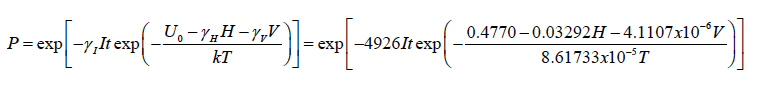
After the sensitivity factors of the leakage current, the humidity and the voltage are found, the stress free activation energy can be determined for the given temperature and for any combination of loadings (stimuli). The third term in the equation (29) for the stress-free activation energy plays the dominant role, so that, in approximate evaluations, only this term could be considered. Calculations indicate that the loading free activation energy in the above numerical example (even with the rather tentative, but still realistic, input data) is about U0 = 0.4770eV. This result is consistent with the existing experimental data. Indeed, for semiconductor device failure mechanisms the activation energy ranges from 0.3 to 0.6eV, for metallization defects and electromigration in Al it is about 0.5eV, for charge loss it is on the order of 0.6eV, for Si junction defects it is 0.8eV. With the above FOAT data the formula (22) yields:
If, e.g., in actual operation conditions I* = 1.5μA is the acceptable level of the leakage current, the actual humidity is, say, H = 0.1, the applied voltage is V = 220V and the temperature of the device is, say, T = 70°C = 343°K then the obtained formula yields:
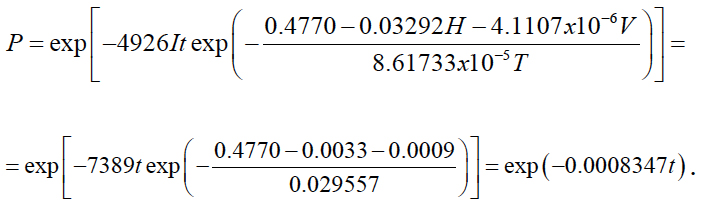
The predicted probability of non-failure is, in this example, 0.7916 after a week operation, 0.5483 after a month operation, and only 0.000738 after a year operation.
Conclusion
Application of FOAT and BAZ equation enable to quantify reliability of microelectronic products on the probabilistic basis. Future work should include experimental verification of the theoretical findings, as well as new applications of the suggested techniques.
References
- Zhurkov AN. Kinetic concept of the strength of solids. Int J Fract Mech. 1965;1:311-23.
- Arrhenius S. About the heat of dissociation and the influence of temperature on the degree of dissociation of electrolytes. J Phys Chem. 1889 Jul 1;4 (1):96-116.
- Boltzmann L. Studies on the balance of living force. Scientific essays. 1868;1:49-96.
- Suhir E, Kang SM. Boltzmann–Arrhenius–Zhurkov (BAZ) model in physics- of-materials problems. Mod Phys Lett B. 2013 May 30;27(13):1330009.
- Suhir E, Rafanelli AJ. Applied probability for engineers and scientists. McGraw Hill: New York; 1997.
- Suhir E, Bechou L, Bensoussan A. Technical Diagnostics in Electronics: Application of Bayes Formula and Boltzmann-Arrhenius-Zhurkov (BAZ) Model. Printed Circuit Design& Fab/Circuits Assembly. 2012 Dec;29(12):25-8.
- Suhir E. Three-step concept in modeling reliability: Boltzmann–Arrhenius– Zhurkov physics-of-failure-based equation sandwiched between two statistical models. Microelectron Reliab. 2014 Oct:2594-603.
- Suhir E, Bensoussan A. Application of multi-parametric BAZ model in aerospace optoelectronics. In 2014 IEEE Aerospace Conference: Big Sky, Montana; 2014 Mar.
- Suhir E. Thermal stress modeling in microelectronics and photonic structures and the application of the probablistic approach: Review and extension. Int J Microcirc Electron Packag. 2000;23(2):215-23.
- E Suhir. Probabilistic Design for Reliability. Chip Scale Reviews. 14(6);2010.
- E Suhir, R Mahajan. Are Current Qualification Practices Adequate?. Circuit Assembly. 2011.
- Suhir E. Thermal stress failures: Predictive modeling explains the reliability physics behind them. IMAPS Advanced Microelectronics. 2011 Jul;38(4).
- Suhir E, Mahajan R, Lucero A, Bechou L. Probabilistic design for reliability (pdfr) and a novel approach to qualification testing (qt). In IEEE/AIAA Aerospace Conf. 2012 Mar 3. p. 3843-3860.
- Suhir E. When reliability is imperative, ability to quantify it is a must. IMAPS Advanced Microelectronics. 2012 Jul.
- Suhir E. Predicted reliability of aerospace electronics: Application of two advanced probabilistic concepts. In 2013 IEEE Aerospace Conference; 2013 Mar 2. p. 1-13.
- Suhir E. Electronics reliability cannot be assured, if it is not quantified. Chip Scale Reviews. 2014 Mar.
- Suhir E. Probabilistic Design for Reliability (PDfR) of Aerospace Instrumentation: Role, Significance, Attributes, Challenges , 5th IEEE Int. Workshop on Metrology for Aerospace (MetroAeroSpace): Rome, Italy; 2018.
- Suhir E. Failure-oriented-accelerated-testing (FOAT) and its role in making a viable IC package into a reliable product. Circuits Assembly. 2013 Jun.
- Suhir E, Bensoussan A, Nicolics J, Bechou L. Highly accelerated life testing (HALT), failure oriented accelerated testing (FOAT), and their role in making a viable device into a reliable product. In 2014 IEEE Aerospace Conference: Big Sky, Montana; 2014 Mar.
- Suhir E. Failure-oriented-accelerated-testing (FOAT) and its role in making a viable IC package into a reliable product. Circuits Assembly. 2013 Jun.
- E Suhir, S Yi, J Nicolics. Failure-Oriented-Accelerated-Testing (FOAT) vs. Highly-Accelerated-Life-Testing (HALT): Making a Viable Medical Electron Device (MED) Package into a Reliable Product. IMAPS Workshop on Advanced Packaging for Medical Microelectronics: San Diego, California; 2019.
- Suhir E. Static fatigue lifetime of optical fibers assessed using Boltzmann– Arrhenius–Zhurkov (BAZ) model. J Mater Sci: Mater El. 2017 Aug 1;28(16):11689-94.
- Suhir E, Ghaffarian R. Electron Device Subjected to Temperature Cycling: Predicted Time-to-Failure. J Electron Mater. 2019 Feb 15;48(2):778-9.
- Suhir E, Ghaffarian R, Yi S. Solder material experiencing low temperature inelastic stress and random vibration loading: predicted remaining useful lifetime. J Mater Sci: Mater Electron. 2017 Feb 1;28(4):3585-97.
- E Suhir, S Yi. Accelerated Testing and Predicted Useful Lifetime of Medical Electronics, Handlery Hotel: San-Diego; 2017. IMAPS Conf. on Advanced Packaging for Medical Electronics. 2017 Jan 23-24.
- Wiederhorn SM. A chemical interpretation of static fatigue. J Am Ceram Soc. 1972 Feb;55(2):81-5.
- Krause JT. Zero stress strength reduction and transitions in static fatigue of fused silica fiber lightguides. J Non-Cryst Solids. 1980 May 1;38:497-502.
- Sakaguchi S, Sawaki Y, Abe Y, Kawasaki T. Delayed failure in silica glass. J Mat Sci. 1982 Oct 1;17(10):2878-86.
- Ritter JE, Glaesemann GS, Jakus K. Effect of temperature on the strength and fatigue behaviour of optical fibres. J Mat Sci. 1984 Dec 1;19(12):4087- 92.
- Cowap SF, Brown SD. Static fatigue testing of a hermetically sealed optical fiber. Am Ceram Soc Bull. 1984;63(3):495-500.
- Cuellar E, Roberts D, Middleman LM. Effect of Buffer Coating on Static Fatigue Transition in Optical Fibers in Bending. Optical Fiber Conference: Reno, NV, USA; 1987.
- Setchell RE. Reduction in fiber damage thresholds due to static fatigue. In Laser-Induced Damage in Optical Materials. Int Soc Opt Photonic.
- Poulain M, Evanno N, Gouronnec A. Static fatigue of silica fibers. In Optical Fiber and Fiber Component Mechanical Reliability and Testing. Int Soc Opt Photonic. 2002 Jun 25;4639:64-75.
- Ritter JE, Bandyopadhyay N, Jakus K. Statistical reproducibility of the dynamic and static fatigue experiments. Am Ceram Soc Bull. 1981;60(8):798.
- Kalish D, Tariyal BK. Probability of static fatigue failure in optical fibers. Applied Physics Letters. 1976 Jun 15;28(12):721-3.
- Ritter Jr JE. Probability of fatigue failure in glass fibers. Fiber Integ Opt. 1978 Jan 1;1(4):387-99.
- Hall P. Forces, moments, and displacements during thermal chamber cycling of leadless ceramic chip carriers soldered to printed boards. IEEE Transactions on Components, Hybrids, and Manufacturing Technology. 1984 Dec;7(4):314-27.
- Suhir E. Avoiding low-cycle fatigue in solder material using inhomogeneous column-grid-array (CGA) design. Chip Scale Rev. 2016 Mar.
- Suhir E, Ghaffarian R, Yi S. Solder material experiencing low temperature inelastic stress and random vibration loading: predicted remaining useful lifetime. J Mater Sci: Mater Electron. 2017 Feb 1;28(4):3585-97.


