Radiation Measurement in the University of Sharjah
Zubair M*, Kassar AA, Hamouda Ishag AM, Ansari AA, Hussain Aljassmi AA
Department of Nuclear Engineering, University of Sharjah, Sharjah, United Arab Emirates.
*Corresponding Author
Muhammad Zubair,
Department of Nuclear Engineering,
University of Sharjah, 27272,
Sharjah, United Arab Emirates.
Tel: +971567146701
E-mail: zubairheu@gmail.com
Received: December 14, 2016; Accepted: December 27, 2016; Published: December 28, 2016
Citation: Zubair M, Kassar AA, Hamouda Ishag AM, Ansari AA, Hussain Aljassmi AA (2016) Radiation Measurement in the University of Sharjah. Int J Magn Nucl Sci. 2(5), 33-38.
Copyright: Zubair M© 2016. This is an open-access article distributed under the terms of the Creative Commons Attribution License, which permits unrestricted use, distribution and reproduction in any medium, provided the original author and source are credited.
Abstract
This study presents a total of sixty four measurements of indoor radon concentrations, obtained within the campus of the University of Sharjah, United Arab Emirates. The passive radon detection kit from E-Perm was deployed in this survey, and all measurements were short-term measurements ranging between 2 and 5 days. Since there is no official recommended limit for radon concentrations within the United Arab Emirates, we have compared our results to the one set by the World Health Organization (WHO) of 100 Bq m-3. The highest recorded concentration was 97.07 Bq m-3, and it is one of the 5 measurements that were close to the WHO’s recommended concentration. On the other hand, the remaining 59 measurements were below 60 Bq m-3. Since all measurements were below the WHO’s recommended reference limit of 100 Bq m-3, we have concluded that the breathing environment within the University of Sharjah is adequate for the community.
2.Introduction
3.Methodology
3.1.Sample Collection
3.2.Detection System
4.Analysis
5.Results and Discussion
6.Conclusion
7.Acknowledgements
8.References
Keywords
Radon Measurement; E-Perm; Ventilation; Radiation Protection; University of Sharjah.
Introduction
The sustenance of human health and safety is an important goal for researchers and can be achieved by minimizing the exposure to external health hazards, which may increase the probability of cancer to appear in living organisms. The health hazard of concern in this study is the radioactive noble gas, Radon, and have measured its concentration at different locations within the University of Sharjah. Radon is continuously produced by the alpha-decay of radium, a decay product of the naturally present uranium (238U) and thorium (Th232) on Earth. The most stable isotope of radon is 222Rn which is one of the granddaughters of 238U, with a half-life of about 3.8 days [1]. Radon also has four short lived decay products: 128Po (3.05min), 214Pb (26.8 min), 214Bi (19.9 m), and 214Po (164μs). Both polonium isotopes (128Po and 214Po) are alpha emitters and represent the main natural radiation exposures to human [2]. The inhalation of radon and its daughters even for people exposed to medium or low concentration increases the probability of having lung cancer rather than high concentration of radon [3]. According to the American Environmental Protection Agency (EPA); radon is the second leading cause of lung cancer in the United States, after smoking [4]. The problem lies in Radon being colorless, odorless and tasteless at the same time, meaning that humans are not able to detect its presence. Therefore, it is vital to use specialized radon detection equipment that will help locate and quantify radon concentrations in a given place. This is needed to determine whether action is necessary to reduce radon concentration in a given place, provided the concentration of radon is found to be higher than the agreed upon action limit(s) set by health organizations. Radon references and action levels have been set in many countries and national agencies depending on their own studies. The American Environmental Protection Agency (EPA) recommends indoor radon concentrations to be less than 148 Bq m-3 [5], which is their acceptable action limit in order to reduce and minimize lung-cancer risk on individuals. On the other hand, the International Commission on Radiological Protection (ICRP) has adopted an action range between 150 and 600 Bq m-3 [6]. However, some countries have not set their own action levels to radon concentrations such as the United Arab Emirates, where we are performing this study. Therefore, we have adopted the lowest action available, set by the World Health Organization (WHO) to be 100 Bq m-3.
Since Radon is gaseous at room temperature, it will flow through upwards through cracks and, or openings in walls and floors of dwellings. This implies that deploying radon detectors close to boundaries of rooms will add uncertainty to measurements. This is due to the fact that occupants - person who resides or is present in a house at a given time-will not spend their day too close to walls for example, but more focused towards the center of a given room. To avoid this, we have followed the recommended sampling dimensions and criteria provided by the Center for Environmental Research and Technology, Inc (CERTI) below:
• In a location where it will not disturb occupants, to avoid dislocating device.
• More than 50.8 cm above the floor.
• More than 91.44 cm from wall openings that may allow air flow.
• At least 30.48 cm from walls without openings.
• More than 10.16 cm of free space around device, to allow radon and its products to flow in.
• Out of direct air drafts.
• Not where direct sunlight could strike the device.
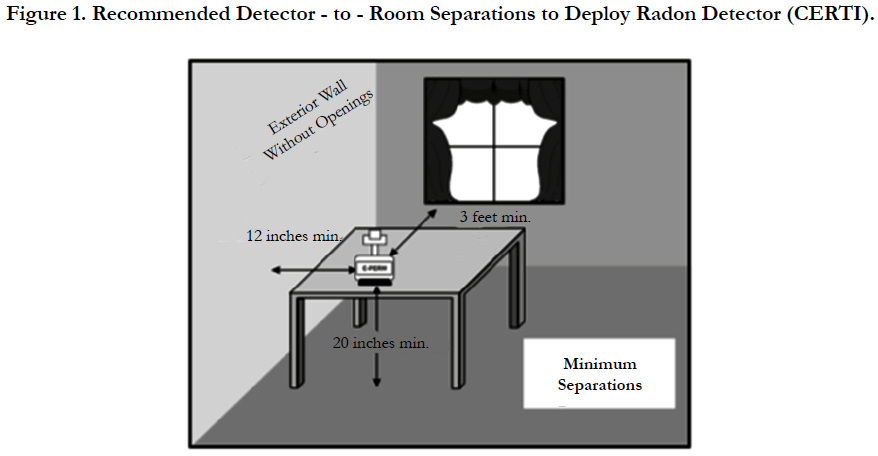
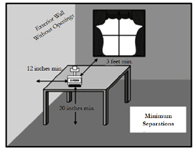
Figure 1. Recommended Detector - to - Room Separations to Deploy Radon Detector (CERTI).
The separations above were applied when taking sixty four indoor radon measurements. Types of rooms covered included dormitory rooms, classrooms, staircases, storages, and laboratories within the University of Sharjah. Hostel and classrooms were ventilated with air conditioners, whereas ventilation in stores and stairways was mostly coming from natural convection. With regards to dormitory rooms, students have the freedom to set their air conditioners to supply air at temperatures of their preference, ranging from a minimum of 16°C to the ambient indoor temperature without air conditioning of about 29°C. Moreover, we have sought the consent of students to participate in our survey, and they were informed about CERTI’s criteria above, to avoid biased data. Plus, CERTI’s separation criteria of measurements were upheld by placing SSTs in cages, to prevent any physical contact and ultimately dislocating the detector.
The radon detection kit used in this study was purchased from Rad Elec Inc by our institution, and is recommended by the Environmental Protection Agency (EPA) for passive radon measurements. This kit supports both short and long term radon measurements. However, we have ultimately focused on short term measurements ranging between two to five days. These measurements can be obtained via combining the more sensitive, short-term electret (ST) with the largest chamber for air collection (S-chamber). This combination is abbreviated SST. To assemble an SST configuration, the ST electret is to be attached to the S-chamber from below, similar to how a bottle cap is twisted to seal a water bottle for example. Furthermore, the voltage on the ST electret is to be read by a voltage reader, both before and after measurement.
Figure 2. Radon Detection Kit, Showing Open and Close S-Chamber, Electret Disc Reader to the Right, and an Electret Disc Down Below.
Analysis
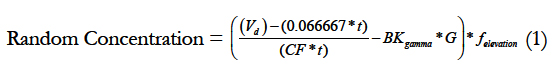
At the end of each measurement, the S-chambers are to be sealed, terminating the flow of air into attached electrets. Then, the electrets can be used to obtain radon concentration by mounting them on the electret-reader to obtain the total drop in voltage due to the presence of Radon. The radon concentration can be measured by the resulting decrease in voltage integrated over the period of measurement. According to eq. 1 [7].
Vd is the difference in voltage between initial and final readings.
t is the measurement time in days, with a minimum of 3 significant figures.
CF is the calibration factor for the device used.
BKgamma is the gamma background level in the room.
G is a chamber-dependent value and is obtained from the manufacturer’s table (0.087 for short-term S-Chamber)
felevation is the elevation correction factor and is only applicable for > 1,219 m.
Calibration Factor (CF) is a function of Electret and Chamber combination and can be calculated as shown in eq. 2:
CF = A + (B × MPV) ---- (2)
Where:
A & B are constants as a function of the chamber/electret configuration (A=1.69776, B=0.0005742 for short-term S-Chamber)
MVP is the middle point voltage, Vd/2.
With the voltage drop at hand after measurement, the software provided by the company will calculate the radon concentration in the test area, after providing it with the total time of measurement, combination used, background gamma radiation, and elevation. The software however, for documentation purposes, requires irrelevant data to be inputted every time a reading is to be obtained. These data include full names, addresses, and other personal information regarding the client as well as the measuring party. Therefore, we have developed our own radon calculator from scratch, to bypass this and obtain results faster.
The Radon Calculator software was designed in order to calculate the radon concentration in Bq m-3, and was programmed to calculate via the equations provided by Rad Elec in its manual that came alongside the radon detection kit. The software was developed using Microsoft Visual Basic. Visual Basic is a simple way to create programs for Microsoft Windows, and it uses “Beginners All-Purpose Symbolic Instruction Code” programming language. It is easier to create an application or a graphical user interface using the components provided in the software. An executable setup file was generated so that any user can use the “Radon Calculator” software in his/her computer after installation. Figure 3. below displays the starting window, which will appear on screen once installation is complete:
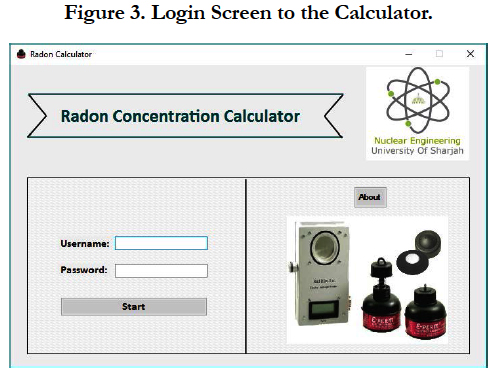
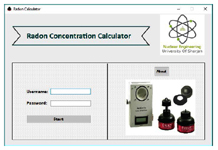
Figure 3. Login Screen to the Calculator.
This menu asks the user to enter their login details (username and password) to be able to access the calculator. Upon successful login, the window will close, and the calculator window will show up as seen in Figure 4. below.
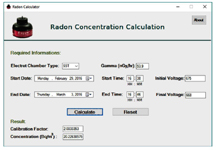
Figure 4. The User Interface.
By inputting the required data and choosing the start date and end date, the software now is able to calculate the concentration of Radon gas after pushing the “Calculate” button.
Results and Discussion
The result obtained are based upon conditions as they were observed at the time of the deployment and the changes made in conditions subsequent to the time of the survey were not monitored. However, the quality of measurements were controlled by placing the electret ion chambers in cages to prevent any physical contact. Moreover, the research team made sure to provide information about the study and how to handle the detectors to the people in the room.
The radon concentrations in all locations were calculated using the “Radon Calculator” software and they were recorded in a table in Microsoft’s EXCEL. The table describes the serial number of the electret, ID, location and room number, configuration, deployment and retrieval date and time, initial and final voltage, and finally the radon concentration.
The results of the measurements were divided into concentration groups, where each group covers a range of 10 Bq m-3, and they are plotted in Frequency-Concentration plot as shown in Figure 5.
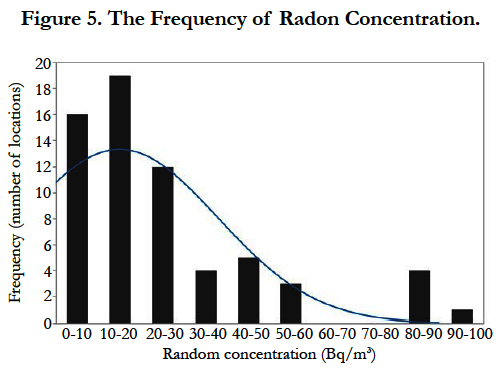
Figure 5. The Frequency of Radon Concentration.
For a building that was measured for indoor radon concentrations, the values are usually averaged. Moreover, Indoor radon concentration is often considered to follow a lognormal distribution over a certain area as shown in Figure 5 [8]. The radon concentration varied from 1.01 to 97.07 Bq m-3. Most of the locations, comprising of 47 measurement points (73.44% of data) have radon concentration less than 30 Bq m-3, with the most probable values ranging from 10 to 20 Bq m-3. Whereas, 5 locations reported values between 80 and 100 Bq m-3 and therefore, no follow-up test was needed. All radon levels were below the action level of 100 Bq m-3 recommended by WHO. The average radon concentration measured is 25.85 Bq m-3, which is below the national average indoor radon level of 48.1 Bq m-3 [9]. The results obtained were expected, since the majority of rooms were dormitory rooms, and these are well-ventilated. In addition, one of the dormitory rooms reported the maximum indoor Radom concentration of 97.07 Bq m-3 in our data.
A Comparison between our results and those of the Kingdom of Saudi Arabia (KSA), a bordering country to the United Arab Emirates with similar climate and geography, showed that the average radon concentration measured is below the average measured of 35 Bq m-3 in KSA. This agrees with around 75% of our data. Furthermore, our results showed lower variation in concentration of radon, whereas in KSA, radon concentrations were ranging between 7 and 150 Bq m-3 [10]. This is most likely due to the vast difference in the perimeter of study. Alghamdi and Aleissa carried out a survey in the city of Riyadh, KSA, to provide a data base that can assess the variability of exposure levels, and can show that the mean indoor 222Rn for 98.5% of the measured dwellings are below the WHO action level [11].
Due to the harmonized measurement process, the radon concentration between different locations can be compared.
From Figure 6, the average radon concentrations were recorded to be 35.77 Bq m-3 and 33.64 Bq m-3 for stores and staircases respectively. Furthermore, the average radon concentrations for selected dormitory rooms were 30.93 Bq m-3 and 16.32 Bq m-3 for classrooms. All in all, these concentrations are very low compared to the action level and we arrived to the conclusion that the indoor radon concentration within the University of Sharjah poses minimal lung cancer risk for students and professors alike.
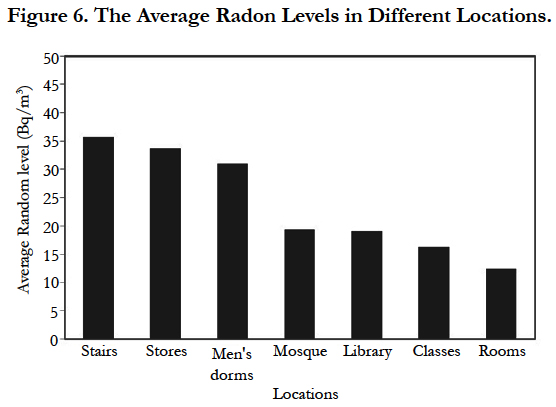
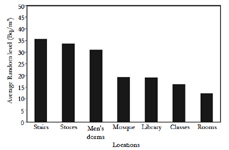
Figure 6. The Average Radon Levels in Different Locations.
Table 1 presents the code places of deployment, the number of samples measured, the radon concentrations (average, maximum and minimum) where the measurements where performed.
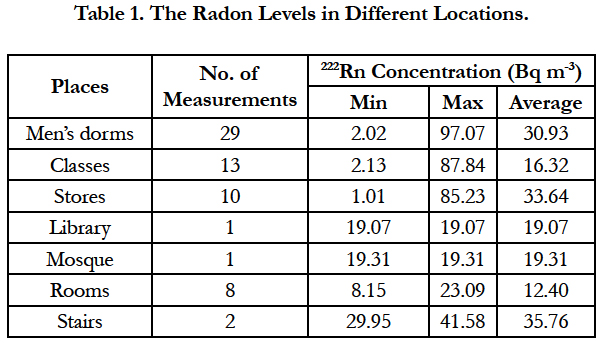

Table 1. The Radon Levels in Different Locations.
Radon concentrations will differ from room to room, and they may differ greatly, since they are usually not distributed uniformly in a building [12]. Furthermore, some of the buildings were constructed with ready-made concrete bricks resulting to lower radon exhalations. Furthermore, the bricks have less voids for the radon to emanate compared to other locations and hence, the radon produced from the concrete will be trapped.
There are several reasons for getting low radon concentration level in some locations [13]:
1. The hot weather in UAE encourages the closing of windows for most of the year.
2. The Uranium content is probably low in different constructional materials of building.
3. Most of the locations are built with cement which acts as a good insulating material.
Conclusion
A total of sixty four measurements were obtained at the University of Sharjah, to quantify the concentration of indoor radon. The peak concentration was found to be 97.07 Bq m-3 were close to WHO’s action level of 100 Bq m-3, but did not exceed it. Some of these five measurements were performed in areas with poor ventilation such as stores and staircases, others were in cooler ambient temperature that impeded the ascension of radon and promoted its accumulation. Most of these locations with outlying data are of no major concern since students and professors do not spend notable time there, giving negligible exposure to radon. Regardless, the average radon concentrations were recorded o be 35.77 Bq m-3 and 33.64 Bq m-3 for stores and staircases respectively. Furthermore, the average radon concentrations for selected dormitory rooms were 30.93 Bq m-3 and 16.32 Bq m-3 for classrooms. Since the majority of measurements were much lower than WHO’s action level of 100 Bq m-3, we conclude that the breathing-zone within the University of Sharjah is in pristine condition for its occupants, and the lung cancer risk associated with being there is minimal.
Acknowledgements
We lay our sincerest gratitude to the department of Nuclear Engineering and University of Sharjah for providing funding under the grant number (Ref. V.C.R.G/R. 474/2015) for the
equipment needed to engage in this study.
References
- Karimdoust S, Ardebili L (2010) The environmental impact of radon emitted from hot springs of Sarein (a touristic city northwestern Iran). World Appl Sci J. 10(8): 930–935.
- Alenezy MD (2014) Radon Concentrations Measurement in Aljouf, Saudi Arabia Using Active Detecting Method. Natural Science. 6(11): 886-896.
- World Health Organization (2009) WHO Handbook on Indoor Radon: a Public Health Perspective. WHO Press, Geneva.
- US Environmental Protection Agency. Radon Health Risks. August, 2015.
- US Environmental Protection Agency (EPA) (2007) A Citizen’s Guide to Radon. The guide to protecting yourself and your family from randon. US EPA, Washington, DC.
- ICRP (1994) Protection Against Radon- 222 at home and work, ICRP Publication 65, UK. 23(2): 1- 262.
- CERTI (2012) NRPP 56: Course Manual Revised. Rad Elec. 1-16.
- Kumar A (2009) Data collection for radon levels. http://www.eng.utoledo.edu/aprg/radon/datacoll.html
- EPA (2012) A Citizen’s Guide to Radon: The Guide to Protecting Yourself and Your Family from Radon.
- MI Al-Jarallah, Fazal-ur-Rehman (2006) Indoor radon concentration measurements in the dwellings of the Al-Jouf region of Saudi Arabia. Radiation Protection Dosimetry. 121(3): 293-296.
- Alghamdi A, Aleissa K (2014) Influences on indoor radon concentrations in Riyadh, Saudi Arabia. Radiat Meas. 62: 35-40.
- Roper W (1990) Toxicological Profile for Radon. Agency for Toxic Substances and Disease Registry.
- Maged AF, Borham EA (1997) A study of the radon emitted from various building materials using alpha track detectors. Radiat Meas. 25(1-4): 649- 653.


