Principal Component Analysis of Mouse Genomes Unravels Strong Genetic Robustness During Evolution
Reuveni E1*, Samson AO1, Giuliani A2
1 Faculty of Medicine in the Galilee, Bar Ilan University, Safed, Israel.
2 Istituto Superiore di Sanità, Environment and Health Department, Rome, Italy.
*Corresponding Author
Eli Reuveni,
Faculty of Medicine in the Galilee,
Bar Ilan University, Safed, Israel.
E-mail: eli.reuveni@biu.ac.il
Article Type: Research Article
Recieved: March 03, 2015; Accepted: March 09, 2015; Published: March 16, 2015
Citation: Reuveni E, Samson AO, Giuliani A (2015) Principal Component Analysis of Mouse Genomes Unravels Strong Genetic Robustness During Evolution. Int J Med Biotechnol Genetics. S1:001, 1-6. doi: dx.doi.org/10.19070/2379-1020-SI01001
Copyright: Reuveni E© 2015. This is an open-access article distributed under the terms of the Creative Commons Attribution License, which permits unrestricted use, distribution and reproduction in any medium, provided the original author and source are credited..
Abstract
Genetic robustness may have a crucial role in speciation. Nevertheless, its mechanism is still under debate. We analyze by means of principal component analysis the genomic correlation of several mouse subspecies and discriminate between two distinct and mutually orthogonal processes of genetic differentiation which can be equated to interspecific and intersubspecific divergence. While the first principal component is responsible for the separation of different species, the second and third principal component discriminates between different strains within the same species. We find that the across genome correlation distance is both robust and highly different between the two components, and displays a scale invariant distribution. We also report a scale invariant, heterogeneous (non-stochastic) 7 ray clusters of the system variation that may be equated to the biological process. These findings suggest that the correlation structure of millions of genetic elements along the genome is highly important during the process of evolution and may indicate of strong constraints. Moreover, based on our results, we postulate that the observed genetic robustness can distinguish between micro- and macro-evolution, a phenomenology that was predicted by the punctuated equilibrium model and gain more profound view for the role of complex interacting networks on genome evolution.
2.Keywords
3.Introduction
4.Materials and Methods
3.1 Genomic Data
3.2 Experimental Design
3.3 Distance Matrix Calculation
3.4 Principal Component Analysis
4.Results
4.1 First Principal Component
4.2 Second Principal Component
4.3 Third and Fourth Principal Components
4.4 Genetic Robustness
4.5 Non-Stochastic Distribution of Genetic Variability
4.5 Functional Classification
5.Discussion
6.Conclusion
7.Acknowledgement
8.Author Contributions
9.References
Keywords
Genetic Robustness, Principal Component Analysis, Evolution, Genome Segmentation, Punctuated Equilibrium.
Introduction
The rate of branching and diversification of life forms in evolution is a fundamental controversy between neo-Darwinian scientists and paleontologists. Neo-Darwinians claim that there are no fundamental differences between relative short time scale evolution (microevolution) and speciation (macroevolution) 12,14,16, 17]. Roughly speaking, the neo-Darwinian model is a strictly continuous paradigm which states that both branching and diversification can be explained by gradual accumulation of small independent genetic changes through natural selection [5, 6]. In contrast, paleontologists, on the basis of fossil data, demonstrate long period of stasis (no speciation) followed by speciation burst, which suggest that different mechanisms are responsible for speciation. The latter model, also known as “Punctuated Equilibrium” [4], suggests that speciation cannot be explained solely on the basis of small independent mutation. Punctuated equilibrium is a theory that can be also explained by the mechanism of genetic robustness defined herein as the ability of an organism to remain a distinct species despite environmental or genetic perturbation. Genetic robustness accounts are scarce with the majority including models of mutational connectivity as modular networks [1, 7, 15], 18], however those studies are generally focus on intrinsic molecular constraints which results in RNA misfolding and does not account for epistatic interaction between molecules on genomic scales. Moreover those models are based on theoretical computer simulation and lack the ability to verify them with empirical biological evidence.
As opposed to past traditional sequencing, new deep sequencing technologies allow to cover the pattern of point mutations across the entire genome (coding and non-coding regions) and therefore enables the use of novel holistic approaches to extrapolate the pattern of genetic divergence within and between different species underscoring the role of single genes during the process. To illustrate such pattern, it is essential to examine the distribution of Single Nucleotide Polymorphisms (SNPs) between and within species and the physical co-localization of genetic loci (synteny), thus undermining the role of duplication, translocation or aneuploidy in the process.
We use a recently published SNP dataset of 17 mouse strains including Mus musculus and M. spretus. Being the most studied mammalian model species, the mouse offers several advantages to study evolution. The species M. musculus has a unique population structure which includes three wild subspecies (with estimated time divergence of 1 million years [2,3, 11] and a collection of several laboratory inbred strains all of which were fully sequenced. In contrast to M. musculus population, M. spretus is a different mouse species which lives sympatrically to M. m. domesticus. The absence of any spretus-musculus hybrids in the wild suggests that the two species might have post zygotic barrier [8]. Nevertheless both species share similar synteny. These peculiar genomic and population qualities allow to make inference of the correlation structure of the genome by using genomic segmentation approach and to identify hierarchical feature of divergence in a single step analysis. Identification of strong and invariant correlation may support the existence of genetic robustness within and between genetic loci with biological evidence.
Principal Component Analysis (PCA) is a well suited technique to model divergence pattern using distance data matrix. Being a descriptive non-inferential approach, PCA allows inferring trajectory of divergence according to the genetic variance of millions of genetic loci simultaneously without the need to consider false positives or correct for familywise error rates when using confidence interval to estimate significance for each locus individually. Moreover, the reliance on the ortogonality of correlation flux assigned to each principal component in term of biological meaning (when it exists) allows us to identify features of divergence with association to different evolutionary scenario and quantitatively measure the amount of genomic correlation assigned to each principal component. Using permutation of genomic segmentation it is possible to examine a posteriori (i.e. without any effect on the extracted components) whether the observed correlation is resistant to perturbation and thus to assess if the original co-localization of genetic segments is imprinted or whether the observed correlation is due to pure chance.
Our analysis unravel that approximately 90% of the genome variation entity is highly correlated along different DNA segments. We further demonstrate that this correlation is coherent at different magnification scales correspondent to different choices of DNA segments length, suggesting strong robustness of correlation structure. In addition, we identify two principal components which capture the genetic variability of interspecific and intersubspecific origin and demonstrate that each one of them illustrates different behavior. Moreover, we illustrate that the projection of the genetic distance of wild-derived autosomes results in heterogeneous, non-stochastic distribution which collapses only after simulation of 99% of the total number of segments, suggesting that it is inherited feature of ordered co-localization DNA patches across the genome. We argue that those features indicate on strong genetic robustness which is imposed by the existence of strong regulatory machinery which in turn has a major effect on evolutionary trajectory and suggest that micro and macro evolution are distinct evolutionary process.
Materials and Methods
We have used SNP data obtained from 17 mouse strains sequenced by the Sanger institute [13]. The data posit of ~ 65 million high confidence SNPs calls and covers both, coding and non-coding regions. The data contain information from the following mouse strains: 1) 13 mouse laboratory strains (129P2,129S1/SvImJ, 129S5, A/J, AKR/J, BALB/cJ, C3H/HeJ, C57BL/6NJ, CBA/J, DBA/2J, LP/J, NOD/ShiLtJ, NZO/HiLtJ), 3 wild-derived M. musculus subspecies (CAST/EiJ [M. m. castaneus], WSB/EiJ [M. m. domesticus], PWD/PhJ [M. m. musculus]) and one wild-derived M. spretus species (Spretus/EiJ).
We used a novel approach described in our previous study [9] to identify pattern of genetic divergence. In short, our approach suggests that instead of making pairwise analyses of millions of genetic loci when many individuals are presented, it is possible to use only one distinct reference species in order to calculate a matrix which represents the genetic distance between all M. musculus derived strains to M. spretus. This approach enables to extract pattern of divergence from a single data whose columns (variables) correspond to the analyzed mouse strains and the rows (statistical units) are the genetic distances of each locus with the corresponding locus of M. spretus across the 16 strains.
The distance data matrix was calculated by using genome segmentation approach. For each DNA segment we have measured the relative genetic distance, wi = k/l , where wi is the genetic distance between each M. musculus and M. spretus strain relative to DNA segment i, while k is the number of point mutations in each DNA segment, and l is the length of the DNA segment in base pairs. In order to check whether our results are reproducible we have used several DNA segmentation strategies corresponding to individual patches from 50 to 10000bp length.
PCA is an optimal method to obtain a reliable signal-to-noise discrimination. In the context of our current study we used PCA to examine the correlation structure of the distance space separating M. spretus and M. musculus strains relying on the mutual orthogonality of the resulting eigenvectors. Such orthogonality may illustrate different trajectories of genomic evolution underlying the correlation structure between millions of genetic loci. PCA offers a dual representation of the analyzed data set in terms of component loadings (in our case the correlation coefficient between strains and components) and component scores (in our case the relative importance of a given locus for the corresponding component). The component loading space allows for a neat discrimination among strains, while component scores allow for the identification of most relevant loci for the different genome variation trajectories.
Results
In the following PCA application, we used genomic segmentation of 200bp length and included in the interpretation the following properties: loadings (the correlation of each strain with the associated principal component) explains the phylogenetic and shared functional classification of group of mouse strains, eigenvalues (proportion of explained variance) explains the fraction of genetic diversity that each principal component explains, scores as for the magnitude of contribution of each genetic segment (DNA segment) to the associated principal component. We used descriptive statistics to characterize the distribution and shape of the scores in order to infer biological relevance.
PC1 captured the genetic diversity which explains the divergence between M. musculus strains and M. spretus, hence the speciation. We find that the critical majority of the genetic variance of the distance data matrix was captured by PC1 (~ 90%). This was expected from the fact that genetic divergence owned to speciation should be significantly more dominant than the one derived from the intersun specific signal. Notably, the loading of PC1 were identical for al M. musculus strains (loadings = 0.6) proving that with relation to M. spretus, the correlation of the millions of genetic loci are nearly identical for the different strains. We analyzed the score distribution of the first principal component. Since the scores represent the magnitude of each DNA segment from the principal component, it is possible to characterize the likelihood of each genetic fragment to contribute to the divergence. In that case, segments which have extreme deviation from the mean may illustrate regions of rapid evolution and opposed regions with scores near the mean should evolve more slowly. We found that the distribution of the 8 million patches approximated a Gaussian distribution (kurtosis = 3.5). Interestingly the fact that PC1 approaches Gaussian distribution illustrates that the genetic divergence trajectory correspondent to PC1 is not influenced by few genes but derives from the collection (or possible interaction) of large fraction of the genome. That is each DNA segment is important for the branching event, even if with a continuous gradation (mirrored by component score). This particular distribution strongly suggests a unitary and coherent change across the entire genome.
While PC1 explained the critical majority of the variance relevant for speciation, we find that PC2 captured the genetic variance owned to the intersubspecific divergence (between M. musculus wild derived strains). In general PC2 correspond to 3% of the total variance and the loadings varies between M. m. casteneus = 0.8 and M. m. demesticus = -0.2. The fact the two strains have opposite sign loadings on PC2 qualifies second component as a ‘shape’ component: going ‘away’ from castaneus corresponds to ‘approaching’ domesticus. Interestingly, all the lab strains have similar loading values as to M. m. domesticus. This evidence is important since the lab strains are descendent of M. m. domesticus with little contribution from M. m. casteneus and M. m. musculus, a fact that asserts our reliability on the loading space as indicator for phylogenetic relationships. In contrast to PC1, the score distribution of PC2 is not Gaussian (kurtosis = 7) but is characterized by long tails collecting the specific physical locations responsible for the strain separation. Most important is our ability to classify a leading principal component which may explain speciation with modular components (PC2) captured by the minor principal components giving evidence for intersubspecific divergence is a proof-of-concept that both principal components may explain different evolutionary processes. In other words, while PC1 is macroevolution the minor components explain microevolution processes, such as natural selection or genetic drift. The fact principal components are mutually independent by construction may be a proof-of-concept of the existence of two distinct genomic variation trajectories for macro (between species) and micro (within species) evolution.
In accordance with biological interpretation of the first two principal components, we were able to assign a biological meaning for PC3 and PC4. Interestingly, while PC3 (like PC2) discriminates between wild derived species, PC4 discriminates two distinct groups of laboratory mouse strains. Moreover one may postulate that since the variance explained in PC4 is associated with lab strains which are recent descendent of M. m. domesticus this principal component capture the intra subspecific signal of genetic variation which can be later on treated as within subspecies divergence (short evolutionary time). In contrast, PC2 and PC3 are principal components which are more relevant to interspecies variation (longer evolutionary time).
The mathematical and biological distinction between leading and minor principal components is an important feature in our study rising from the robustness of the correlation between the distances computed over millions of DNA segments. We adopted the term “genetic robustness” to illustrate that each DNA segment has a threshold representing “mutability probability” (i.e., accounts for the number of mutations which are robust to changes with respect to the rest of the genome). This observation emphasizes the collective motion of millions of genetic elements that span the genetic distance and may appeal the assumption that each genetic element has its own selective coefficient, thus imposing more systematic behavior of DNA segments either in coding and non-coding regions. If the last was to occur, we would not expect to find such a strong robustness in the correlation structure, but rather observe more of a gradient decay in the percentage of variance between the first and minor components with less biological meaning. We further assessed the reproducibility of our results at different scales to strengthen the notion of genetic robustness. We repeated the analysis and varied the length (L) of the genome segmentation, to l = [50, 200, 500, 1,000, 2,000, 10,000] base pairs for each chromosome separately and applied PCA on the various distance matrix. We found that, the percentage of genetic variance and the loadings pattern were identical for all tested segment lengths in all chromosomes, pointing to scale invariant properties of genetic variation. Such scale invariance, due to the mutual constraints existing between different parts of the genome, gives further support to our results, i.e. indicating that genetic robustness may have dominant role during evolution
The scale invariant shape of genetic distance was repeatedly demonstrated in our analyses. It is important to note that scale invariant property is ubiquitous in systems with high interaction and a proper way for such system to maintain their stability in the face of perturbation. Even if the biological explanation for the observed scale invariant of the genetic distance is not straightforward, its existence illustrates that genomic segmentation at any size length is not random and exhibit non-stochastic organization.
We have further examined the scale invariant properties of the system variation, however this time we explored whether the DNA segments scores illustrate any particular shape or irregular distribution. As discussed above our PCA paradigm can distinguish between long to short evolutionary episodes given a certain loading profile. In addition, since the distribution of scores in each principal component approximates the amount of explained variance which is minimal in the minor component (< 2.5% in PC2-PC4), any observed features which are apparent in the transformed data is encrypted when looking in the native dataset. The real power of PCA is that it enables us to observe such encrypted feature lowering the resolution to a fraction of percentage from the total variability. This potentially enables us to find concordance between encrypted features and the biological process extrapolated from the loading signals. Interestingly, we find that the scores distribution varies significantly across the first four principal components when looking at the 2D scatterplot of the score distribution. Fig 1a illustrates a scatterplot of the scores relative to PC2 and PC3 (wild-derived divergence) giving rise to seven cluster (star) shape. The figure illustrates heterogenic (nonrandom) shape with six equidistant clusters (arms) decaying with decreasing intensity away from a common central (core) region. It is important to note that PC2 and PC3 capture the genetic variance which discriminates wild derived subspecies, hence account for 2.5% of the variance and are lightly mixed with the signal deriving from laboratory strains (PC4). This simply stems from the fact that principal components are orthogonal to each other and therefore any observed signal depends on the rotation of the variance. There are two reasons to generate such an ordered cluster distribution:
1) biological reason,2) mathematical discretization due to low number of mutations sampling from short genomic segments. In order to exclude mathematical artifacts we used permutation test on the real dataset in the following manner. We used the original distance data matrix by bootstrapping each row (exchanging DNA segments in random position selection) so that each strain j may contain different genetic distance for each DNA segment in position i, however keeping the record of the segment position. By using this method it is possible to maintain the position of DNA segment, and to verify whether having different values across genome maintain the correlation and the distribution of score after PCA projection. If the permutation does not change the score distribution, then we can conclude that the ordering structure of DNA segments across the genome is not important and our analysis is biased due to low number of mutations. However if the seven clusters collapse due to the permutation then we can conclude that the ordering co-localization across DNA segment is important in order to keep the correlation robust. Interestingly we find that that only by permuting > 99% of the DNA segments the clusters are collapsed into single core region (Fig 1b). We find that permutations of < 99% of the DNA segments do not have much effect on the 7 clusters. Moreover, projecting PC3 and PC4 (laboratory strains) to 2D scatterplot does not results in the clustered form displayed previously, suggesting that 7 ray clusters (Fig 1c) characterize divergence between wild-derived species. Additionally, we explored whether those clusters depends on chromosome origin and repeated the analysis for each chromosome separately. We conclude that the same clusters with the same orientation are invariant in the autosomes of wild-derived origin. Exceptionally, the X chromosome and autosomes of laboratory strains do not display the same seven clusters shape. In addition 2D projection of PC5 to PC17 which did not result in any biological interpretation (stochastic noise) had similar distribution to the simulation. Moreover, we repeated the analysis with different DNA segments length and found that PCA projection gave the same results even for segments with length > 50,000bp.
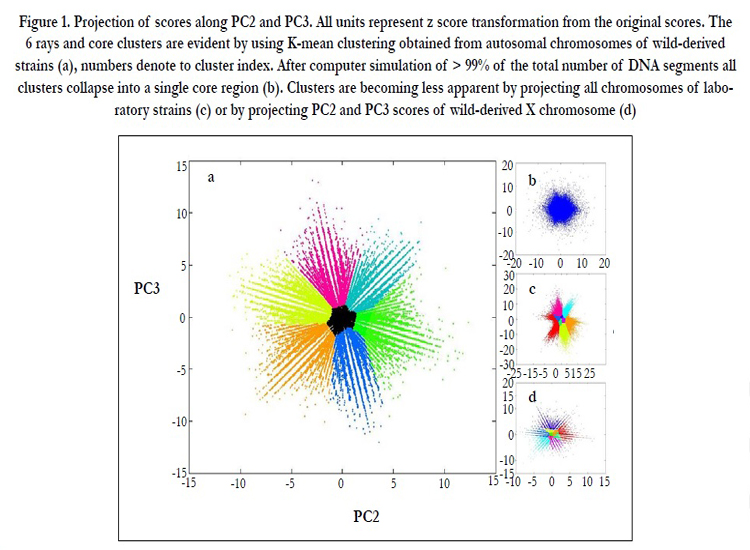
Figure 1. Projection of scores along PC2 and PC3. All units represent z score transformation from the original scores. The 6 rays and core clusters are evident by using K-mean clustering obtained from autosomal chromosomes of wild-derived strains (a), numbers denote to cluster index. After computer simulation of > 99% of the total number of DNA segments all clusters collapse into a single core region (b). Clusters are becoming less apparent by projecting all chromosomes of laboratory strains (c) or by projecting PC2 and PC3 scores of wild-derived X chromosome (d)
We used K-means clustering in order to test whether we can find any functional classification enrichment on chromosome or chromosome regions (coding, non-coding, promotor or long intergenic regions). As expected, we isolated 7 clusters, 6 clusters including DNA segments which are located in the arms of the star and one cluster including segments from the core (Fig 1a). In general we find that the main difference between clusters 1-6 and the core cluster is the distribution of segments in chromosome X. Accordingly, we found that while clusters 1-6 are under-enriched significantly, the core cluster is over-enriched in this chromosome.
Discussion
Next Generation Sequencing (NGS) offers a great opportunity to extensively study genome evolution. The ability to sequence populations and to obtain high resolution SNPs density allows qualitatively and quantitatively to gain insight into the correlation structure of the genome. Identification of genomic correlation is one of the key mechanisms to appraise the degree of epistasis and the effect it may have on evolutionary processes. Moreover, invariant genomic correlation is a good indication for strong genetic robustness which is one of the key mechanisms that may results in punctuated evolution.
In this study, we used novel PCA based approaches suitable for massive sequencing technology to scan for patterns of genomic divergence. Our framework is different from pairwise distance based methods in few aspects: first we rather compute a distance matric between all M. musculus strains with M. spretus. This allows us to increase certainties regarding speciation having one common reference against many strains. Moreover, identification of minor components with biological meaning stemming from subspecific divergence is made without pre-computation of genetic distance within M. musculus and is a proof of concept that subspeciation can be inferred from the ortogonality of correlation flux between speciation and subspeciation. One of the main drawbacks in our study is the unequal size of laboratory and wild strains (having only three wild subspecies and 14 laboratory strains) which may affect the results. However even if such a bias could exist we demonstrate that PCA projection successfully made a clear discrimination between wild and laboratory strains in both, loadings and score distribution.
Our results indicate on two main eigenvectors that can be equated to subspecific and intersubspecific origin. We find that in many aspects, the two processes are orthogonal and different in nature. While speciation is identified by Gaussian distribution suggesting that most of the genetic variation is common for all DNA segments, intersubspecific variation show tailed distribution indicating that only small amounts of variation is responsible for the process. This insight is further supported by careful examination of the variance and the loading profile of the first two principal components. While the PC1 captures > 90% of the total variability with a common loading profile for all M. musculus strains, PC2 decline dramatically to ~ 2% of the variability and therefor indicates on robust correlation structure. Interestingly, the projection of the second and the third principal components into 2D scatterplot demonstrates a robust non-stochastic universal 7 clusters distribution which is scaled invariants under any DNA segment length. Moreover, the orientation of the clusters maintains the same position for any DNA segment lengths. We find that this 7 clusters organization is robust only by projecting the autosomes of wild-derived strains, however the seven clusters structure collapses when projecting the genetic variation of laboratory strain and of the X chromosome. We have further used computer simulation and illustrate that permutation of only > 99% of the DNA segments is needed to destroy the clusters into one single core region. All the results stated above illustrates that since the distance between DNA segments of autosomes of laboratory strains and of X chromosome is much smaller than between autosomes of wild-derived subspecies, the signal due to correlation is less apparent and thus cannot be captured by PCA projection. Interestingly, this signal is only apparent when having more abundant SNP density which in turn can eliminate bias of technical and stochastic noise. Recent study found similar seven ray clusters by examination of codon frameshifts in microbial genome [10] . In that study, the authors concluded that such clustered organization is imprinted by the existence of an ordered translation machinery of codons along coding regions. They further demonstrate that frameshifts results in non-ordered clustered shape. Even if not directly related to our study, the existence of similar ordered structure of codon frequency is important in illustrating possible phenomenological, yet not explained organization of correlated variation along the genome.
Conclusion
In conclusion, our results illustrate that the genome is composed of linked and correlated millions of DNA segments which illustrate a scale invariant properties. Such a coherent correlation and non-stochastic organization is apparent and may give further support to robust regulatory machinery which exists in genome-wide scales and may have strong effect on the pace of evolution and speciation.
Acknowledgement
We would like to acknowledge Professor Charles Webber from Stritch School of medicine, Loyola University, for linguistic help.
Author Contributions
Conceived, designed and performed the analysis: ER. Wrote the paper: ER, AG and AOS. Provided advice: AOS.
References
- Borenstein E, Ruppin E (2006) Direct evolution of genetic robustness in microRNA. Proc Natl Acad Sci U S A 103: 6593-8.
- Boursot P, Auffray J.C, Brittondavidian J F B (1993) The evolution of house mice. Annu. Rev. Ecol. Syst. 24: 119–152.
- Boursot P, Din W, Anand R, Darviche D, Dod B, et al. (1996) Origin and radiation of the house mouse: Mitochondrial DNA phylogeny. J. Evol. Biol. 9: 391-415.
- Eldredge N, Gould S. J (1997) On punctuated equilibria. Science 276: 338- 41.
- Erwin D. H (2011) Macroevolution: dynamics of diversity. Current Biology 21(24):1000-1001.
- Fisher R. A (1930) The Genetical Theory of Natural Selection Clarendon, Oxford.
- Fontana W, Schuster P (1987) A computer model of evolutionary optimization. Biophys Chem 26: 123-47.
- Fossella J, Samant S. A, Silver L. M, King S. M, Vaughan K. T, et al (2000) An axonemal dynein at the Hybrid Sterility 6 locus: implications for t haplotype- specific male sterility and the evolution of species barriers. Mamm Genome 11: 8-15.
- Giuliani A (2010) Collective motions and specific effectors: a statistical mechanics perspective on biological regulation. BMC genomics, 11(Suppl 1), S2.
- Gorban A, Popovab T, Zinovyev A (2005) Codon usage trajectories and 7-cluster structure of 143 complete bacterial genomic sequences. Physica A: Statistical Mechanics and its Applications 353: 365–387.
- Guenet J. L, Bonhomme F (2003) Wild mice: an ever-increasing contribution to a popular mammalian model. Trends Genet 19: 24-31.
- Huxley, J. S (1942) Evolution: The Modern Synthesis. Allen & Unwin, London.
- Keane T. M, Goodstadt L, Danecek P, White M. A, Wong K, et al. (2011) Mouse genomic variation and its effect on phenotypes and gene regulation. Nature 477(7364):289-294.
- Pennisi E (2008) Evolution. Modernizing the modern synthesis. Science 321: 196-7.
- Schuster P, Fontana W, Stadler P. F, Hofacker I. L (1994) From sequences to shapes and back: a case study in RNA secondary structures. Proc Biol Sci 255: 279-84.
- Simpson G. G (1945) Tempo and mode in evolution. Trans N Y Acad Sci 8: 45-60.
- Smocovitis V.B (1992) Unifying biology: the evolutionary synthesis and evolutionary biology. J Hist Biol 25: 1-65.
- Stadler B. M, Stadler P. F, Wagner G. P, Fontana W (2001) The topology of the possible: formal spaces underlying patterns of evolutionary change. J Theor Biol 213: 241-74.


