Nutritional Habits in Summer Season Among Latvian Type II Diabetic Patients with Excessive Weight
Sargautiene V1*, Zarins Z2, Ligere R1, Gailisa U3
1 University of Latvia, Riga, Latvia.
2 Riga Stradins University, Riga, Latvia.
3 Pauls Stradins Clinical University Hospital, Riga, Latvia.
*Corresponding Author
V. Sargautiene
University of Latvia, Riga, Latvia.
Tel: +371 28728338
E-mail: vandasarg@outlook.com
Received: June 13, 2016; Accepted: July 08, 2016; Published: July 09, 2016
Citation: Sargautiene V, Zarins Z, Ligere R, Gailisa U (2016) Nutritional Habits in Summer Season Among Latvian Type II Diabetic Patients with Excessive Weight. Int J Food Sci Nutr Diet. 5(7), 305-312. DOI : dx.doi.org/10.19070/2326-3350-1600055
Copyright: Sargautiene V© 2016. This is an open-access article distributed under the terms of the Creative Commons Attribution License, which permits unrestricted use, distribution and reproduction in any medium, provided the original author and source are credited.
Abstract
A cross-sectional nutritional survey was carried out at the Latvian capital endocrinology outpatient clinic at Paul’s Stradins Clinical University Hospital from June to August 2015. The aim of the present study was to investigate nutritional habits and its adherence to dietary recommendations among overweight/obese type II diabetes mellitus patients in Latvian summer season. A total of 50 non-insulin dependent T2DM patients were interviewed 16(32%) were men and 34(68%) were women. The mean of age was 61 ± 9 years for women, and 56±10 years for men (p=0.06). The mean duration of diabetes was 8 ± 6 years, glycated hemoglobin (HbA1c) was 7±0.5. Mean body mass index (BMI) of patients was 34.3±5 kg/m2. Clinical and nutritional information were assessed using the clinical history-taking and single 24-h dietary recall method. The plausibility of reported energy intake in the present study was determined by Goldberg method. Results of diet records were compared with dietary recommendations. In our study 22% of type 2. diabetic patients were energy under-reporters. Mean energy intake among plausible reporters was 2070 kcal/d. Mean carbohydrates intake among patients was 39 ± 7 % E, proteins 23 ± 5% E, fats 38 ± 6% E, dietary fiber 13 ± 4g/1000 kcal. Although all T2DM patients reported their daily intakes of vegetables, however, excessive saturated fat and animal protein intake was investigated. We found statistically significant positive correlation between BMI and intakes of energy (kcal), proteins (g/d), fats (g/d), and saturated fats, as well as negative correlation between BMI and intakes of dietary fiber (g/1000kcal).
2.Introduction
2.1.Study aim/objective
3.Subjects and Methods
3.1.Study population
3.2.Dietary assessment method
3.3.Energy requirements and identification of under reporters
3.4.Statistical analysis
4.Results
4.1.Energy under reporters
4.2.Macronutrients
4.3.Dietary fiber, carbohydrates
4.4.Fats
4.5.Proteins
4.6.Dietary intake and correlation with BMI
5.Discussion
6.Conclusion
7.References
Keywords
Apigenin; Luteolin; Hesperidin; Naringenin.
Introduction
FDiabetes mellitus type 2 is a long-term metabolic disorder that is characterized by high blood sugar, insulin resistance, and relative lack of insulin [1]. Increases in overweight and obesity, unhealthy diet and physical inactivity are risk factors for diabetes. Dietary therapy and physical activity have possibility to improve clinical and metabolic outcomes, as well as to prevent complications of diabetes [4].
Weight management should be the primary nutritional strategy in managing glucose control in type 2 diabetes for people who are overweight or obese [41].
Dietary patterns characterized by low intakes of saturated fat and higher intakes of unsaturated fat, as well as diets of low glycemic index/load and higher in dietary fiber and whole grains are protective [41].
Although many patients receive nutrition recommendations, little is known about food intake status in patients with T2DM in summer season. Seasonal climate differences may affect eating habits and level of physical activity. In Latvian summer season, fresh fruits and vegetables are available for a relatively good price and huge variety from local producers compared with the winter season.
Authors in different countries have already described differences related to season in the intake of cereals, milk products, fats, vegetables and fruits [6, 7]. The assessment of dietary intake based on data reported by the study participants is often prone to errors [8]. In our study all T2DM patients were overweight or obese, previous studies have shown, that under reporting of energy intake is common when assessing it in overweight or obese adults [9-11]. The identification of misreports of foods consumed (including under-reporters and over-reporters) is an important aspect in the assessment of uncertainties in food consumption data. Still, there are no methods and criteria for evaluation of misreporting of foods consumed that are widely accepted as the best choice for different age/sex groups in dietary surveys resulting in difficulties to compare the data directly between countries [12].
The plausibility of reported energy intake in the present study was determined by Goldberg cut-off method, updated by Black, it is the most used method for assessment of misreporters of energy intake [8-10]. Goldberg method takes into account the errors associated with the number of subjects, the length of the dietary assessment and variation in each of food intakes, basal metabolic rate and physical activity.
To our knowledge, the evaluation of seasonal dietary habits, its adherence to dietary recommendations, and identification of energy under reporting in diabetic patients has not been investigated previously in Latvia.
The aim of the present study was to investigate nutritional habits and their adherence to dietary recommendations among overweight/ obese type II diabetes mellitus patients in Latvian summer season.
Subjects and Methods
Fifty non-insulin dependent T2DM patients who have been followed up at the Latvian capital endocrinology outpatient clinic Paul’s Stradins Clinical University Hospital, and agreed to the investigation about food intake were included.
The information from patients was collected at the time of visiting a public endocrinology outpatient clinic from June to August 2015. Patients were invited to participate in the study after the endocrinologists consultation, when we explained the purpose of the study and the confidentiality of identification.
Inclusion criteria for patients in our study were the following: Both sexes type 2. Non-insulin dependent diabetic patients, age 40-75 years.
Exclusion criteria: cognitive impairment, patients >75 years, HbA1C > 7.5, insulin therapy, fasting, vegetarians.
Weight status was defined by calculating Body Mass Index (BMI), which is computed as body weight (kg) divided by height squared (m²). The World Health Organization (WHO) - BMI standards [24] were adopted to define obesity: <18.5 kg/m² = underweight; 18.5 – 24.9 kg/m² = normal weight; 25 – 29.9 kg/m² = overweight 30+ kg/m² = obese.
All the organizational issues regarding the survey were discussed prior to the research with the Latvian capital endocrinology outpatient clinic Paul’s Stradins Clinical University Hospital and with the Bioethics Committee. Permission to carry out the study was issued by the Bioethics Committee of the Faculty of Medicine at University of Latvia on March 3, 2015.
The actual summer dietary habits of Latvian T2DM patients were investigated using single 24-h dietary recall method. The survey was performed by a trained interviewer using the face-to-face method at the endocrinology outpatient clinic at Paul’s Stradins Clinical University Hospital. The important factors in face-to-face method to obtain complete information are the use of open-ended questions, a non-judgemental manner/a neutral attitude/avoid asking questions in a manner that might influence the subject’s responses, and the use of key questions and memory aids [12].
Data were collected for the previous day or over the 24-hour period, either backward or forward. The participants were asked to recall the food and drinks consumed, food preparation methods, recipe ingredients, brand names of commercial products, use of dietary supplements, how much was consumed and specific information of the food (low fat, etc.).
To estimate the portion size, household measures and pictorial guide for portion size were used. The foods on this guide have been validated by expert nutritionists [13]. The book contains photos of popular food and drink items, displays different portions of products and meals assessed in grams, making it possible to record the amounts of all food products and meals consumed. To determine daily calorie and macronutrient intake of some foods consumed at national level, the national food lists were used [14].
The calculations of the nutritional components were calculated using Nutrisurvey 2007 Software [15].
Carbohydrate, protein and fat intakes are expressed as percentage of total daily energy intake (%E); dietary fiber is expressed as g/1000 kcal. As well, consumed amount (g/day) of main food groups has been examined. Diet records were compared with the dietary recommendations [2, 5, 32, 38, 41].
Prevalence of under-reporting (UR) of energy intake was investigated using Goldberg cut-off method, updated by Black [9, 10]. To estimate basal metabolic rate (BMR) of each studied individual it was recommended to apply the equation of Schofield [16]. Because the Schofield equations have been found to lead to overestimation of BMRs among obese subjects [17, 18], we classified implausible reporters by using alternative BMR equations, the Mifflin-St Jeor method, which have been shown to correspond well with measured values in both obese and non-obese subjects, and it also had the narrowest error range [19]. The calculations were otherwise identical to the Goldberg method.
The Goldberg Equation is widely used in clinical nutrition and elsewhere to determine the validity of the reported energy intake from diet recalls [9]. Implausible reporters had reported energy intake (EIrep)/estimated basal metabolic rate (BMRest) values that differed from physical activity level (PAL) by more than ±2 standard deviations when standard deviations were calculated as prescribed by Black [9].
The participants estimated the time they spent performing physical activities last week. Physical activity level (PAL) was assessed using the International Physical Activity Questionnaire (IPAQ) items [20].
Statistical analysis was performed using the programs MS Excel 2013 and IBM SPSS 22.00. Results are expressed as mean, standard deviation (± S.D.).
Independent samples t-tests were used to compare the mean values for these variables between the plausible and under-reporter groups.
Comparisons between reported and recommended means of dietary intakes were carried out using one sample t-test (two-tailed). Pearson correlation was used to identify linear dependences between variables. Results were considered significant at a conventional p < 0.05 level.
Results
A total of 50 T2DM patients were interviewed out of who 16(32%) were men and 34(68%) were women. Table 1. shows the anthropometric characteristics of the study sample. Based on the World Health Organization (WHO) definition of overweight and obesity all interviewed patients were overweight or obese. Mean BMI of patients was 34.3 ± 5 kg/m2. The mean age was 61 ± 9 years for women, and 56 ± 10 years for men, (p=0.06). The mean duration of diabetes in the interviewed patients was 8 ± 6 years, glycated hemoglobin (HbA1c) was 7 ± 0.5.
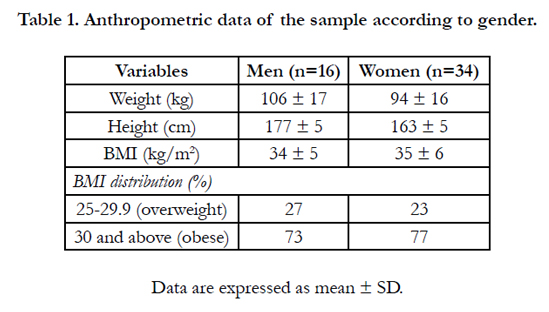

Table 1. Anthropometric data of the sample according to gender.
In summer, our studied patients typically participate in walking and gardening and are at the level of moderate physical activity, equivalent to 30 minutes of at least physical activity of moderate intensity on most days accumulated in leisure and work time [20].
We evaluate misreporting at individual level by calculating cutoffs for moderate physical activity (PAL=1.6). The subjects in our study with calculated values of the ratio EIrep:BMRest in the interval 0.90-2.84 are classified as plausible reporters. The subjects with individual EIrep:BMRest < 0.90 are categorized as underreporters, the subjects with individual EIrep:BMRest > 2.84 are categorized as over-reporters.
Comparing determined EIrep:BMRest of each studied subject, using the Goldberg equation lower and upper cut-off points for the corresponding moderate physical activity category (PAL=1.6), 22% of T2DM patients were under-reporters (UR). The rate of underreporting in men was 21%, while in women was 24% (Table 2). There were no over-reporters in the sample.
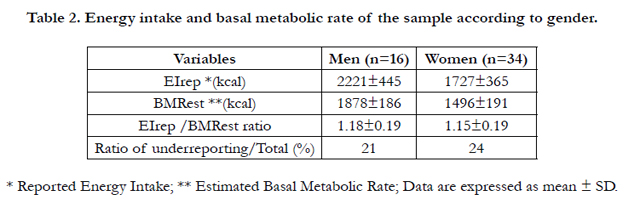
Table 2. Energy intake and basal metabolic rate of the sample according to gender.
Because the exclusion of UR from datasets would introduce bias, they were identified, but not excluded from the dataset [8].
The average intakes of energy, macronutrients, main food groups and comparison between plausible and UR are detailed in Table 3 for men and women. Reported portion sizes (g/d) of main food groups (Table 3) were calculated in consumers only.
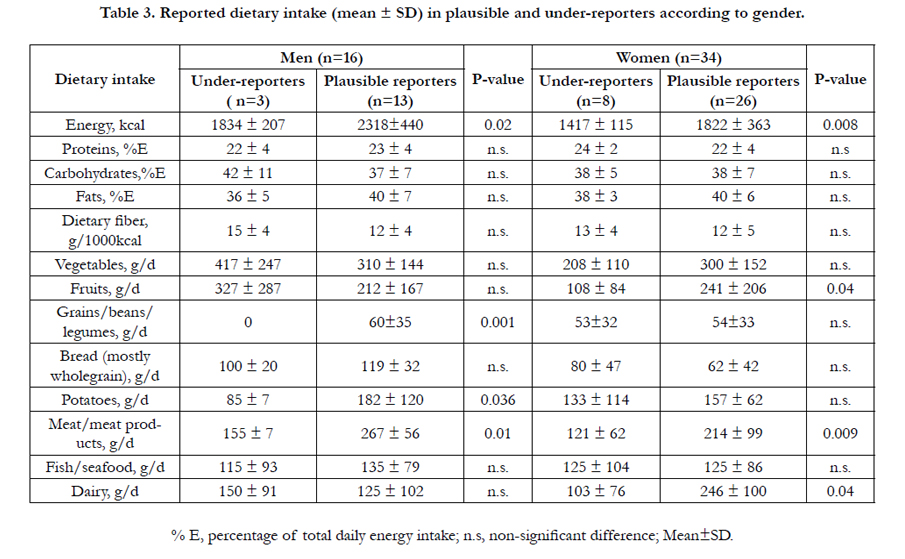
Table 3. Reported dietary intake (mean ± SD) in plausible and under-reporters according to gender.
It was found, that plausible men compared to women had a significantly higher intake of meat/meat products (+53g/day, p=0.05), bread (+57g/day, p=0.003). However, plausible women compared to men had a higher intake of dairy (+121g/day, p=0.05).
Dietary intakes of fruits, meat/meat products and dairy were lower in women who underestimated their food intake, while UR men reported lower intakes of potatoes, meat, grains/beans/legumes (Table 3).
In previous evidence based recommendations for diabetic patients having light or moderate physical activity recommended carbohydrate content must amount to 45-60% E, protein content must amount to 10-20% E, the percentage of energy from fat should be between 25-35% E according to Diabetes and Nutrition Study Group (DNSG) [5].
However, recent evidence is inconclusive for an ideal amount of macronutrient intake for people with diabetes, therefore goals should be individualized [3, 41].
In our study mean carbohydrates intake among patients was 39 ± 7g/d. Dietary fiber intake was 14 and 12 g/1000 kcal, respectively, for men and women. Comparison to EFSA recommendations daily dietary fiber intake (g/d) was lower in women (p<0.05), but not in men (p>0.05), 22 ± 4 g/d and 20 ± 6 g/d, respectively, for men and women, vs 25g/d.
People with diabetes should consume at least the amount of fiber and whole grains recommended for the general population [3]. Intake of dietary fiber is associated with lower all-cause mortality in people with diabetes [3].
Evidence is insufficient to support one specific amount of carbohydrate intake for all people with diabetes. For good health, carbohydrate intake from vegetables, fruits, whole grains, legumes, and dairy products should be advised over intake from other carbohydrate sources, especially those that contain added fats, sugars, or sodium [3].
In the present study main sources of carbohydrates in T2DM patients were potatoes, bread, fruits, vegetables and dairy. All patients reported their daily intakes of vegetables. The consumption of grains/beans/legumes were less common in our studied group. Bread and fruits were less frequently reported by women than by men (Table 4).
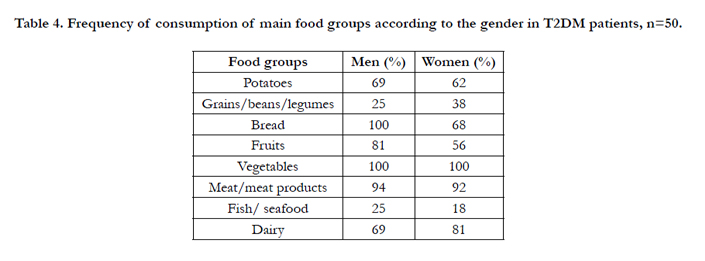
Table 4. Frequency of consumption of main food groups according to the gender in T2DM patients, n=50.
In our studied patients mean fat intake was 38 ± 6 %E. Saturated fats (SFA) contain of 16% of daily calories, cholesterol 276 mg/d.
The amount of dietary saturated fat and cholesterol recommended for people with diabetes is the same as that recommended for the general population. These recommendations include reducing SFAs to <10% of calories, aiming at < 300 mg dietary cholesterol/ day [3].
Individuals with diabetes should be encouraged to moderate their fat intakes to be consistent with their goals to lose or maintain weight [3]. Fat quality appears to be far more important than quantity. In people with type 2 diabetes, a Mediterranean-style, monounsaturated fatty acid (MUFA)-rich eating pattern may benefit glycemic control and CVD risk factors and can, therefore, be recommended as an effective alternative to a lower-fat, highercarbohydrate eating pattern [3].
There is limited evidence of people with diabetes on the effects of omega-6 polyunsaturated fatty acids (PUFAs) [3].
Mean protein intake was 23 ± 5 g/d, main sources of them were meat and dairy, however fish/seafood were less common among T2DM patients (table 4).
For people with diabetes and no evidence of diabetic kidney disease, evidence is inconclusive to recommend an ideal amount of protein intake for optimizing glycemic control or improving one or more CVD risk measures. Therefore, goals should be individualized [3].
Since all of our studied patients were overweight/obese, additionally we analyzed correlation between BMI and dietary intake (Table 5.)
We found statistically significant positive correlation between BMI and intakes of energy (kcal), proteins (g/d), fats (g/d), and saturated fats. As well negative correlation between BMI and intakes of dietary fiber (g/1000 kcal) (Table 5).
As was mentioned above (table 4), reason for this may be that patients with higher BMI consume more dairy, meat/meat products rich in proteins and fats, especially saturated fats.
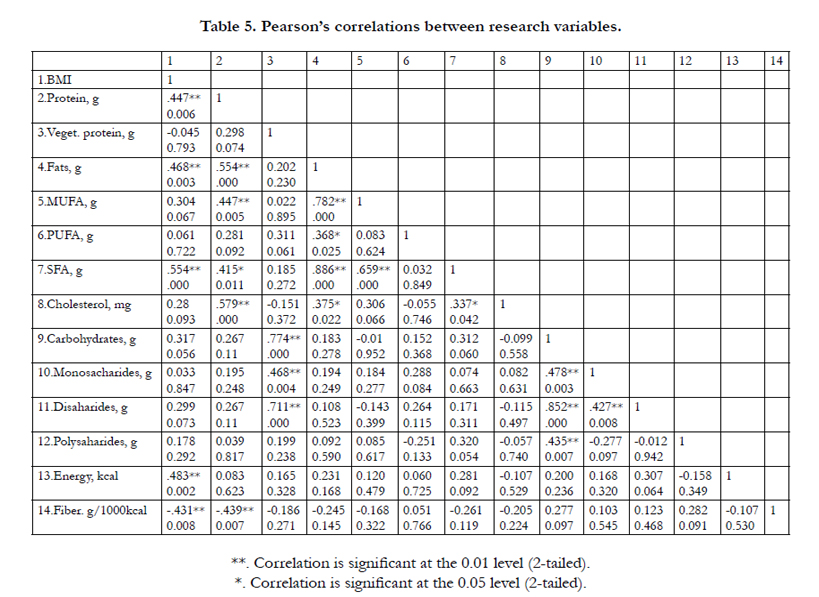
Table 5. Pearson’s correlations between research variables.
Discussion
Climate conditions may cause seasonal variations in dietary patterns. In the present study, the assessment of dietary intakes was obtained in Latvian summer season, when fresh fruits and vegetables are available for a relatively good price and in huge variety from the local producers.
World Health Organization recommend a daily intake of at least 400g of fruits and vegetables per day (250 g/d of vegetables and 150 g/d of fruits) [22]. In our study average intakes of vegetables in T2DM patients was adequate. However only 56% of women reported their fruit intake during 24-hr recall. The reason of this could be the tendency to underreport fruit intakes by women more than men, what is seen in our study.
Recent randomized controlled trial was investigated the effect of increased fruit (+1 serving; 150 g/d), vegetable (+2 servings; 150 g/d) intake in people with type 1 and type 2 diabetes on common carotid intima media thickness (CCA IMT) progression, a marker of subclinical atherosclerosis and predictor of cardiovascular disease. Results of this study shows that improving dietary quality in people with well-controlled type 1 and type 2 diabetes may slow CCA IMT progression [37].
The EFSA Panel notes that in adults there is evidence of benefit to health associated with consumption of diets rich in dietary fiber, e.g. reduced risk of coronary heart disease and type 2 diabetes and improved weight maintenance. Such evidence should be considered when developing food-based dietary guidelines [2]. Despite the fact that our study took place in summer, the study shows that dietary fiber content does not adhere recommendations. An important mechanism of action for dietary fiber is fermentation in the colon and changes in gut microbiota. It is estimated that about 30 g of good bacteria are produced for every 100 g of fermented dietary fiber. Regular consumption of the recommended amount of fiber has the potential to attenuate glucose absorption rate, prevent weight gain, and increase the load of beneficial nutrients and antioxidants in the diet [39]. Nutritional obesity is associated with gut microbiota dysbiosis. This leads to occurrence of gut permeability, promoting metabolic endotoxaemia and initiating the development of low-grade inflammation and insulin resistance in the liver, muscles and adipose tissue [34-36].
Some bacteria in the digestive tract have been found to produce a trimethylamine-N oxide (TMAO). Increased meat consumption could elevate the dose of L-carnitine and enhance trimethylamine- N oxide (TMAO) production by the gut microbiota thereby contributing to higher risks of cardiovascular disease or kidney disease [31, 40]. This is especially important to know for diabetic patient, because half of people with diabetes die of cardiovascular disease. 10-20% of people with diabetes die of kidney failure [40].
Another study results shows that diet high in protein but reduced in carbohydrates and fiber affects the gut microbiota and fatty acid profiles in obese men. After a 4-week period, the high-protein diet resulted in a significant decrease in fecal cancer-protective metabolites and increased concentrations of hazardous metabolites. Furthermore, a high intake of protein also decreased fiber-derived antioxidant phenolic acids and their derivatives [33].
As a matter of fact, there is a possibility that the patients consciously underreported their intakes in fiber and carbohydrates rich foods, as in their opinion diabetes is related to high carbohydrate content.
From the studied group the rate of energy underreporting in men was 21%, while in women was 24%, and this result agrees with Norway study, there the difference between the proportion of women (17%) and men (15%) who were underreporting was small [22]. However, in another study percentage of under-reporters was higher (50% males and 66% females) [9].
In a similar tendency to our study, SeungheeKye et.al. compared the average food intake among plausible and UR women and observed decreased meat and fruits intake [11]. However, different from these findings, we also found decreased dairy intake in UR women. In our study intakes of potatoes and meat were lower in men who underestimated their food intake. These findings are similar to the previous study [11].
Explanation for energy underreporting among TDM patients may be related to psychological and behavioral characteristics associated with excessive body weight, which can lead to energy and meal size underreporting.
Our study shows excessive meat and protein intake among studied patients. Greater total, unprocessed, and processed red meat intakes were associated with higher plasma C-reactive protein (CRP), ferritin, fasting insulin, and HbA1c and lower adiponectin levels [27]. In Europe, adult protein intakes at the upper end (90- 97.5th percentile) of the intake distributions have been reported to be between 17 and 27 E% [38].
Excessive protein intake can have a stimulating effect on biochemical pathway called the mammalian target of rapamycin (mTOR), which is also associated with many cancers [28]. In the recent study, respondents aged 50–65 reporting high protein intake had a 75% increase in overall mortality and a 4-fold increase in cancer death risk during the following 18 years. However, these associations were either abolished or attenuated if the proteins were plant derived [29].
Intervention studies provide evidence that high fat (>35 E%), low carbohydrate (<50 E%) diets are associated to adverse short- and long-term effects on body weight, although data are not sufficient to define a Lower Threshold of Intake (LTI) for carbohydrates [2].
Evidence indicates that reducing the amount of total fat intake to less than 30% of total energy intake helps prevent unhealthy weight gain in the adult population [25-27].
In the present study fat intake was 38±6 %E, saturated fatty acids was 16% E. Total fat intakes in adults in European countries ranges from less than 30 E% to 47 E%. In general, mean intakes of fats were lowest in Norway and Portugal and highest in Latvia, Lithuania and Greece [32]. Evidence suggests that diets with <35 E% fat may provide some advantages over diets with >35 E% fat in medium-term weight reduction and long-term prevention of weight gain [32].
According to nutrition therapy recommendation for adults with diabetes 5% energy replacement of saturated fatty acid (SFA) with MUFA improves insulin responsiveness in insulin-resistant and type 2 diabetic subjects [3].
Thus, according to studies, diet composition could have a significant role in the development of some cancers, cardiovascular and kidney diseases in T2DM patients. It is very important to prevent these diseases by changing eating habits.
According to our study results it would be recommended to shift animal protein and fat content to plant sources, which are rich in dietary fiber and micronutrients.
Despite our findings, the current study has several limitations. First, there was a higher percentage of women in the sample studied (68%), compared to the men (32%) and possibility that small sample size (n=50) has lead to the selection bias. Second, for the analysis of food intake a single day 24-h recall method was used. Food intake on a single day, most probably, does not capture the pattern of usual intake [8]. Reporting of energy intake may be influenced by different factors including education level, social desirability, income level, which were not analyzed in our study. However, the main advantages of the face-to-face interview are that it allows for better rapport, the more personal relationship may increase response rate due to the personal contact with the interviewer and there is a potential for more detailed probing of participants’ responses [8]. The food pattern effects of seasonal variations require further investigation, particularly in Latvia and other countries with clearly defined seasonal differences. However, we do think that the interpretation of this study regarding the habits of food intake in summer season in T2DM patients is quite helpful for the nutritionists, physicians and co-medical stuff in real clinical practice.
Conclusions
Our results indicate that compliance to dietary recommendations is not satisfactory in Latvian summer season. Although all T2DM patients reported their daily intakes of vegetables, however, excessive saturated fat and animal protein intake was investigated.
We found statistically significant positive correlation between BMI and intakes of energy (kcal), proteins (g/d), fats (g/d), and saturated fats, as well as negative correlation between BMI and intakes of dietary fiber (g/1000kcal).
References
- National Institute of Diabetes and Digestive and Kidney Diseases (2014) Causes of Diabetes. Bethesda.
- EFSA Panel on Dietetic Products, Nutrition, and Allergies (NDA) (2010) Scientific Opinion on Dietary Reference Values for carbohydrates and dietary fibre. EFSA Journal 8(3):1462.
- Alison B Evert, Jackie L Boucher, Marjorie Cypress, Stephanie A Dunbar, Marion J Franz, et al. (2013) Nutrition Therapy Recommendations for the Management of Adults With Diabetes. Diabetes Care 36(11): 3821-3842.
- Bantle JP, Wylie-Rosett J, Albright AL, Apovian CM, Clark NG, et al. 2008) Nutrition recommendations and interventions for diabetes: a position statement of the American Diabetes Association. Diabetes Care 31(1): S61–S78.
- Mann JI, De Leeuw I, Hermansen K, Karamanos B, Karlstrom B, et al. (2004) On behalf of the Diabetes and Nutrition Study Group (DNSG) of the European Association for Study of Diabetes (EASD) Evidence-based nutritional approaches to the treatment and prevention of diabetes mellitus. Nutr Metab Cardiovasc Dis 14(6): 373–394.
- Cai H, Shu XO, Hebert JR, Jin F, Yang G, et al. (2004) Variation in nutrient intakes among women in Shanghai, China. Eur J ClinNutr; 58(12): 1604–1611.
- Bezerra IN, Goldman J, Rhodes DG, Hoy MK, Souza AM, et al. (2014) Difference in adult food group intake by sex and age groups comparing Brazil and United States nationwide surveys. Nutr J 13: 74–84.
- European Food Safety Authority (2014) Guidance on the EU Menu methodology. EFSA Journal 12(12): 3944.
- Wassan A. Ahmed, Waleed Al-Murrani, Gail A Rees (2012) Underreporting of Energy Intake in Iraqi People Living in the UK According to Body Weight. Food and Nutrition Sciences 3(3): 317-321.
- HA Park, JS Lee, LH Kuller (2007) Underreporting of Dietary Intake by Body Mass Index in Premenopausal Women Participating in the Healthy Women Study. Nutr Res Pract 1(3): 231-236.
- Kye S, Kwon SO, Lee SY, Lee J, Kim BH, et al. (2014) Under-reporting of Energy Intake from 24-hour Dietary Recalls in the Korean National Health and Nutrition Examination Survey. Osong Public Health Res Perspect 5(2): 85–91.
- EFSA Panel on Dietetic Products, Nutrition and Allergies (NDA) (2013) Scientific Opinion on Dietary Reference Values for energy. EFSA Journal 11(1):3005
- Chris Cheyette, YelloBalolia (2013) Carbs &Cals: Count Your Carbs & Calories with Over 1,700 Food & Drink Photos. (5th edn), Chello Publishing.
- Latvijas nacionāla pārtikas sastāva datu bāze
- Nutrition Surveys and Calculations (2007) Guidelines, Software and additional Information.
- Food and Agriculture Organization of the United Nations (2001) Human Energy Requirements: Report of a Joint FAO/WHO/ONU Expert Consultation.Rome, Italy.
- Horgan GW, Stubbs J (2003) Predicting basal metabolic rate in the obese is difficult. Eur J Clin Nutr. 57(2): 335–340.
- Alfonzo-González G, Doucet E, Alméras N, Bouchard C, Tremblay A (2004) Estimation of daily energy needs with the FAO/WHO/UNU 1985 procedures in adults: comparison to whole-body indirect calorimetry measurements. Eur J ClinNutr 58(8): 1125–1131.
- Frankenfield D, Roth-Yousey L, Compher C (2005) Comparison of predictive equations for resting metabolic rate in healthy nonobese and obese adults: a systematic review. J Am Diet Assoc 105(5): 775–789.
- IPAQ (2005) Guidelines for Data Processing and Analysis of the International Physical Activity Questionnaire (IPAQ) - Short and Long Forms.
- Black AE, Cole TJ (2001) Biased over- or under-reporting is characteristic of individuals whether over time or by different assessment methods. J Am Diet Assoc 101(1): 70-80.
- World Health Organization (2003) Diet, nutrition and the prevention of chronic diseases: report of a Joint WHO/FAO Expert. Consultation. WHO Technical Report Series, Geneva. 1-148.
- Inge Tetens (2013) Nutritional Evaluation of Lowering Consumption of Meat and Meat Products in the Nordic Context: A Nordic Ozone Group Project 2011. Nordic Council of Ministers.
- WHO (2009)“Global Database on Body Mass Index: An Interactive Surveillance Tool for Monitoring Nutrition Transition,” Geneva,
- Hooper L, Abdelhamid A, Moore HJ, Douthwaite W, Skeaff CM, et al. (2012) Effect of reducing total fat intake on body weight: systematic review and meta-analysis of randomised controlled trials and cohort studies. BMJ 345: e7666.
- FAO (2010) Fats and fatty acids in human nutrition: report of an expert consultation. FAO Food Nutr Pap 91: 1-166.
- Sylvia H Ley, Qi Sun, Walter C Willet (2014) Associations between red meat intake and biomarkers of inflammation and glucose metabolism in women. Am J ClinNutr 99(2): 352-360.
- Mehvish Showkat, Mushtaq A Beigh, Khurshid I Andrabi (2014) mTORSignaling in Protein Translation Regulation: Implications in Cancer Genesis and Therapeutic Interventions. Molecular Biology International. 2014: 1-14 .
- Levine ME, Suarez JA, Brandhorst S, Balasubramanian P, Cheng CW, et al. (2014) Low Protein Intake Is Associated with a Major Reduction in IGF-1,Cancer, and Overall Mortality in the 65 and Younger but Not Older Population. Cell Metab 19(3): 407–417.
- Goldsmith JR, Sartor RB (2014) The role of diet on intestinal microbiota metabolism: downstream impacts on host immune function and health, and therapeutic implications. J Gastroenterol. 49(5): 785–798.
- Koeth RA, Wang Z , Levison,BS, Buffa,JA, Elin Org, et al. (2013). Intestinal microbiota metabolism of L-carnitine, a nutrient in red meat, promotes atherosclerosis. Nat Med 19(5): 576–585.
- EFSA Panel on Dietetic Products, Nutrition, and Allergies (2010) Scientific Opinion on Dietary Reference Values for fats, including saturated fatty acids, polyunsaturated fatty acids, monounsaturated fatty acids,10 trans fatty acids, and cholesterol. EFSA Journal 8(3): 1461.
- Russell WR, Gratz SW, Duncan SH, Holtrop G, Ince J, et al. (2011) Highprotein, reduced-carbohydrate weight-loss diets promote metabolite profiles likely to be detrimental to colonic health. Am J ClinNutr 93(5): 1062–1072.
- Cani PD, Bibiloni R, Knauf C, Waget A, Neyrinck AM, et al., (2008) Changesin gut microbiota control metabolic endotoxemia-induced inflammation in high-fat diet induced obesity and diabetes in mice. Diabetes 57(6): 1470–1481.
- Serino M, Luche E, Gres S, Baylac A, Bergé M, et al., (2012) Metabolic adaptation to a high-fat diet is associated with a change in the gut microbiota. Gut 61(4): 543–553.
- Pussinen PJ, Havulinna AS, Lehto M, Sundvall J, Salomaa V (2011) Endotoxemia is associated with an increased risk of incident diabetes. Diabetes Care 34(2): 392–397.
- Petersen KS, Clifton PM, Blanch N, Keogh JB (2015) Effect of improving dietary quality on carotid intima media thickness in subjects with type 1 and type 2 diabetes: a 12-mo randomized controlled trial. Am J ClinNutr 102(4): 771-779.
- EFSA JOURNAL (2012) Scientific Opinion on Dietary Reference Values for protein EFSA Panel on Dietetic Products, Nutrition and Allergies (NDA), recommendation for healthy adults 18-59 years old. 10(2): 2557.
- J.Slavin (2013) Fiber and Prebiotics: Mechanisms and Health Benefits. Nutrients 5(4): 1417–1435.
- Tang WH, Wang Z, Kennedy DJ, Wu Y, Buffa JA, et al., (2014) Gut Microbiota- Dependent Trimethylamine N-Oxide (TMAO) Pathway Contributes to Both Development of Renal Insufficiency and Mortality Risk in Chronic Kidney Disease. Circulation Research 116 (3): 448-455.
- Dyson PA, Kelly T, Deakin T, Duncan A, Frost G, et al., (2011) Diabetes UK evidence-based nutrition guidelines for the prevention and management of diabetes. Diabet Med 28(11): 1282-1288.


