Usefulness of Spectral Range Profile in Quantitative Assessment of Voice Quality in Adults and Children
Siupsinskiene N1,2*, Lycke H3
1 Faculty of Health Sciences, Klaipeda University, Klaipeda, Lithuania.
2 Department of Otolaryngology, Academy of Medicine, Lithuanian University of Health Sciences Hospital Kaunas Clinic, Kaunas, Lithuania.
3 Division of Experimental Otolaryngology, Faculty of Medicine, Catholic University Leuven, Belgium.
*Corresponding Author
Nora Siupsinskiene,
Department of Otolaryngology, Academy of Medicine,
Lithuanian University of Health Sciences Hospital Kaunas Clinic,
Kaunas, LT-50009, Lithuania.
Tel: +370 65231668
E-mail: norai_s@yahoo.com
Received: August 19, 2017; Accepted: October 13, 2017; Published: October 18, 2017
Citation: Siupsinskiene N, Lycke H. Usefulness of Spectral Range Profile in Quantitative Assessment of Voice Quality in Adults and Children. Int J Clin Exp Otolaryngol. 2017;3(6):87-95. doi: dx.doi.org/10.19070/2572-732X-1700016
Copyright: Siupsinskiene N©2017. This is an open-access article distributed under the terms of the Creative Commons Attribution License, which permits unrestricted use, distribution and reproduction in any medium, provided the original author and source are credited.
Abstract
Objectives: This study aims to assess the usefulness of spectral range profile (SRP) for quantitative assessment of voice quality in vocally healthy singers and non-singers groups differentiated by age and gender.
Study Design: Prospective study.
Methods: SRP in combination with voice range profile (VRP) using standard singing voice protocols were derived from 57 vocally healthy adults (13 trained choir singers, 44 non-singers) and from 23 vocally healthy prepubescent children (12 choir singers, 11 non-singers). Spectral voice quality parameter - coefficient of sound was calculated as the percent ratio of the sound pressure level (SPL) in the singer’s formant frequency region between 2.6 and 3.7 kHz and the SPL of fundamental frequency for fortissimo singing.
Results: When compared with non-singers, both genders of adult singers demonstrated a significantly greater average values of coefficient of sound (P<0.05), while no statistically significant differences were found for this parameter in the children groups. The logistic regression analysis revealed that coefficient of sound for adults and pitch range for children were selected as the key predictors of well-equipped voice. The limiting score of the coefficient of sound of ≥ 84.5 % distinguishing singers and non-singers according to ROC curve, has the sensitivity of 100% and specificity of 90.9%.
Conclusions: Our study suggests that measurement of spectral range profile may be helpful for quantitative assessment of voice quality in adults, and could be recommended for phoniatricians and speech-language pathologists in their clinical practice.
2.Introduction
3.Materials and Methods
3.1 Subjects
3.2 Methods
3.3 The Spectral Range Profile
3.4 Quantitative Voice Parameters
3.5 Statistical Analysis
4.Results
3.1 Demographic and Clinical Data
3.2 Spectral and VRP voice parameters characteristics of vocally healthy singers and non-singers in adults
3.3 Spectral and VRP voice parameters characteristics of vocally healthy child singers and non-singers aged 5-13 years
5.Discussion
5.1 Analysis of the child singers and non-singers groups aged 5-13 years
6.Conclusion
7.References
Keywords
Spectral Range Profile; Quantitative Voice Assessment; Coefficient of Sound; Voice Quality; Adult Voice; Child Voice.
Introduction
Voice quality is a relevant issue since voice is important for a person’s career, job and psychological comfort. Modern literature indicates the importance of both subjective assessment of voice quality, particularly self-rated by the person, and quantitative voice assessment, including video stroboscopy, acoustic, vocal capability measurements and aerodynamic tests [1]. Clinical importance of the quantitative voice assessment is determined while testing vocal capabilities; quantifying the degree of dysphonia; assessing the outcomes of treatment or the effect of vocal training, adding the objective documentation of these changes [2-4].
An increasing number of researches have concentrated on the differences of voice quality between singers and non-singers. The most popular recent examination of the vocal capabilities has become a voice range profile (VRP), which plots the dynamic range as a function of fundamental frequency and documents the extreme capabilities of voice under the controlled conditions of vowel production [5-9]. The VRP is helpful for an assessment of voice training [4, 8-14]. It has been established that voice training widen vocal capabilities for both adults and children with the profiles of singers demonstrating greater dynamic and frequency ranges, also increased VRP area [8-10, 12-17]. Furthermore, a spectral range profile (SRP) additionally measures the energy of sound in the spectral region between 2 and 4 kHz in the so-called singing formant range at the maximum sound pressure level (SPL) produced by the subject [18, 19]. The importance of the singer’s formant as a voice quality metric, especially in case of solo singers, is under discussion by number of researches [18-23]. It is characterized by an increase in the signal intensity between the third and fourth formants that enhances the richness and ringing of a singer’s voice and allows audiences to hear the singer’s voice with amplification over the sounds of accompanying music [20]. Consequently, a spectral range profile provides additional mportant information with respect to the voice quality and allows the detection of good quality, as well as potentially talented voices [18-23]. Recent studies have shown that singers also have higher energy level in the speaker’s formant region, which is related to the perceptual characteristics of a “better normal voice quality”, when compared to non-singers [24, 25]. Unfortunately, currently only a few detailed analyses of the data from non-solo singers have been published on this issue. Moreover, the vast majority of these studies have analyzed adult voices, omitting an investigation of child voices. Hence, taken the available data into account, the aim of our study was to assess the usefulness of SRP for quantitative assessment of voice quality in vocally healthy non-solo singers and non-singers groups differentiated by age and gender.
We have analyzed the data of 57 vocally healthy adult volunteers and 23 vocally healthy prepubescent children, who were assessed in a voice laboratory of University Hospital. Based on their history, perception and the results of laryngoscopy vocally healthy subjects were confirmed to have no complaints, no history of the otolaryngological problems or voice surgery, and no organic pathology of the vocal folds during phoniatric examination. Individuals with maturational voice established by earlier recommendations were not included in this study [26].
Four groups of subjects were investigated. The adult singers group consisted of 13 choral singers - 4 males and 9 females aged 18-54 years (with an average age of 37.4 ± (standard deviation) 12.3 years) randomly selected from two professional choirs, who received formal voice training in singing not less than 2 hours/ week for 2 years at a higher musical school or conservatory, and presently were receiving voice training as part of their active participation in the professional choir [27]. Singers had an average experience of 7.3 years in voice training. The adult non-singers group consisted of 44 vocally healthy volunteers - 11 males and 33 females aged 18 - 66 years (with an average 38.2 ± 12.4 years) with no voice training history.
The child singers group consisted of 12 children - 2 boys and 10 girls aged 7-13 years (with an average of 10.1 ± 2.0 years) before maturation, who were randomly selected from two professional children choirs and had the history of at least 3 years of training in singing at a school of music. The child non-singers group consisted of 11 vocally healthy prepubescent volunteers-1 boy and 10 girls aged 5-12 years (with an average of 10.3 ± 2.3 years) chosen from the randomly selected children treated at the Ophthalmological Department.
A written informed consent was obtained from all the subjects or both parents of the children. The protocol was approved by Kaunas Region Biomedical Research Ethics Committee.
Voice quality of each subject was measured by both spectral and voice range profiles.
The VRP was registered in an ordinary 5 × 3m room (the noise level did not exceed 40 dBA) under a standard protocol and according to the updated recommendations of the Union of the European Phoniatricians [28]. The pitch range was measured with the help of electronic keyboard (Fujiyama 3A; Fujiyama Tech. Co., Shenzhen, China) in a range of four octaves in half tone steps. A pitch accuracy was determined by two experts. The VRP level of SPL was assessed using a SPL meter (TYP 00019, VEB Robotron, Messelektronik Dresden, Germany), a slow meter damping and an A-weighted frequency curve (dBA) with a condenser omni-direction microphone MK 102 (Messelektronik Dresden, Germany) at a constant distance of 30 cm from the mouth. The subjects have sustained vowel/a/in the standing position after a comfortable inhalation as softly and as loudly as possible for a minimum of 2 seconds and within the entire subjects’ frequency range; therefore, intensities are recorded for each of 12 semitones per octave, thus producing a lower and an upper contour of VRP [1, 2, 8]. Only precise target tone sounds sustained for at least 2 seconds with two or more values within 2 dBA after the repeated test conditions of the target tone were registered on an original registration form [8]. All the subjects were instructed to demonstrate their exceptional capabilities regardless of the produced vocal quality and were guided by the same experienced phoniatrician (S.N) to reduce the influence of the recording variation on VRP characteristics [29]. To motivate the subjects to demonstrate their extremes, the investigator provided verbal support.
The spectral range profile was registered under the same conditions as the VRP. Simultaneously with the SPL measurement of the VRP loudest phonation, the SPL in the frequency region of the singer’s formant was assessed using a 2.7 - 3.6 kHz band pass filter (Echtzeit analysator 01018, Messelektronik Dresden, Germany, roll off 18 dB/octave), hence forth called singing formant level (SFL) (Figure 1) [18, 19]. For this purpose an additional SPL meter (TYP 00026, VEB Robotron, Messelektronik Dresden, Germany) with a condenser Omni-direction microphone MK 221 (Messelektronik Dresden, Germany) was used. According to the European marking system, the SFL was measured from /A/ to /a<1
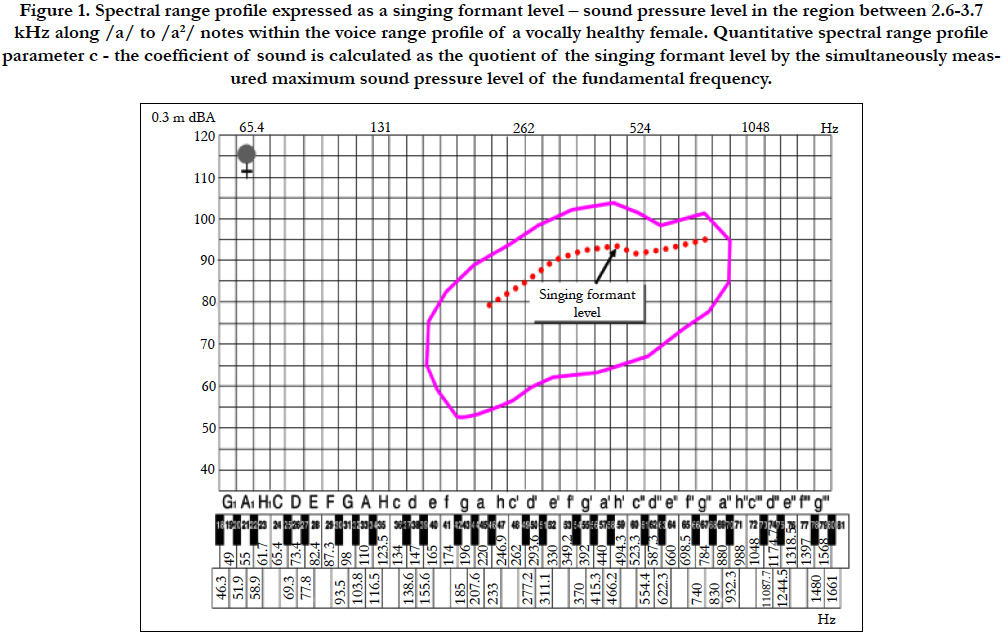
Figure 1. Spectral range profile expressed as a singing formant level – sound pressure level in the region between 2.6-3.7 kHz along /a/ to /a2/ notes within the voice range profile of a vocally healthy female. Quantitative spectral range profile parameter c - the coefficient of sound is calculated as the quotient of the singing formant level by the simultaneously measured maximum sound pressure level of the fundamental frequency.
The standard calibration procedure of both SPL meters was performed using a calibrator PF 101 TYP 00003 (VEB Robotron, Messelektronik Dresden, Germany) with 117.8 dB control SPL before each VRP and SRP registration.
To assess the test-retest reliability of the voice measurements, during two additional sessions - on the next day and in one month after the first examination - three successive analyses of four consecutive singers were performed. Three repeated analyses did not show any significant difference between three occasions (P > 0.05; paired t test for repeated measurements was used). Intraindividual variations of intensity parameters for the repeated assessments were within 2 dBA, and for frequency parameters - within 2 semitones with no statistically significant difference on the averages (P > 0.05). The identical voice measurements across test occasions were not expected as variations within individual voices would always seem to occur [11, 14, 30].
A quantitative SRP parameter - a coefficient of sound (CS) was introduced by Bütner et al., [19] and relatively discloses the SPL of acoustic energy in the singer’s formant region (2.7 - 3.6 kHz) to the maximum SPL of the fundamental frequency. The CS was calculated as the quotient of the singing formant level (SFL) and the maximum voice intensity level (max.VI) according to the proposed formula: CS= SFL/max. VI ×100%. CS was measured in percent.
We also included eight VRP parameters - three frequencyrelated: the highest and the lowest frequency (i.e., the highest and the lowest tones sung in Hz), and the pitch range (i.e., the distance from the lowest to the highest singing tone, measured in semitones (st.)); three intensity-related: maximum and minimum intensity (i.e., the greatest and the softest voice intensity registered by the meter measured in dBA), and the intensity range (i.e., the distance between the softest and the loudest SPL registered by the meter measured in dBA); and two combined: a total area, the surface area between the minimum and maximum intensity contour, measured in st. × dBA and an area in high frequencies, part of the total area calculated from 349.2 Hz for male and 523.3 Hz for female (an average place of the register change, st. × dBA) [8].
Statistical analysis was performed using SPSS 17 for Windows (SPSS Corporation, Chicago, IL, USA). The Kolmogorov- Smirnov test was applied to test the normality of the quantitative data distribution; whereas, χ2 test was used to compare proportions (age, gender, smokers). The effect of gender on quantitative voice parameters was investigated with the help of ANOVA model. Test-retest reliability was investigated using paired t-test for repeated measures. The unpaired t-test (2-tailed) was used to compare the differences between groups. Averages, difference of an average and 95% confidence intervals of difference were used for a description. The process used to compute the VRP averaging method was the following: first, an average of the lowest pitch and an average of the highest pitch within each group were used to define an average pitch range of each group. Second, the compression or expansion process of each individual VRP was applied to meet the same average pitch range. Then, the intensity points were interpolated over a detailed semitone scale, and average upper and lower contours per semitone value were calculated. The average VRPs were used only for visual representations of the study data. An average CS was calculated by averaging the SPL values of the SFL and max. VI of all the assessed musical notes (from /A/ to /a1/ for males and from /a/ to /a2/ for females and children). A binary logistic regression was applied for the selection of the most informative discriminating parameters. With the help of classification tables sensitivity (the proportion of singers correctly identified by the test), specificity (the proportion of non-singers correctly identified by the test) and overall discrimination accuracy were calculated. Using coordinate points of receiver operating characteristic curve (ROC), limiting scores with the maximum sensitivity and specificity of the selected most informative parameters (that showed a significant average difference between the singers and non-singers groups and overall discrimination accuracy not less than 90%) were determined. Alpha level of significance of 0.05 was used.
Adult singers and non-singers were close by their age and gender proportions (P>0.05). The majority of adults were not active smokers: 92.3% in the singers group and 81.8% in the non-singers group (P>0.05). ANOVA analysis has revealed that gender has a significant effect on three tested quantitative voice parameters: the lowest and highest frequencies and the total VRP area. Based on the established findings, the data of adults were separated by gender.
Almost all of the evaluated children, with the exception of just one, were under 13 years of age. None of the children were smokers. While ANOVA analysis disclosed no significant gender difference on quantitative voice parameters in children under 13 years of age, the data were not separated by gender.
Average values of the coefficient of sound derived from the spectral range profile showed significant differences between the singers and non-singers groups both for male and female subjects (Figure 2). In the singers group, averages of the CS were significantly higher when compared to the non-singers group: 92.0 ± 1.0% versus 76.6 ± 10.6% for males (P=0.01) and 90.9 ± 4.7% versus 77.7 ± 4.9% for females (P<0.0001), respectively. There were no significant differences between the data from male and female subjects (P>0.05). The averaged VRPs and SRPs of males and females with trained voice are illustrated in Figure 3.
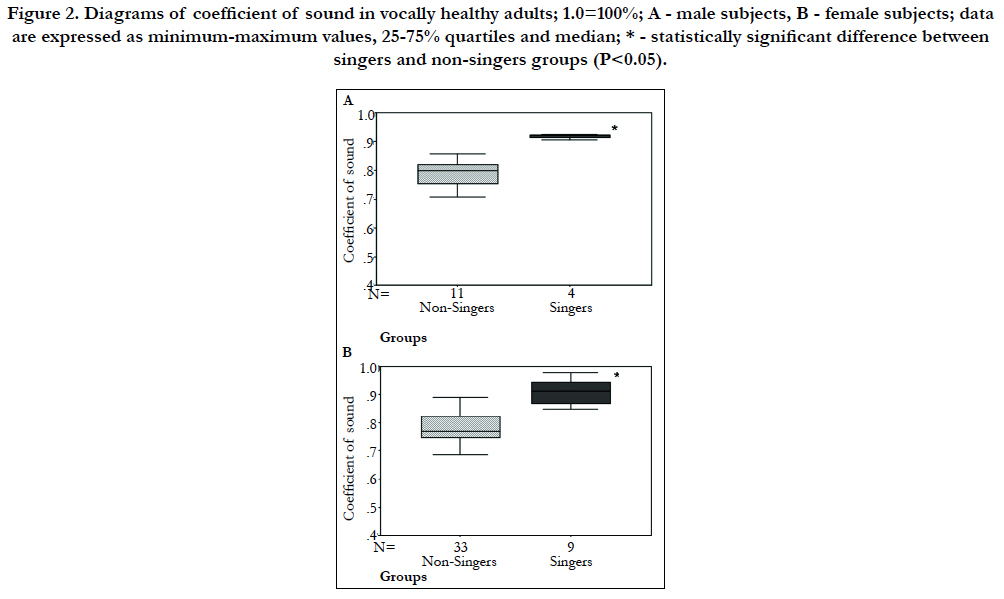
Figure 2. Diagrams of coefficient of sound in vocally healthy adults; 1.0=100%; A - male subjects, B - female subjects; data are expressed as minimum-maximum values, 25-75% quartiles and median; * - statistically significant difference between singers and non-singers groups (P<0.05).
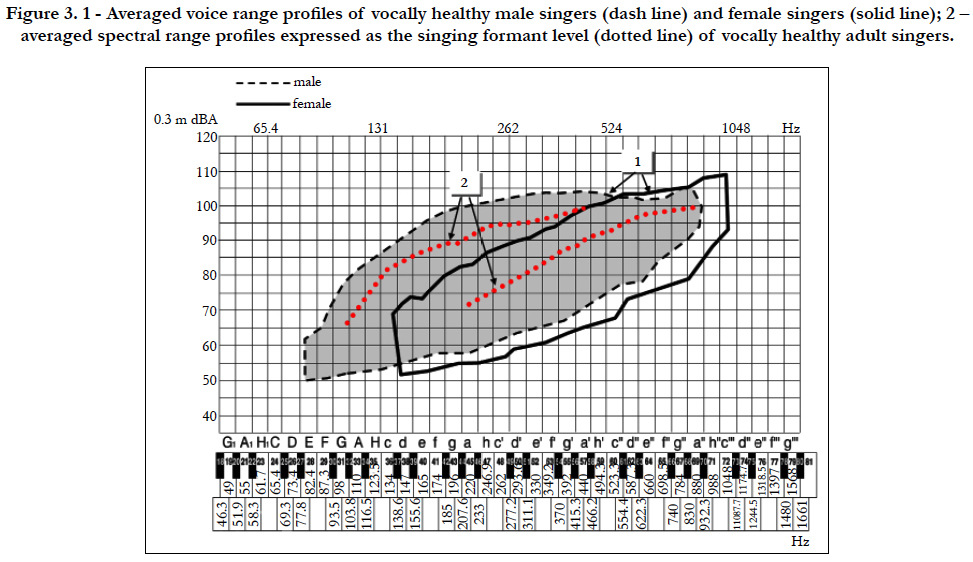
Figure 3. 1 - Averaged voice range profiles of vocally healthy male singers (dash line) and female singers (solid line); 2 – averaged spectral range profiles expressed as the singing formant level (dotted line) of vocally healthy adult singers.
Regarding the data of the VRP, both gender singers demonstrated an increased ability to produce significantly greater pitch range (an average of 10.7st. for males and of 4.8st. for females), highest frequency (an average of 362.3 Hz for males and of 274 Hz for females), total area (an average of 515.4 st. × dBA for males and of 153.6 st. × dBA for females), and area in high frequencies (an average of 375.2 st. × dBA for males and of 218.4 st. × dBA for females) in comparison to the control non-singers group (P<0.05). There were no significant differences in the VRP intensity related parameters between male groups as opposed to female groups, where the singers, again, demonstrated significantly greater maximum voice intensity (an average of 13.9 dBA) and intensity range (an average of 10.6 dBA) when compared to the nonsingers (P<0.001).
A logistic regression analysis was used for the establishment of the sensitivity and specificity of each individual measured quantitative voice parameter. The gender was included in the model as a covariate. When comparing the data of singers and non-singers groups, the spectral voice quality parameter - coefficient of sound showed high sensitivity of 84.6% and specificity of 97.7%. While the sensitivity of the VRP parameters ranged between 0.0% (the lowest frequency) and 92.3% (the maximum voice intensity). Specificity of the VRP parameters was higher and ranged between 88.6% and 100% (Figure 4). Spectral parameter CS was selected as the most informative for the prediction of singers voice (an overall prediction accuracy of 94.9%, cut value of probability=0.5).
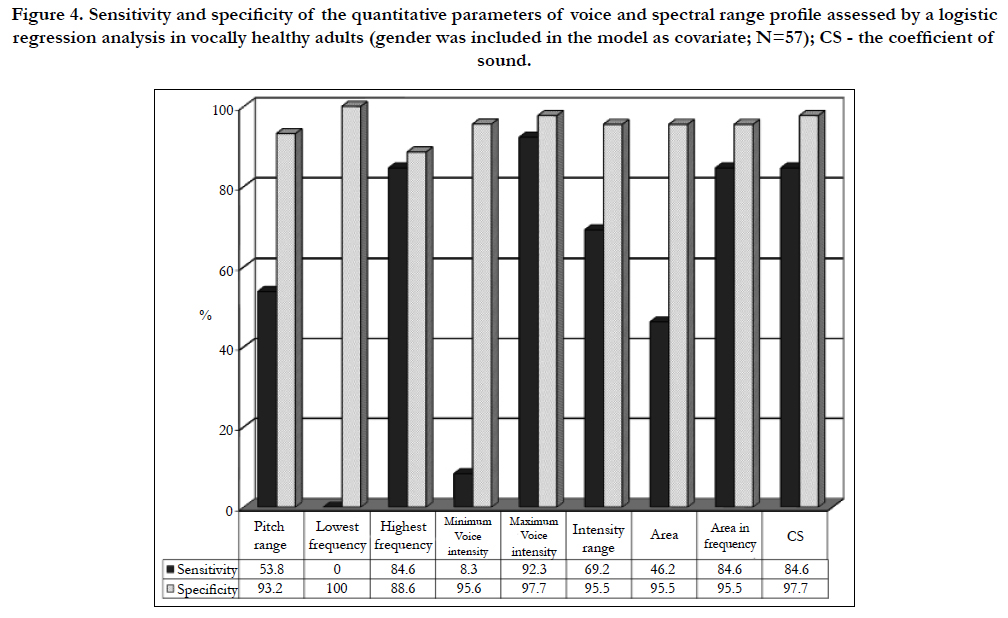
Figure 4. Sensitivity and specificity of the quantitative parameters of voice and spectral range profile assessed by a logistic regression analysis in vocally healthy adults (gender was included in the model as covariate; N=57); CS - the coefficient of sound.
The ROC analysis revealed that the CS score of ≥ 84.5% was the optimal score (limiting value) distinguishing singers and nonsingers. Out of 13 adult choir singers, the CS correctly identified all the individuals (sensitivity of 100%), while 40 of 44 subjects with untrained voice were correctly classified as non-singers (specificity of 90.9%).
Figure 5 demonstrates the data of spectral voice parameter - CS. Average values of CS were similar for both tested groups: 78.9 ± 8.8% for the child singers and 75.4 ± 3.5% for non-singers (P>0.05). The averaged SRP and VRP of singing children are illustrated in Figure 6.
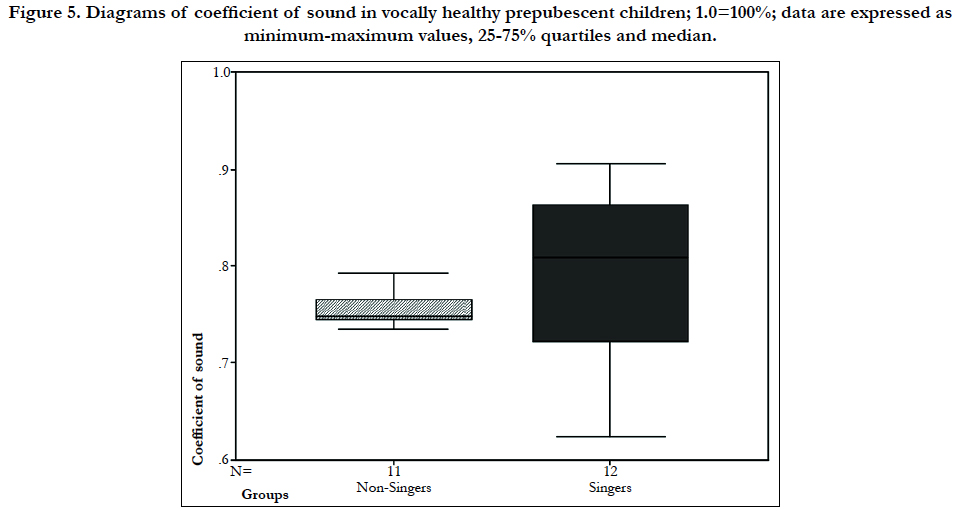
Figure 5. Diagrams of coefficient of sound in vocally healthy prepubescent children; 1.0=100%; data are expressed as minimum-maximum values, 25-75% quartiles and median.
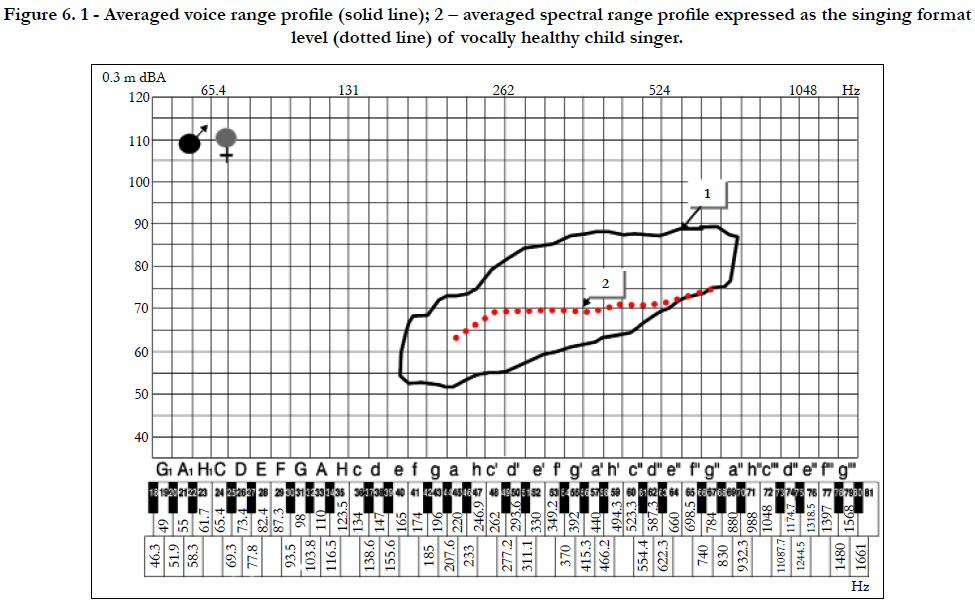
Figure 6. 1 - Averaged voice range profile (solid line); 2 – averaged spectral range profile expressed as the singing format level (dotted line) of vocally healthy child singer.
Data of VRP analysis showed that prepubescent children have demonstrated less significant differences between average values of VRP parameters than adults. Significantly greater difference between singing and not singing children was found only for the frequency related VRP parameters: pitch range and the highest frequency were significantly greater (an average of 6.8 st. and 165 Hz), while the lowest frequency was significantly lower (an average of 40 Hz) in singing children in comparison to children who are not singing (P<0.05). The intensity related and combined VRP parameters have revealed the same trend; the difference, however, has not reached statistical significance.
Sensitivity and specificity of each tested voice parameter obtained with the help of a logistic regression analysis are presented in Figure 7. The sensitivity and specificity of the coefficient of sound in both singing and not singing prepubescent children was not high; it was equal to 66.7% and 63.6%, respectively. While the sensitivity of the VRP parameters ranged between 66.7% and 91.7%; specificity - between 18.2% and 90.9%. The VRP pitch range was selected as the most informative parameter for the separation of the voice quality among the singing and not singing children groups (an overall prediction accuracy was 91.3%; a cut value of probability = 0.5).
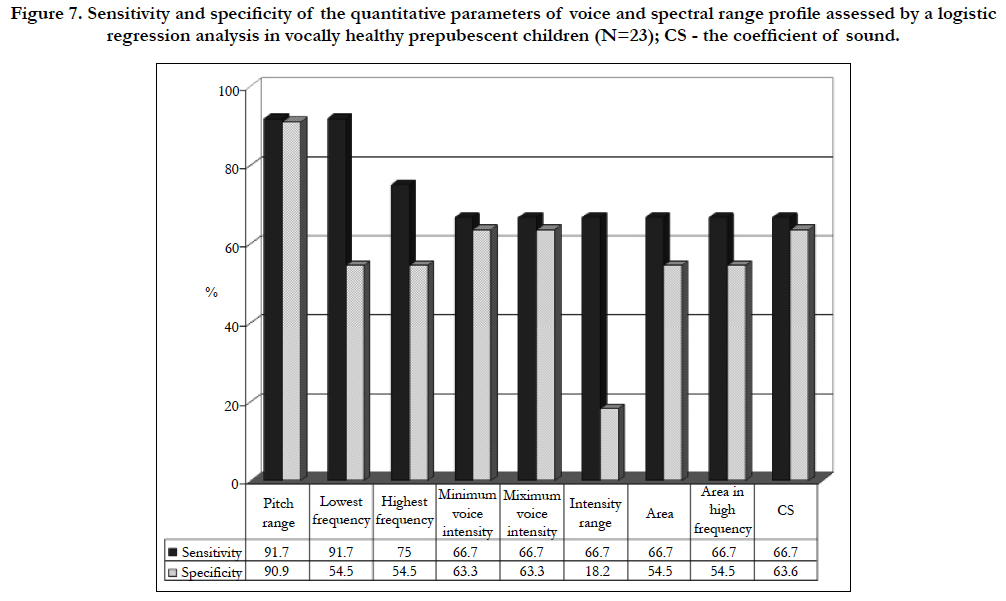
Figure 7. Sensitivity and specificity of the quantitative parameters of voice and spectral range profile assessed by a logistic regression analysis in vocally healthy prepubescent children (N=23); CS - the coefficient of sound.
Discussion
The aim of this study was to assess the usefulness of spectral range profile for quantitative assessment of voice quality in vocally healthy non-solo singers and non-singers groups differentiated by age and gender.
A quantitative description of the voice quality is important for patients, otorhinolaryngologists and speech language pathologists. Several research works have shown that voice training has a quantifiable effect on voice capabilities, mostly on VRP parameters [4, 8-19]. Measurements derived from the VRP are useful in identifying voices which are well-equipped; in the diagnosis of vocal dysfunction; in suggesting starting points for voice training and in controlling training effectiveness or outcomes of the treatment. Some authors have emphasized an importance of energy measurement in the singers’ formant region for an assessment of voice training effects, especially in case of solo singers [18-20, 31]. However, the following main question remains: which of the methods and voice parameters are the most sensitive to voice training and could better quantitatively describe voice quality, as well as assess voice training effect. According to the literature, to achieve this purpose VRP along with SRP are proposed as relevant methods [4-6, 10-19]. Findings of the present study support this opinion.
Analysis of the singers and non-singers groups in adults has shown that both gender singers demonstrate increased power in the singer’s formant range (2.6 - 3.7 kHz) that reflected by the higher average values of spectral parameter - coefficient of sound in comparison to non-singers along with the increased vocal capabilities measured by the VRP. In comparison to non-singers both gender singers demonstrated a significantly increased average VRP pitch range, higher highest frequency and an increase in both areas: a total and an area in high frequencies (P<0.05). Logistic regression analysis revealed that the coefficient of sound was one of the most important factors for the discrimination between singers and non-singers in adults: its sensitivity reached 84.6% and specificity - 97.7%. This quantitative voice parameter was selected as a key parameter for the prediction of well-equipped voice (an overall prediction accuracy - 94.9%).
A quantitative measure of the sound energy in the high formant region provides additional information on the voice quality. As the previous research has shown, calculation of the quotient of the SPL in the singer’s formant region by the total SPL, provides an important information about the grade of singing technique and allows the determination of vocal sound characteristics and changes of the sound [18, 19]. It was noticed that the process of voice education allows an increase in the CS and a decrease in its variation with pitch [19, 22]. Our study data have confirmed the importance of spectral range profile on the assessment of the capabilities of singing voice. Average values of quantitative CS obtained by this study are in agreement with a small number of other research works on the CS proportions [18, 19, 22]. The majority of comprehensive results based on 376 measurements have been reported by Bütner et al., [19]: average values of the CS for voice professionals of both genders - solo singers, as well as students of solo singer programs, were higher than those of nonprofessionals; 92.0% - 92.3% versus 78.0% - 79.0% for males; and 85.0% - 87.0% versus 65.0% - 75%, for females, respectively. Currently, using the advanced statistics acquired with the help of ROC curve analysis, we found the limiting value of the CS which can be useful in the classification of voice. The data of the present study have shown that the CS score, which is equal to or higher than 84.5%, could be useful in the exceptionally accurate detection of well-equipped voice quality (sensitivity of the limiting CS value - 100%, specificity - 90.9%). This fact could be helpful in the practice of phoniatric specialists and speechlanguage pathologists since in order to measure the CS a small portable devise with display of the CS in real time can be used [18, 19]. It is interesting though that the data of the present study assessing the voices of choir singers support the evidences that the SPL in the singer’s formant region could be increased not only for classically trained singers. In that case the power in singer’s formant region could be less than for solo singers, but sufficient enough to show good voice quality. Consequently, the recent study by Watts et al., [21] on the objective assessment of the singing power ratio in untrained talented and non-talented singers concluded that vocal tract resonance and its effect on the perceived vocal timbre or quality may be an important objective variable related to the perception of singing talent. Moreover, aaccording to the research performed by Seidner et al., [18], the coefficient of sound can be applied not only for healthy but also for sick voices, e.g. in tracing the therapeutic course.
In contrast to the data of adults, average values of a quantitative SRP parameter - coefficient of sound have not shown significant difference between child singers and non-singers. Significant differences have been found only in respect to the average values of the VRP frequency-related parameters: increased pitch range, extended lowest and highest frequencies for singing children, in comparison to not singing. Such results could be determined by a relatively small size of the sample and an incomplete development of the vocal tract in children before maturation. However, there is yet another reason for this - in the present study we have assessed a fixed centre frequency of 2.7-3.6 kHz. For the determination of the singer’s formant. However, recently Howard et al., [32] have investigated a “ring” in the solo child’s singing voice and have found that the formant cluster at around 4 kHz is the children’s equivalent of the singer’s formant cluster; thus, in case of children the frequency of the singer’s formant is higher than in case of adults, most likely due to the smaller dimensions of the epilaryngeal tube that plays a central role in the formation of the singer’s formant [20]. It is possible that the fixed band pass filter that was used in our study failed to match the centre frequency of the singer’s formant in our group of children.
Some recent studies on children confirmed the VRP dependence on voice/musical background [33, 34], but we have not found any data in literature on an analysis of the coefficient of sound in children.
The present study has some limitations. The major limitation is that we have analysed a relatively small sample of the investigated groups, especially singers, which in its turn could have reduced the power of statistical tests. Another limitation is that native “talent” of each tested voice was not considered in this study, thus the exact portion, which could be credited to training is unknown. But such issue is out of the aims of this study. Therefore, for the clarification of the results further studies are necessary. Future investigations with larger sample size, controlled voice training during the study and the inclusion of pathological voice as well could be beneficial.
We can summarize that spectral range profile and its simply calculated quantitative SRP parameter - coefficient of sound is providing valuable information on the resonant voice quality and is useful for showing good voice quality that could be measured quantitatively.
Conclusions
Spectral range profile is a useful instrument for a quantitative assessment of the voice quality, especially in adults. The coefficient of sound measured by spectral range profile, which reflects energy level in the singer’s formant (2.6-3.7 kHz) range had significantly higher average values for singers in comparison to non-singers. This parameter for adults and pitch range for children were selected as the key predictors of well-equipped voice.
The spectral range profile measurement along with the selected limiting value of the coefficient of sound can be helpful in the assessing voice quality for phoniatricians and speech-language pathologists in their everyday practice, especially in individual cases.
References
- Dejonckere PH. Assessment of voice and respiratory function. In: Remacle M, Eckel HE, editors. Surgery of larynx and trachea. Berlin: Springer-Verlag; 2010. 11-26.
- Dejonckere PH, Bradley P, Clemente P, Cornut G, Committee on Phoniatrics of the European Laryngological Society (ELS). A basic protocol for functional assessment of voice pathology, especially for investigating the efficacy of (phonosurgical) treatments and evaluating new assessment techniques. Eur Arch Otorhinolaryngol. 2001 Feb;2589(2):77-82. PubMed PMID: 11307610.
- Dejonckere PH, van Wijck I, Speyer R. Efficacy of voice therapy assessed with the voice range profile (Phonetogram). Rev Laryngol Otol Rhinol (Bord). 2003;124(5):285-289. PubMed PMID: 151440223.
- Lycke H, Siupsinskiene N. Voice Range Profiles of Singing Students: The Effects of Training Duration and Institution. Folia Phoniatr Logop. 2016;68(2):53-59.
- Lycke H, Decoster W, Ivanova A, Van Hulle MM, de Jong FI. Discrimination of three basic female voice types in female singing students by voice range profile-derived parameters. Folia Phoniatr Logop. 2012;64(2):80-86. PubMed PMID: 22507900.
- Lycke H, Ivanova A, Van Hulle MM, Decoster W, de Jong FI. Discrimination of three basic male voice types by voice range profile-derived parameters. Folia Phoniatr Logop. 2013 65(1):20-24. PubMed PMID: 23711640.
- Pabon P, Ternström S, Lamarche A. Fourier descriptor analysis and unification of voice range profile contours: method and applications. J Speech Lang Hear Res. 2011 Jun;54(3):755-776. PubMed PMID: 20966385.
- Siupsinskiene N. Quantitative analysis of professionally trained versus untrained voices. Medicina (Kaunas). 2003;39(1):36-46. PubMed PMID: 12576764.
- Hunter EJ, Švec JG, Titze IR. Comparison of the produced and perceived voice range profiles in untrained and trained classical singers. J Voice. 20(4):513– 526. PubMed PMID: 16325373.
- Lamarche A, Ternstrӧm, Pabon P. The singer’s voice range profile: female professional opera soloists. J Voice. 2010 Jul;24(4):410-26. PubMed PMID: 19837561.
- Pabon P, Stallinga R, Södersten M, Ternström S. Effects on vocal range and voice quality of singing voice training: the classically trained female voice. J Voice. 2014 Jan;28(1):36-51. PubMed PMID: 24084360.
- LeBorgne WD, Weinrich BD. Phonetogram changes for trained singers over a nine-month period of vocal training. J Voice. 2002 Mar;16(1):37-43.
- Mendes AP, Rothman HB, Sapienza C, Brown WS Jr. Effects of vocal training on the acoustic parameters of the singing voice. J Voice. 2003 Dec;17(4):529-543. PubMed PMID: 14740934.
- Siupsinskiene N, Lycke H. Effects of voice training on singing and speaking voice characteristics in adults and children based on choral and non choral data. J Voice. 2011 Jul; 25(4):e177-89. PubMed PMID: 20702062.
- Brown WS, Howard BR, Sapienza CM. Perceptual and acoustic study of professionally trained versus untrained voices. J Voice. 2000 sep;14(3):301- 309. 11021498. PubMed PMID: 11021498.
- Awan SN. Superimposition of speaking voice characteristics and phonetograms in untrained and trained vocal groups. J Voice. 1993 Mar;7(1):30- 37. PubMed PMID: 8353617.
- Åkerlund L, Gramming P. Average loudness level, mean fundamental frequency, and subglottal pressure: comparison: comparison between female singers and nonsingers. J Voice. 1994 Sep;8(3):263-270. PubMed PMID: 7987429.
- Seidner W, Schutte HK, Nawka T, Eichhorst P. Practical significance of measuring high formant spectra in phoniatric voice assessment. Laryngorhinootologie. 1995 May;74:254-258.
- Bütner M, Seidner P, Eichhorst P, Klangkoeffizient Der. ein beachtenswerter Parameter bei der Messung von Singstimmprofilen. Sprache Stimme Gehör. 1991;15(4):135-138.
- Sundberg J. Level and center frequency of the singer’s formant. J Voice. 2001 Jun;15(2):176-186. PubMed PMID: 11411472.
- Watts C, Barnes-Burroughs K, Estis J, Blanton D, Watts C. et al. The singing power ratio as an objective measure of singing voice quality in untrained talented and nontalented singers. J Voice. 2006; Mar;20(1):82-88. PubMed PMID: 15922560.
- Mürbe D, Sundberg J, Iwarsson J, Pabst F, Hofmann G. Longitudinal study of solo singer education effects on maximum SPL and level in the singers formant range. Log Phon Vocol. 1999;24(4):178-186.
- Barrichelo VMO, Heuer RJ, Dean CM. Comparison of singer’s formant, speaking ring, and LTA spectrum among classical singers and untrained normal speakers. J Voice. 2001 Sep;15(3):344-350. PubMed PMID: 11575631.
- Bele IV. The speakers’s formant. J Voice. 2006 Dec;20(4):555-578.
- Lee SH, Kwon HJ, Choi HJ, Lee NH, Lee SJ, Jin SM. The Singer’s Formant and Speaker’s Ring Resonance: A Long-Term Average Spectrum Analysis. Clin Exp Otorhinolaryngol. 2008 Jun;1(2):92-96. PubMed Central PMCID: PMC2671792.
- Pedersen M. A longitudinal pilot study on phonetograms/voice profiles in pre-pubertal choirboys. Clin Otolaryngol Allied Sci. 1993 Dec;18(6):488- 491. PubMed PMID: 8877226.
- Neuschaefer-Rube Ch, Šram F, Klajman S. Three-dimensional phonetographic assessment of voice performance in professional and non-professional speakers. Folia Phoniatr Logop. 1997;49(2):96-104. PubMed PMID: 9197092.
- Pedersen MF, Frokjaer-Jensen B, Pabst F, Shutte HK, Hacki T, Hansen HL. Standardizing voice range profile measurements (Phonetography/ Stimmfeldmessung). In: Kotby N, editor. Proceedings of the 23rd World Congress IALP;Cairo; 1995. 41-45.
- Hallin AE, Fröst K, Holmberg EB, Södersten M. Voice and speech range profiles and Voice Handicap Index for males-methodological issues and data. Logoped Phoniatr Vocol. 2012 Jul;37(2):47-61. PubMed PMID: 21888604.
- Coleman RF. Sources of variation in phonetograms. J Voice. 1993 Mar;7(1):1-14. PubMed PMID: 8353615.
- Doskov D, Ivanov T, Boyanov B. Comparative analysis of singer’s high formant in different type of singing voices. Folia Phoniatr Logop. 1995;47(5):291-295. PubMed PMID: 8563781.
- Howard DM. Acoustics of the trained versus untrained singing voice. Curr opin Otolaryngol Head Neck Surg. 2009 Jun;17(3):155-159. PubMed PMID: 19365264.
- Fuchs M, Meuret S, Thiel S, Täschner R, Dietz A, Gelbrich G. Influence of singing activity, age, and sex on voice performance parameters, on subjects' perception and use of their voice in childhood and adolescence. J Voice. 2009 Mar;23(2):182-189. PubMed PMID: 18060740.
- Schneider B, Zumtobel M, Prettenhofer W, Aichstill B, Jocher W. Normative voice range profile in vocally trained and untrained children aged between 7 and 10 years. J Voice. 2010 Mar;24(2):153-60. PubMed PMID: 19303739.


