Allometric and Phylogenic Comparisons of Circulating Leukocyte Concentrations between and within Birds and Mammals
Scanes CG
Department of Biological Science, University of Wisconsin Milwaukee, Milwaukee, USA.
*Corresponding Author
Colin G. Scanes
Department of Biological Science, University of Wisconsin Milwaukee, 3209 N. Maryland Avenue, Milwaukee, WI 53211, WI53211, USA.
Tele : 1-414-229-3641
E-mail: scanes@uwm.edu
Received: April 05, 2016; Accepted: May 18, 2016; Published: May 23, 2016
Citation: Scanes CG (2016) Allometric and Phylogenic Comparisons of Circulating Leukocyte Concentrations between and within Birds and Mammals. Int J Vet Health Sci Res. 4(4), 116-122.DOI : dx.doi.org/10.19070/2332-2748-1600025
Copyright: Scanes CG © 2016. This is an open-access article distributed under the terms of the Creative Commons Attribution License, which permits unrestricted use, distribution
and reproduction in any medium, provided the original author and source are credited.
Abstract
The blood concentrations of leukocytes and the major classes of leukocytes were compared across over 200 species of
birds and over 300 species of mammals based on phylogenic relations, body weight and diet. The concentration of leukocytes was markedly higher in birds than mammals reflecting elevated concentrations of all major classes but particularly those of lymphocytes, monocytes, eosinophils and basophils. Overall, there were no differences between blood leukocyte concentrations in placental and marsupial mammals. There were differences between leukocytes concentrations within the placental mammals, for instance being lower in mammalian species within the taxa Glires than in Laurasiatheria and Primatomorpha which in turn are lower than in Afrotheria and Xenarthra. There were also differences in leukocyte concentrations in birds being higher in species with the taxa Afroaves than in Australaves. There were phylogenic differences in the percentages of the leukocyte classes. For instance, in placental compared marsupial mammals, the percentage neutrophils is elevated, the percentage lymphocytes is depressed and neutrophil to lymphocyte (N:L) ratio was much higher. Moreover, the percentage heterophils is high, the percentage lymphocytes is low and heterophil to lymphocyte (H:L) ratio is greater in birds from the taxa Paleognathae than the Neognathae. There was a positive relationship between concentrations of leukocytes or neutrophils and log body weight.
2.Materials and Methods
2.1.Databases
2.2.Analyses
2.3.Statistics
3.Results
4.Discussion
5.References
Introduction
The present study examines the relationship between blood leukocyte concentrations together with differential leukocyte counts and the ratio of neutrophils (mammals) or heterophils (birds) to lymphocytes (N/H:L ratio) relative to the following: phylogenic/evolutionary relationships, log body weight and ecological parameters (diet, habitat) in birds and mammals. It is well recognized that there are pathological shifts in these leukocyte parameters. For instance, the N:L ratio is reported to be a useful clinical parameter in human medicine being “a useful marker to predict subsequent mortality in patients admitted” for ST segment elevation myocardial infarction” [1], together with after percutaneous coronary intervention [2] and following hepatic resection for colorectal liver metastases [3]. Moreover, there are also marked physiological shifts in leukocyte concentrations.
There is, for instance, a linkage between stress and immune functioning in mammals; this having been advanced since the 1940s (reviewed [4]). In birds, the relationship was first noted in poultry. Corticosterone administration was accompanied by increases in the blood concentrations of heterophils (over 3 fold), decreases in the lymphocyte concentration (85 % decrease) and large changes in the H:L ratio (>20 fold) in chickens [5] with the relationship (R2) between the dosage of corticosterone and heterophils, lymphocytes and H:L ratio being 0.41, 0.66 and 0.88 respectively (calculated from 5). The percentages of both heterophils and lymphocytes are similarly changed by stressors and the glucocorticoid dexamethasone in young turkeys [6]. “For the ecologist, therefore, high ratios of heterophils or neutrophils to lymphocytes (‘H : L’ or ‘N : L’ ratios) in blood samples reliably indicate high glucocorticoid levels” and hence stress [7]. This is supported, for instance, by the marked increases in the percentage represented by heterophil and decreases in lymphocyte percentages in blood parasite infected warblers [8]. Moreover, there are shifts in leukocytes populations one to two hours following capture in great tits; there being large increases in heterophils and concomitant decreases in both lymphocytes and eosinophils [9]. Moreover, there is an increase in H:L ratio in response to endotoxin and flight in pigeons [10] and with transportation stress in domesticated (e.g. goats – [11]; horses – [12]) and wild mammals (e.g. badgers – [13]). A strong relationship between stress and blood N: L ratios has been reported in chronically but not acutely stressed rats [14]; the latter but not the former having elevated circulating concentrations of corticosterone.
As leukocyte numbers shift to meet physiological challenges, it is hypothesized that there are selective/evolutionary pressures for optimal basal values in different species. The phylogenetic, allometric or ecological relationships for leukocytes in mammals and birds are examined in the present study.
Materials and Methods
A series of databases were assembled for blood concentrations of leukocytes using the published or calculated mean for the species based on rigorous and systematic series of searches of the literature. The databases for blood concentrations of leukocytes are available for the following: mammals (Supplementary table A and B) and birds [15]. Information on body weights was for birds from [16] and for mammals from [17].
Data were analyzed by taxonomic groups based on the following for birds [18-21] and for mammals [22,23]. However, for the latter, it should be noted that recent studies support the grouping Laurasiathera but do not support the Euarchontoglires encompassing the Glires (rodents/lagomorphs) and Euarchonta (including primates and tree shrews)[24]. Moreover, while the Cetacea (marine mammals such a whales and dolphins) are generally viewed as a branch of the Artiodactylans [21,25], the Artiodactyla and Cetacea will be considered separately in the present study due to ecological, size and other differences.
Data were analyzed by taxa using one-way analysis of variance, with mean separated by Tukey’s range test or for comparisons between two taxa by Student’s t test. The relationship between data on leukocytes and log body weights were compared by linear regression.
Results
Table 1 summarizes differences between leukocytes in birds and mammals. The circulating concentrations of leukocytes were 72.3 % higher (p<0.01) in birds than mammals with greater (p<0.01) numbers of neutrophils (44.5 %), lymphocytes (57.5 %), monocytes (50.7 %), eosinophils (132.8 %) and basophils (392.9 %). The increases in neutrophils and lymphocytes between mammals and birds was very similar; the Δ neutrophils being 1820 per µL blood and Δ lymphocytes being 1868 per µL blood. In contrast, there were no differences in the percentage of either lymphocytes or monocytes between mammalian and avian species. There were some difference in the percentages of neutrophils/ heterophils, eosinophils and basophils but these were of a smaller magnitude than for absolute concentrations. The percentage of neutrophils was lower (p<0.01) in birds than mammals while the percentages of both eosinophils and basophils were greater (p<0.01). Parenthetically, the coefficients of variation (CV) were markedly lower when the differential leukocyte count was expressed as a percentage rather than as a concentration. For instance, the CV for neutrophil across mammalian species and heterophils across avian species were respectively 38.7% and 37.7% for percentages and 71.1% and 72.5% of absolute concentrations. The neutrophil/heterophil to lymphocyte ratio (H/N:L) was similar comparing mammals and birds but 21.9% higher (p<0.01) in mammals than birds.
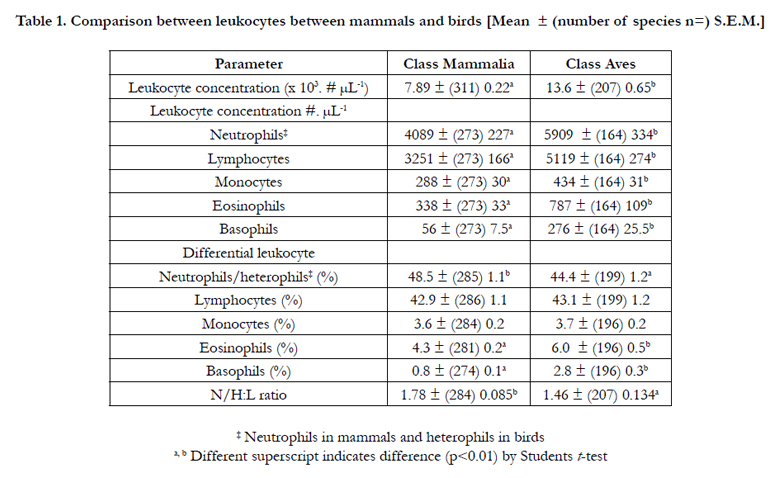

Table 1. Comparison between leukocytes between mammals and birds [Mean ± (number of species n=) S.E.M.]
The differences between blood concentrations of leukocytes and the differential leukocyte percentages in different mammalian groups are summarized in Tables 2 and 4 respectively. There was no difference in the blood concentrations of leukocytes between marsupial and placental mammals (Table 2). There were insufficient numbers of egg laying mammals for statistical analysis. Within the placental mammals, the blood concentrations of leukocytes were lowest in rodents and lagomorphs (Super-order Glires), elevated (p<0.01) in species in the super-orders Primatomorpha and Laurasiatheria and highest elevated (p<0.01) in species in the Super-orders Afrotheria and Xenarthra (Table 2). Within the Super-order Laurasiatheria, the lowest blood concentrations of leukocytes were in Orders Chiroptera and Soricomorpha while the highest were in species in the orders Erinaceomorpha and Carnivora (Table 2).
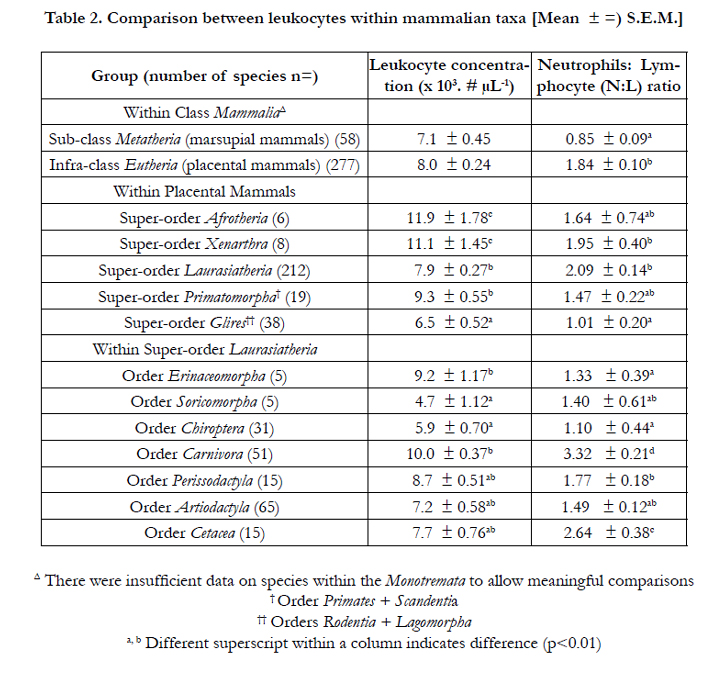
Table 2. Comparison between leukocytes within mammalian taxa [Mean ± =) S.E.M.]
There were no differences in the blood concentration of leukocytes between species of birds the Sub-classes Paleognathae and Neognathae (Table 3). In contrast, the concentration of leukocytes was higher in the species within the Landbird assemblage than the Charadriiformes (p<0.05) (Table 3) and in the Afroaves than the Australaves (Table 3). There were no differences between taxa within the Waterbird radiation (between the orders - Ciconiiformes, Pelecaniformes, Procellariiformes and Sphenisciformes)(data not shown).
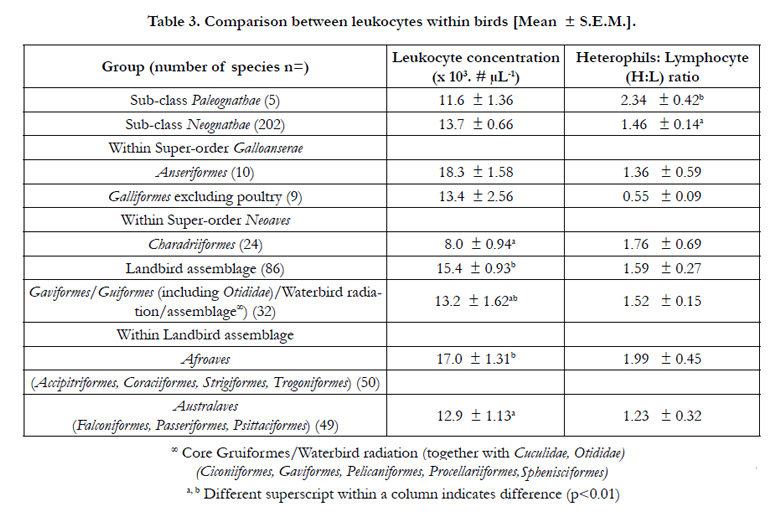
Table 3. Comparison between leukocytes within birds [Mean ± S.E.M.].
The N:L ratio was lower (p<0.01), in marsupial than placental mammals; being less than half. Moreover, the N:L ratio was greater in species within the Super-orders Laurasiatheria and Xenarthra (Table 2); the former reflecting the very high ratios in species within the Orders Carnivora and Cetacea. There were no differences in H:L ratio between avian groups except it was greater (p<0.05) in Sub-class Paleognathae than Neognathae (Table 3).
There were differences (p<0.01) in the percentages of both neutrophils and lymphocytes between marsupial than placental mammals (Table 4). Within the placental mammals, the percentage of neutrophils were higher (p<0.01) in the species in the Superorder Xenarthra and Laurasiatheria and lowest in the Superorder Afrotheria and Glires (Table 4). Conversely, the percentage of lymphocytes were lowest in the species in the Super-order Xenarthra, Laurasiatheria and Primatomorpha and highest in Glires (Table 4). There were also differences with monocytes (highest in the Super-order Afrotheria), eosinophils (highest in the Superorder Laurasiatheria) and basophils (highest in the Super-order Primatomorpha). There were also differences within the Superorder Laurasiatheria with neutrophils was highest (and lymphocytes lowest) in species in the Orders Carnivora and Order Cetacea; monocytes lowest in the Order Chiroptera; eosinophils highest in species in the Orders Cetacea and Erinaceomorpha and basophils lowest in species in the Order Chiroptera and highest in Orders Chiroptera and Erinaceomorpha and Perissodactyla (Table 4).
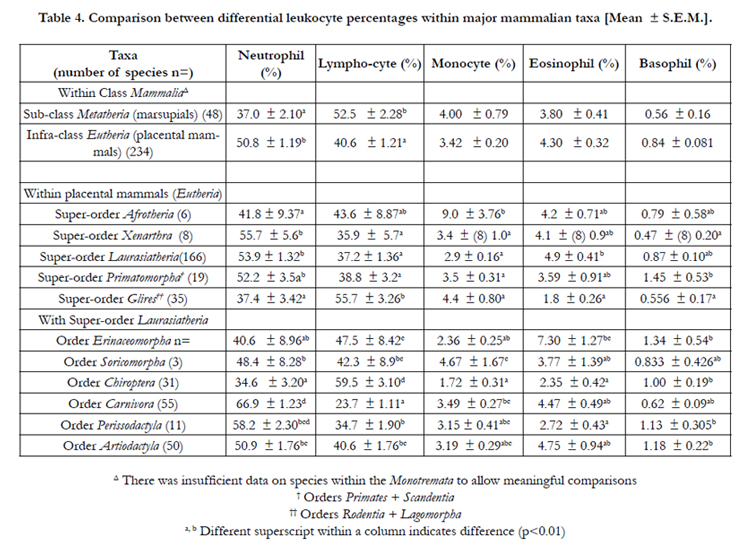
Table 4. Comparison between differential leukocyte percentages within major mammalian taxa [Mean ± S.E.M.].
There were some differences in differential leukocyte concentration in different avian groups. The heterophil percentage was markedly higher (p<0.05), and the percentage lymphocytes concomitantly lower (p<0.05), in Sub-class Palaeognathae than in the Neognathae (Table 3). There were no differences in the heterophil or lymphocyte concentration between Anseriform and Galliform birds or the major groups shown within the Neoaves (Table 5).
However, the heterophil percentage was somewhat greater in the Afroaves than in Australaves (p<0.05) while the percentage lymphocytes was concomitantly lower (p<0.05) (Table 5). There were no differences between avian groups in the percentages of monocytes, eosinophils and basophils (Table 3).
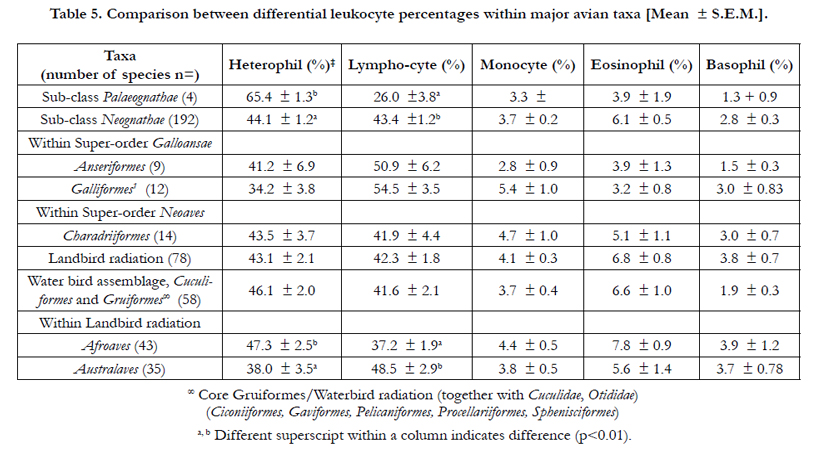
Table 5. Comparison between differential leukocyte percentages within major avian taxa [Mean ± S.E.M.].
There were a series of clear relationships between blood leukocyte parameters and log body weight (Table 6). There were positive allometric relationships (p<0.002) for the blood concentrations of leukocytes in both mammals and birds; for both the concentrations and percentages of neutrophils (mammals) and heterophils (birds) and for the percentage of lymphocytes in both mammals and birds. Indeed, the allometric relationship explaining over 20% of variance in the percentage of neutrophils in both mammals and birds. There were also allometric relationships for monocytes (birds), eosinophils (mammals) and basophils (birds).
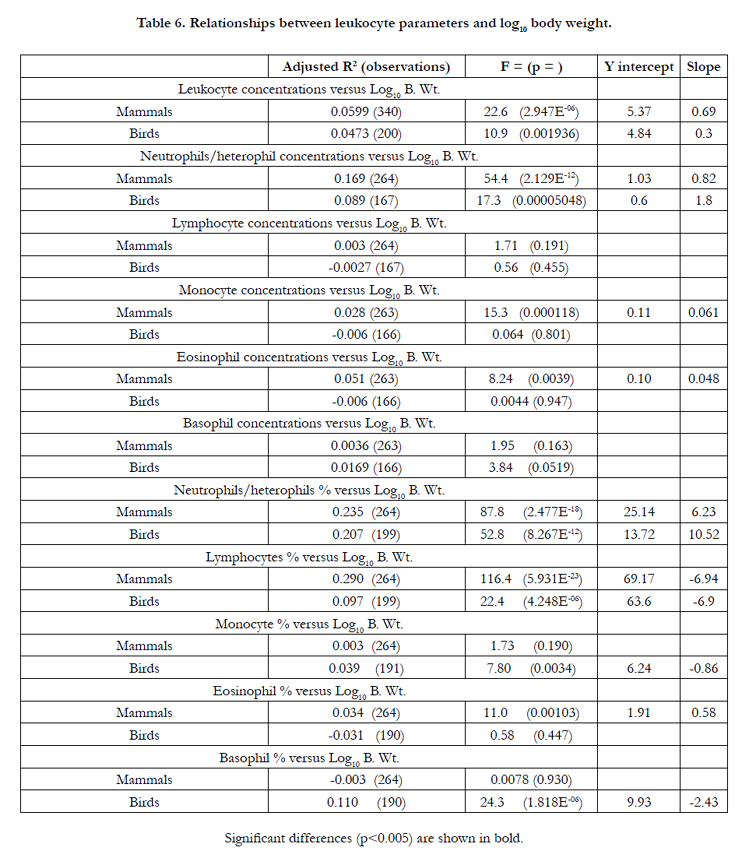
Table 6. Relationships between leukocyte parameters and log10 body weight.
Discussion
The present data support a level of control of the numbers and percentages leukocyte within birds and mammals. This is remarkable given the very short lifespan of the leukocytes and the classes of these. For instance, the lifespan of neutrophils in the circulation is short being estimated by in vivo labelling as 5.4 days in humans [26] and 11.4 hours in mice [27].
The present analysis provides evidence for differences in leukocyte numbers and differential leukocyte concentrations with phylogenic relationship between and among birds and mammals. The blood concentration of leukocytes was higher in birds than mammals reflecting increases in all of the classes but in particular lymphocytes, monocytes, eosinophils and basophils (Table 1). This is to the best of our knowledge the first report of taxa differences in leukocyte number (and leukocyte classes) between and within mammals and birds. There were higher concentrations and the percentages of eosinophils and basophils in birds than mammals. The establishing of these differences was made possible by the large data base employed. The basis of the lower numbers of leukocytes in mammals is not readily apparent but may reflect greater efficiency and/or lower basal metabolic rate in mammals. There is need to establish whether there are functional differences.
The present analysis provides the first evidence for allometric relationships for leukocyte numbers and differential leukocyte concentrations/percentages in both mammals and birds. The immune system would be expected to scale with the size of an organism [28]. On theoretic grounds, transmission rates for pathogens have been related to the body weight of the host in an allometric manner [29] with the transmission coefficient threshold scaling allometrically [30]. Moreover, allometric scaling has been demonstrated on the pathogenesis of diseases – the times from infection to either the first symptoms or death for five pathogens [31]. It is reasonable to suggest that the circulating concentrations of neutrophils would increase with the duration of exposure of host animals to pathogens as would be seen with allometric scaling. Moreover, as the infective dose of a pathogen would be expected to scale with body, it might be predicted that more large animals would have sub-clinical infections and consequently high concentrations of neutrophils.
Neutrophils are important components of the innate immune system. They are recruited to site of bacterial, fungal or protozoan infection. Activated neutrophils undergo apoptosis and is removed by macrophage (reviewed: [32-34]). The circulating concentration of neutrophils depends on the rate of production, release from the bone marrow, clearance/loss from the blood (reviewed: [35]) and obviously also blood volume with a “neutrostat” or homeostatic set point postulated. The present data is supportive of the concept of the “neutrostat”.
References
- Nunez J, Nunez E, Bodi V, et al. (2008) Usefulness of the neutrophil to lymphocyte ratio in predicting long-term mortality in ST segment elevation myocardial infarction. Am. J. Cardiol 101(6): 747-752.
- Duffy BK, Gurm HS, Rajagopal V, et al. (2006) Usefulness of an elevated neutrophil to lymphocyte ratio in predicting long-term mortality after percutaneous coronary intervention. Am J Cardiol 97(7): 993-996.
- Halazun KJ, Aldoori A, Malik HZ, et al. (2008) Elevated preoperative neutrophil to lymphocyte ratio predicts survival following hepatic resection for colorectal liver metastases. Eur J Surg Oncol 34(1): 55-60.
- Dhabhar FS (2002) A hassle a day may keep the doctor away: stress and the augmentation of immune function. Integr Comp Biol 42(3): 556–564.
- Gross WB, Siegel HS (1983) Evaluation of the heterophil/lymphocyte ratio as a measure of stress in chickens. Avian Dis 27(4): 972–979.
- Huff GR, Huff WE, Balog JM, et al. (2005) Stress response differences and disease susceptibility reflected by heterophil to lymphocyte ratio in turkeys selected for increased body weight. Poult Sci 84(5): 709-717.
- Davis AK, Maney DL, Maerz JC (2008) The use of leukocyte profiles to measure stress in vertebrates: a review for ecologists. Funct Ecol 22(5): 760–772.
- Wojczulanis – Jabubas K, Jakubas D, Czujkowska A, et al. (2012) Blood parasite infestation and the leukocyte profiles in adult and immature reed warblers (Acrocephalus scirpaceus) and sedge warblers (Acrocephalus schoenobaenus). Ann Zool Fennici 49(5-6): 341-349.
- Cirule D, Krama T, Vrublevska J, et al. (2012) A rapid effect of handling on counts of white blood cells in a wintering passerine bird: a more practical measure of stress? J Ornithol 153(1): 161–166.
- Matson KD, Horrocks, N.P., Tieleman, B.I, et al. (2012) Intense flight and endotoxin injection elicit similar effects on leukocyte distributions but dissimilar effects on plasma-based immunological indices in pigeons. J Exp Biol 215(21): 3734-3741.
- Rajion MA, Saat IM, Zulkifli I, et al. (2001) The effects of road transportation on some physiological stress measures in goats. Asian-Aust J Anim Sci 14(9): 1250-1252.
- Maeda Y, Tomioka M, Hanada, M, et al. (2011) Changes in peripheral blood lymphocytes and neutrophils counts and function following long-term road transport in thoroughbred horses. Intern. J Appl Res Vet Med 9(3): 284-289.
- McLaren GW, Macdonald DW, Georgiou C, et al. (2003) Leukocyte coping capacity: a novel technique for measuring the stress response in vertebrates. Exp. Physiol 88(4): 541–546.
- Swan MP, Hickman DL (2014) Evaluation of the neutrophil-lymphocyte ratio as a measure of distress in rats. Lab Anim (NY) 43(8): 276-282.
- Scanes CG (2015) Blood. In: Sturkie’s Avian Physiology. (6th edn) ,Elsevier, New York. 167-191.
- Del Holo J, Elliot A, Sargatal J, David A. Christie (1992) Handbook of the birds of the World., Lynx Edicions, Barcelona, Spain. 1-16.
- Animal Diversity Web, Zoology Museum (2015) University of Michigan.
- Livezey BC, Zusi RL (2007) Higher-order phylogeny of modern birds (Theropoda, Aves: Neornithes) based on comparative anatomy. II. Analysis and discussion. Zool J Linn Soc 149(1): 1-95.
- Hackett SJ, Kimball RT, Reddy S, et al. (2008) A phylogenomic study of birds reveals their evolutionary history. Science 27(5884): 1763-1768.
- Frank L (2013) Handbook of the birds of the World, Special volume: New species and global index. Lynx Edicions, Barcelona. 812.
- Tree of Life (2015) Accessed: tolweb.org/tree/
- Lindblad-Toh K (2004) Genome sequencing: threes company. Nature 428(6982): 475-476.
- Morgan CC, Foster PG, Webb AE, et al. (2013) Heterogeneous models place the root of the placental mammal phylogeny. Mol Biol Evol 30(9): 2145-2156.
- Elhaik E, Graur D (2014) A comparative study and a phylogenetic exploration of the compositional architectures of Mammalian nuclear genomes. PLoS Comput Biol 10(11): e1003925.
- Spaulding M, O'Leary MA, Gatesy J (2009) Relationships of Cetacea (Artiodactyla) among mammals: increased taxon sampling alters interpretations of key fossils and character evolution. PLoS One 4(9): e7062.
- Pillay J, den Braber I, Vrisekoop, N, et al. (2010) In vivo labeling with 2H2O reveals a human neutrophil lifespan of 5.4 days. Blood 116(4): 625-627.
- Basu S, Hodgson G, Katz M, et al. (2002) Evaluation of role of G-CSF in the production, survival, and release of neutrophils from bone marrow into circulation. Blood 100(3): 854-861.
- Wiegel FW, Perelson, AS (2004) Some Scaling Principles for the Immune System. Immunol. Cell Biol 82(2): 127–131.
- De Leo GA, Dobson AP (1996) Allometry and simple epidemic models for microparasites. Nature 379(6567):720-722.
- Bolzoni L, De Leo GA, Gatto M, et al. (2008) Body-size scaling in an SEI model of wildlife diseases. Theor Popul Biol 73(3): 374-382.
- Cable JM, Enquist BJ, Moses ME (2007) The allometry of host-pathogen interactions. PLoS One 2(11): e1130.
- Appelberg R (2007) Neutrophils and intracellular pathogens: beyond phagocytosis and killing. Trends Microbiol 15(2): 87–92.
- Nauseef WM (2007) How human neutrophils kill and degrade microbes: an integrated view. Immunol Rev 219: 88–102.
- Luna-Gomes T, Filardy AA, Rocha JDB, et al. (2014) Neutrophils Increase or Reduce Parasite Burden in Trypanosoma cruzi-Infected Macrophages, Depending on Host Strain: Role of Neutrophil Elastase. PLoS ONE 9(3): e90582.
- Bugl S, Wirths S, Müller, MR, et al. (2012) Current insights into neutrophil homeostasis. Ann NY Acad Sci 1266: 171-178.


