Exertional Dyspnea Comparison in Four Maximal Training Exercises used in Pulmonary Rehabilitation: Continuous versus Bi-Level Responses in Time
Gimenez M1*, Saavedra P2, Lantarón EM3, Alonso B4, Polu E5, Bernard A6
1 Departments of Physical Medicine and Rehabilitation and Respiratory Physiotherapy, University Hospital of Gran Canaria Dr. Negrín, Bco de la Ballena s/n, University of E-35020- Las Palmas de Gran Canaria, Spain.
2 Department of Mathematics and Informatics, University Campus of Tafira, University of Las Palmas de Gran Canaria, Spain.
3 Faculty of Physiotherapy Faculty of Physiotherapy - Campus of Pontevedra, A Xunqueira, Pontevedra, University of Vigo, Spain.
4 Departments of Internal Medicine, University Hospital of Gran Canaria Dr. Negrín, Las Palmas de Gran Canaria, Spain.
5 Institut de Réadaptation, Université de Nancy, Nancy, France.
6 Faculty of Medicine, National Institute of Health and Medical Research, Spain.
*Corresponding Author
Dr Manuel Gimenez, MD, PhD,
Departments of Physical Medicine and Rehabilitation and Respiratory Physiotherapy,
University Hospital of Gran Canaria Dr. Negrín, Bco de la Ballena s/n,
University of E-35020- Las Palmas de Gran Canaria, Spain.
E-mail: gimen3@hotmail.com
Received: March 10, 2017; Accepted: June 29, 2017; Published: July 01, 2017
Citation:Gimenez M, Saavedra P, Lantarón EM, Alonso B, Polu E, et al., (2017) Exertional Dyspnea Comparison in Four Maximal Training Exercises used in Pulmonary Rehabilitation: Continuous versus Bi-Level Responses in Time. Int J Resp Dis Care Med. 2(4), 28-34.
Copyright: Gimenez M© 2017. This is an open-access article distributed under the terms of the Creative Commons Attribution License, which permits unrestricted use, distribution and reproduction in any medium, provided the original author and source are credited.
Abstract
Objective: a) To compare the exertional Dyspnea (ED) values at the maximum levels of four tests used in pulmonary rehabilitation, performed by ED subjects; b) to analyze the ED evolution in time during two training exercises: Constant, the CE 80% and Bi-level, the Square wave endurance exercise test (Sweet).
Design: Twenty-four non-medicated ED subjects, aged 33 to 60 years gave their informed consent. They performed, before any intervention, 4-maximal exercises (at 24 hrs interval): incremental (30W/3min), to determine ventilatory anaerobic threshold (VAT) and peak work rate (PWR); constant CE 80%; Bi-level (SWEET-45 min alternating 4min-VAT and 1min- PWR): and the 6 min walking test (6MWT). ED was measured (Borg scale) at PWR; 14th-15th, 29th-30th, 44th-45th SWEET min, and 1st, 3rd, 5th, 10th and maximal minute in CE 80%.
Results: In the CE 80% nobody could maintain the 45 min while the SWEET was sustain 45 minutes by all subjects. The andom effects model was used for ED evolution. The essential facts are: On CE 80%, ED is largely higher (p<0.001) and increased progressively until the go up. The ED variances per unit time on SWEET-Base, were not different, however it decreased at the SWEET-Peak (p<0.001).
Conclusions: 1) The Sweet-base is the lowest dyspnea level between the four maximal exercise-tests studied; 2) The Sweetpeak’s ED represents 69% of CE 80% and 67% of PWR ED; 3) The 6MWT’s ED is 95% of Sweet-peak’s ED and both represent respectively 65% and 69% of the PWR ED; 4) The CE 80% appears to be an exercise with exceedingly dyspnea as ED tends to increase progressively, while on the contrary, the Sweet-peak allows a significant decrease in ED per unit time (p<0.001).
2.Introduction
3.Methods
3.1 Subjects
3.2 Incremental Exercise
3.3 Maximal Constant Power at 80% PWR (CE 80%)
3.4 Square Wave Endurance Exercise Test (SWEET)
3.5 The six minute walking test (6MWT)
3.6 Evaluation of exertional dyspnoea during various exercise tests
3.7 Statistical Analysis
4.Results
5.Discussion
6.Conclusion
7.Acknowledgments
8.References
Keywords
Muscle Exercises; Ventilatory Anaerobic Threshold; Bi-Level and Constant Tests, VO2 peak; Metabolism.
Introduction
Exercise training is an essential component of Pulmonary Rehabilitation [1] (PR), and endurance training is commonly used [1-3]. Physical aerobic training, particularly of the lower extremities is mandatory (level of evidence A) [3]. Generally, the endurance type of training applied during PR includes cycling exercises [2,3]. Programmers’ including relatively high-intensity endurance training have proved to be effective [1-3]. Three protocols are usually proposed for training patients with chronic obstructive pulmonary disease (COPD) [1] and/or with exertional dyspnea (ED) [4-6]. The first is a sustained prolonged constant exercise (CE 80%) for 45 minutes at 80% of the peak work rate (PWR) [7- 9]. The second protocol is Interval Training (IT) which involves a certain number of very intense exercises of short duration (15, 30 seconds), alternating with corresponding short intervals of rest [10-12]. The third is a Bi-level test alternating repeated periods of high intensity exercise following a prolonged interval of aerobic exercise [13-17]. Early studies on healthy subjects showed that, during interval or bi-level training, more work can be performed before exhaustion, during the full session without stop, with better subjective tolerance [10-12, 17]. Moreover, healthy subjects10 and pulmonary patients [11] were able to complete a significantly greater total amount of work intermittently than during continuous exercise, suggesting that IT may be superior to continuous exercise as a mode of training for patients with COPD [11,12]. Therefore, there is a theoretical reason to continue research into tools that increase the exercise intensity patients can tolerate, because there may be cases in which the workload is excessive or unsafe for the muscles, heart or pulmonary circulation, even if they are strengthened [3]. Since CE uses a work level substantially above the ventilatory anaerobic threshold (VAT) [7-9]. It generates greatly progressively uncompensated metabolic acidosis [18], high ED, and overbreathing [7-9], which increase the respiratory drive [19] and promote more ED [7-9,18]. Also, during five consecutive one-minute bouts followed by a four-minute rest, the pH decreased progressively and drastically (about 7.20 or less) in a group of healthy subjects [1,20,21]. Accordingly, more information should be obtained about the homeostasis and particularly ED, during and after these such training sessions. Also, there is little information about the evolution of ED during a full training session [8]. We propose the Square Wave Endurance Exercise Test (SWEET), a 45-min bi-level and "tailored" ergospirometric (aerobic-anaerobic) training programme [13] involving nine peaks of high intensity of baseline PWR, with appropriate homeostasis [15,21], for subjects with ED and normal spirometry [4,5].
The aim of the study is twofold: a) to compare the ED values at the maximum levels of four tests used in current practice in pulmonary rehabilitation, performed by the same subjects with ED symptom; b) to analyze the ED evolution in time during two 45 min training exercises frequently used: the CE 80% and the SWEET.
Twenty-four adult, non-medicated male smokers, aged 33 to 60 years, were referred from outpatient clinics for ED [4,5]. They answered the ECSC questionnaire [22] (the European Community for Coal and Steel) on respiratory symptoms. to ensure they complied with the inclusion criteria, clinical stability, suitable spirography [4,5]; chest, diaphragm, pulmonary radiological examinations, and electrocardiogram were normal, and they don’t have history of exercise-induced-asthma [4,5]. Subjects were excluded if they had any chronic cardiopulmonary, neuromuscular, or orthopedics conditions interfering with exercise including over 12% increase in forced expiratory volume in 1s (FEV1) by using bronchodilators. Informed consent was obtained from all patients after they were made fully aware of all the tests they would undergo. All the study procedures were conducted according to the recommendations outlined in the Helsinki Declaration, and were applied before any therapeutic protocol. None of the subjects had a medication regimen, nor take medication during the protocol, but all were smokers.
All subjects performed four maximal exercises: The first was incremental (30W/3 min) [23] to determine PWR and ventilatory anaerobic threshold (VAT), the variables necessary to establish the two following 45-min exercises: CE 80% and the SWEET. The last two tests were randomized. The four is the six minute walking test (6MWT).
We used [18, 21,23] the incremental test of 30W/3 min on an electronically braked cycle ergometer (model 1000S, Medifit Inc Maarn, The Netherlands) with a first step of 30w/3min. The peak work rate tolerated by each patient was determined during the full last three minutes, before volitional exhaustion, and the VAT was determined as previously described [16,23]. Several lung functional parameters (LFP) were studied: The value used for VO2 peak (Jaeger, Oxycon Champion, Germany) corresponded to the highest value achieved over the last 30-s collection period [16,23]; ventilatory parameters were described by ventilation (VE), tidal volume (VT), and breathing frequency (fB), and respiratory exchanges by oxygen uptake (VO2) and CO2 output (VCO2) [16,23]; The electrocardiogram and cardiac frequency (fC) were monitored during the last 30 s of each step.
After de PWR and VO2 peak were determined, the subjects performed CE 80%, at 60 revolutions per minute (rpm) until exhaustion on a cycle ergometer (see above) [23] Percentage peripheral oxygen saturation (SpO2%), and fC were monitored by a pulsioxymeter (Biox Pulse Oximeter: Ohmeda, Louisville, CO, USA).
Preliminary measurements of PWR and VAT, in the incremental test described above, are required: These two individual parameters are essential and require using the 30W/3min test to establish SWEET levels [16, 22, 23]. This option is largely described and discussed in reference [23]. The Base, (4 min aerobic exercise at VAT) expressed as a percentage of PWR, usually varies between 40% and 55% in untrained healthy subjects [16, 22] and most COPD patients [16] and the 1-min Peak (“lactic and alactic anaerobiosis exercise”) is chosen from PWR [16, 21, 23]. Maximum intensity of endurance during 45 min (MIE45), or the highest percentage Base/Peak that can be performed in 45 min, is defined by fc at the 45th min of the test, which should correspond to (220- age), or the maximal fc observed at the PWR, and by the inability to continue for 45 min when the base is increased by +5% of the PWR [13-16,26]. It is expressed as total mechanical work (TMW) in kJ/kg of body weight and represents endurance capacity [13,16,25]. It is determined by the total of the exercise wattage product (1 watt = 1Jule/sec) of the Base exercise phase multiplied by 36min x 60s = 2160s of the 9 Bases of the exercise phases of 4 min per session, and added to the wattage of the Peak exercise phase multiplied by 9 min x 60 s = 540 s of the 9 peaks of the exercise phases of 1 min per session of 45-min SWEET; thus, TMW = [(PWR x 2160s) + (VAT x 540s)]/weight (kg)/1000 (J)= kJ/kg [13,16,21,26].
Trying to reproduce the Sweetraining, certain physiologists groups, attempt to use the PWR from the incremental 10W/min, and found that Sweet is not feasible, because too exhaustive. Of course, this is normal because the PWR 10W/min and 30W/3min are significantly different, the first get the highest value of PWR, although VO2max is the same in both tests [16, 22, 23]. Once again, to get a confortable SWEET during 45 minutes, the PWR should be measured exclusively with the 30W/3min test.
Patients walk in a long corridor of the hospital, which distance is marked every five meters and the total length is known, under the supervision of a physiotherapist who dials the number of return flight and monitors the patient until the end.
The subjects were familiarized with the evaluation procedure before the tests. Dyspnoea was defined as a sensation of uncomfortably restricted breathing, and the subjects were warned that all other sensations (nose clip, mouthpiece, uncomfortable seat, and perspiration) should not be taken into account. The degree of dyspnoea was subjectively estimated by all the subjects, before any interventions, with the Borg scale [24] modified from its original form to a 10-point scale, with verbal expressions of severity anchored to specific numbers, using descriptive categories. Exertional Dyspnoea was measured at the end of each step in the incremental exercise, up to the PWR; at the 1st, 3rd, 5th, 10th and last minutes of the CE 80%; and at the 14th-15th, 29th-30th and 44th-45th minutes of the SWEET Base and Peak, respectively.
Exertional dyspnea evaluated in different experimental conditions was summarized as medians and interquartile range (IQR = 25th – 75th percentile) and their distributions plotted by means of the box plots. For the Constant exercise (CE 80 %), we denote by Di, t the exertional Dyspnea values corresponding to ith subject observed at the time t.
The graphical exploration suggests the next mixed model effects:
EDi,j = (t/α0 + α1t) + bi + ei,t
being the observation times 1, 3, 5, 10 and 20 minutes. For the SWEET, the trends (base and peak) were clearly linear and thus the mixed model effects proposed has the form:
EDi,t,k = θ + α.k + β.t + γ.k.t + bi + ei,t,k
being now the observation times respectively for the Base and Peak 14, 15; 29, 30; and 44, 45 minutes. Here, EDi,j,k also denote the exertional Dyspnea corresponding to ith subject, at the time t and aerobic (k=0) or anaerobic (k=1) conditions. For both models, bi denotes the random effect corresponding to ith subject and ei,j or ei,t,k the intrasubject variability. Both models were fitted using the methodology of Laird and Wäre [25] and the library NLME corresponding to statistical package R 2.7.2.
Results
In the CE 80% group all the patients go up until approximately the 20th min when they stopped exercise volitionally. Nobody could maintain the 45 min of the test. The individual ED evolution increases progressively until the end in 22 over 24 subjects. On the contrary, the MIE45 was maintained non-stop for 45 minutes by all subjects in the SWEET group. However, nobody could maintain for 45 min when the Base was increased by +5 % of the PWR and stopped exercise between the 25th and 35th minute. Figure 1 shows the box-plots for exertional Dyspnea (Borg scale) in different experimental conditions. ED is significantly higher in the PWR and CE 80% than in the SWEET-Peak (see Table 1). The one-minute SWEET-Peak’s ED is slightly higher than in the 6MWT’s ED. The SWEET-Base presents the lowest values of ED.
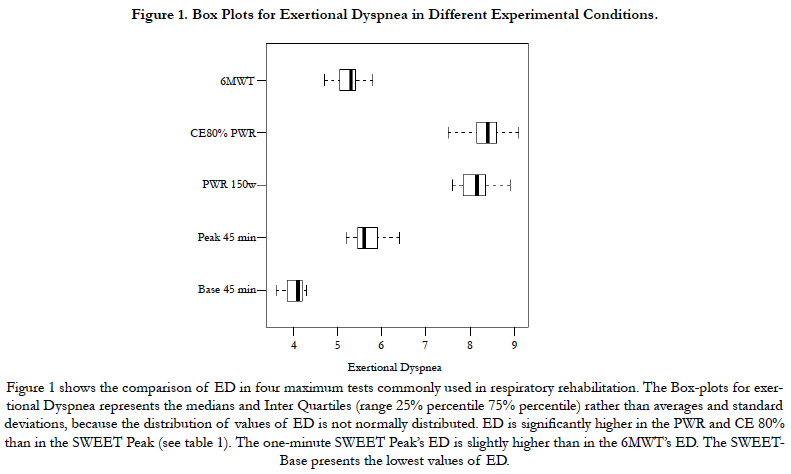
Figure 1. Box Plots for Exertional Dyspnea in Different Experimental Conditions.

Table 1. Exertional Dyspnea in Different Experimental Conditions.
The essential findings for both models are summarized in Table 2. Figure 2 shows the data and the corresponding adjustment of the estimated model. A significant increase in ED with time is observed during CE 80%. The individual ED evolution increases progressively until the end in 22 over 24 subjects. Inversely, during the Sweet the variance of ED per unit time at Base is b = 0.0051, but they do not show clear statistical significance (p = 0.0658). On the other hand, a significant decrease in ED per unit time is observed at the Peak (p <0.001, Figure 3). The ED in the SWEETBase and in the SWEET-Peak was always significantly lower than in the CE 80% and PWR. While the Peak ED is significantly higher than the 6MWT the ED difference is small (Figure 1).
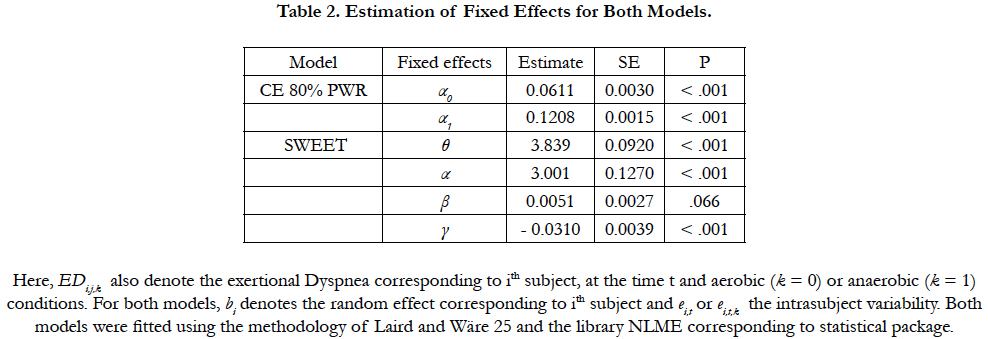
Table 2. Estimation of Fixed Effects for Both Models.
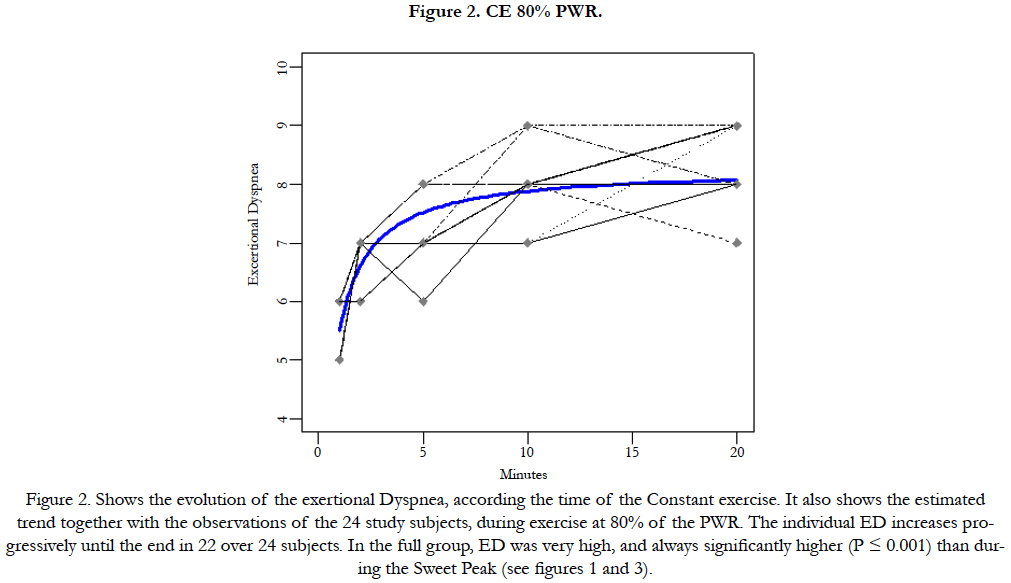
Figure 2. CE 80% PWR.
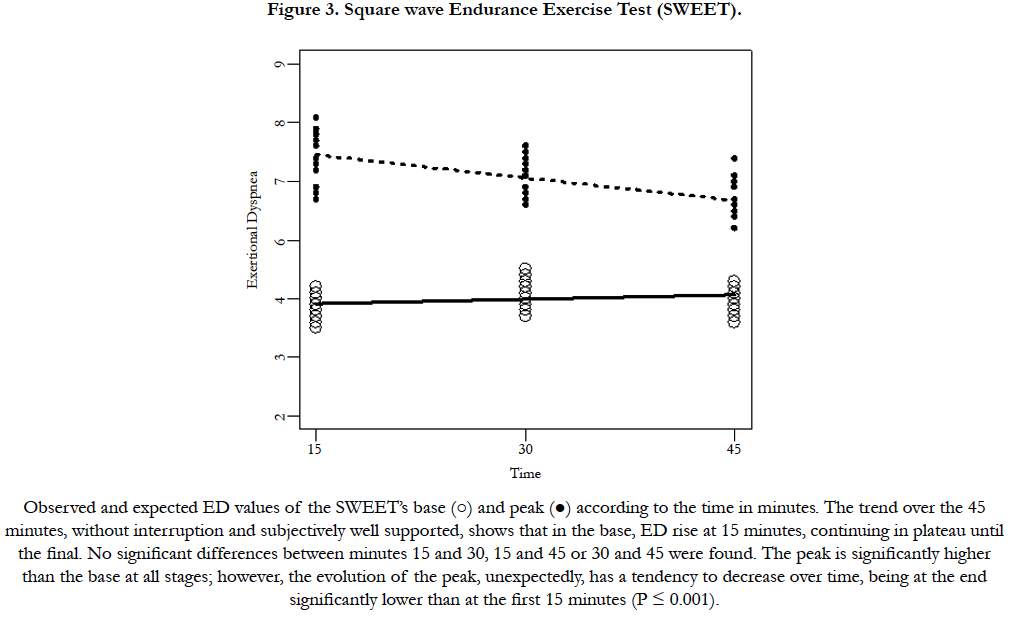
Figure 3. Square wave Endurance Exercise Test (SWEET).
Discussion
The ED at the end of CE 80% and of the PWR present the highest values of ED, positioned in close proximity to the top of the Borg’s scale. On the contrary, the ED at the 45th min of the Sweetpeak is only 55% of the ED of these maximal exercises. Moreover, no significant differences in ED were observed in the three successive 15 minute in the SWEET-Base, was expected because corresponded to the VAT and confirms, as previously described, subjectively good recovery after the peak [13-16,21,26]. However, the progressive decrease in ED at the peaks was unexpected. Also, the ED pattern during the SWEET, contrasts with that of CE 80% which presents an inverse evolution.
Previous studies have shown that it is very hard to work at 80% of the peak work rate for 45 minute. The maximal supported power (MSP), determined by 20-watt steps over 20 minute, which VO2 represents ≈80% of the VO2max or PWR, is defined by ventilatory, cardiorespiratory, and metabolic criteria [18, 23,27]. It is performed on anaerobiosis [18] and it can also be defined by the fact that the MSP+20W cannot be maintained for 20 min [23,26,27]. In practice, patients usually have to give up this exhausting test at roughly the 10th minute. Both tests are performed in anaerobiosis, the last (PMS+20W) makes it possible to measure the VO2max [18,23]. In addition, the changes in arterial [H+] and lactate concentrations during the full 20-minute period of the MSP and 10 minutes after recovery was studied in nine healthy subjects [18,26]. Both parameters were very high at the 10th minute and increased even more so at the 20th minute; as well as significantly higher values (p≤0.01) of non-compensated severe metabolic acidosis were determined at the end of the exercise, indicating heavy anaerobic exercise. This can also be appreciated by comparing values obtained in the same subjects during 20 min with less intense exercise levels (i.e. 41-50% and 64-75%) of PWR [18]. In both cases, [H+] and lactate concentrations increased moderately at the 10th minute and the values were significantly reduced at the 20th minute, indicating aerobic exercise. In addition, in two COPD patients, one with more than 40 liter/min of maximal ventilation and the other with less than this, the evolution of ventilation and VO2 during CE 80% was also described [28]. In the first case, E progressively increased, as in healthy subjects, due to the effects of anaerobiosis up to the end of the test at the 9th minute[28]. The second, in spite of the subject’s excellent cooperation, and because of the marked airflow obstruction, VE get the plateau after the 6th minute of exercise and also stopped at the 9th minute. These results probably explain why the 24 patients with ED in this study could not complete the 45 minutes of CE 80%. Neder et al., [29] showed, and confirmed, that the highest level of continuous exercise that could be sustained for a relatively long period of time (20 minutes) was equivalent to 82% of PWR. Thus, the application of 80% of PWR in pulmonary rehabilitation [7-9, 11, 12, 17] presents serious difficulties because the elevated ED for patients with moderate or severe COPD.
Unlike the CE 80% test, some previously published data on SWEET results can explain the acceptable trend of the ED pattern observed in this study. First, SWEET levels are tailored, and thus can be performed, even at the beginning of the programme, in one 45 min complete session [13-16,21,26]. The SWEET below the MIE45 (-5 % of the ratio Base/Peak) is considered easy, while exercise over MIE45 (+5 %) is considered difficult. In the easy exercise, fc was submaximal, while in the latter, fc was maximal before the subject stopped the SWEET (usually from the 25th to 35th min) [13,16,20,23,26]. Second, the SWEET Peak is the first minute of a maximal constant exercise; it represents up to 60% of the maximum VO2 observed [13-21,26]. The 1-min peak trains the alactic (first 15’’), and the lactic (the following 45’’) anaerobiosis phases, triggering hyperventilation at the origin of the observed ventilatory alkalosis [13,16,21,26], that corrects, at least partially, the metabolic acidosis [15,21,26]. Thus, it is a good level for training, but is not sufficiently longer to increase ED, Moreover, during the Base or aerobic phase, the active working muscles transform the excess of lactate, produced during the Peak, into glucose by glyconeogenesis [15,21,26]. These two mechanisms explained the accurate homeostasis (arterial blood pH in the normal range) maintained during the whole SWEET in healthy subjects [15,21,26] and in COPD patients [16,26]. This is in agreement with the study by Hermansen et al., [20] showing that, during active recovery after a maximal exercise test, the excess of lactate was metabolized more quickly during active rather than passive recovery [20]. Third, the high serum concentration of adrenocorticotrophic hormone (ACTH) obtained during maximal exercise, goes along with higher elevations of serum endorphins and cortisol [26]. The increased cortisol so liberated increases the mobilization of free fatty acids that make use of energetic substrate, reducing glucose consumption to preserve it for better muscle and neuron functioning [20, 26]. The increased serum cortisol produced by the SWEET [26] also has beneficial effects for asthmatic subjects performing bi-level exercise, safeguarding against exercise-induced asthma[31]. Moreover, SWEETraining stimulates increasing changes in five serum enzymes (glycolytics and oxidatives) [26] and in mitochondria [26,30], where fuel is converted to energy, causing them to burn fat first-even during low and moderate-intensity workouts [30]. Improved fat burning means endurance athletes and well trained subjects can go further before tapping into carbohydrate stores [30]. Fourth, at the end of the programme, significantly higher workloads could be performed with the same VE [14,16,21,26]. This reflects an intensification of the endurance and strength of the ventilatory muscles confirmed in previous reports [14,16,21,26]. Fifth, after only three weeks of SWEETraining was observed a fast improvement [14,16,26,32]. The same results have been observed in normal subjects [14], in COPD patients [16], in heart transplant recipients [32] trained with the SWEET versus a constant exercise of similar total physical work, and in lung transplant recipients before transplantation [33]. These results suggest good muscle adaptation, good maximal level of applied resistance, good ventilation, and good compliance on behalf of the subject. Such reduction of effective training time (3 weeks) has time and economical implications; with fewer training sessions - six, eight, or twelve weeks- are usually necessary [1]. Sixth, the repeated Base-Peak exercise phases nine times in each training session, train cardiac, skeletal, and respiratory muscles simultaneously [14,16,26,32], and potentially heighten the perceptual ED threshold.[14,26,32] All of the preceding points, which include decreased brain-stem respiratory drive [19], i.e. the main dyspnea factor [1,3,5,18,26], explained the improved ED during the Peaks. Information about the constant homeostasis over the total SWEET, which is a crucial point in safety measures for training patients, was demonstrated during the SWEET in healthy subjects [15,21,26] and COPD patients [21,26], However, it was insufficiently investigated during the CE 80% [1]. Accordingly, more information about homeostasis, both during and after CE and IT of such training sessions, should be further investigated to ensure pulmonary patients’ safety.
The 6MWT, usually considered as moderate, is energetically higher than VAT and represents roughly 80% or either 100% of the O2 peak, in healthy subjects, and COPD patients [34]. In the subjects of the present study; with average MTP of 150 W, the 6MWT ED represents 65% of the PWR ED but 95% of the Sweet-peak ED. Thus the 6MWT is a hard test.
Conclusion
1) The Sweet-base is the lowest dyspnea level between the four maximal exercise-tests studied; 2) Established at the PWR, the 1-min Sweet-peak’s exertional Dyspnea represents about 55% of the corresponding ED at the end of both CE 80% and the PWR of the incremental test. Thus, Sweet is a maximal 45 min, with much less ED; 3) The Sweet-peak’s ED is slightly greater than the 6MWT’s ED and both represent respectively 68 and 65% of the PWR ED; 4) The CE 80% appears to be an exercise with exceedingly dyspnea as ED tends to increase progressively until the end of the test, while on the contrary, the Sweet-peak allows a significant decrease in ED per unit time.
Acknowledgments
We thank Lahoucine Benhamgar, PhD, epidemiologist researcher, for scientific and statistical advising, assistance and constructive criticism throughout the study; Jean Lonsdorfer MD, PhD , Maria Angeles Montoliu, MD, PhD, Belen Alonso, MD, PhH for clinical help and advice; Encarnación Abril, Mari Carmen Lareo and Andrés Aranda PT, for their participation in the clinical trial and implementation of physical protocol techniques; Juan Verona and Maeva Sossi for help with graphics and drawings; and the 25 smokers who faithfully followed the complete protocol.
References
- Ries AL, Bauldoff GS, Carlin BW, Emercy CF, Make B, et al., (2007) Pulmonary Rehabilitation: Joint ACCP/AACVPR Evidence-Based Clinical Practice Guidelines. Chest. 131( 5): 4S - 42S.
- Ambrosino N, Strambi S (2004) New strategies to improve exercise tolerance in chronic obstructive pulmonary disease. Eur Respir J. 24(2): 313-322.
- Morgan MDL, Calverley PMA, Clark CJ, Garrod R, Goldman JM, et al., (2001) Pulmonary Rehabilitation. BTS Statement. Thorax. 56: 827-834.
- Giménez M, Servera E, Abril E, Vergara P, Gomez M, et al., (2009) Exertional dyspnea, rapid shallow breathing and poor exercise tolerance: Early signs of respiratory impairment? Fisioterapia. 31(5): 183-191.
- Giménez M, Servera E, Abril E, Darias M, Gomez A, et al., (2010) Comprehensive Directed Breathing Retraining Improves Exertional Dyspnea for Men with Spirometry within Normal Limits. Am J Phys Med Rehab. 89(20): 90-98.
- Ofir D, Laveneziana P, Webb KA, Lam YM, O’Donnell E (2008) Mechanisms of Dyspnea during Cycle Exercise in Symptomatic Patients with GOLD Stage I Chronic Obstructive Pulmonary Disease. Am J Respir Crit Care Med. 177(6): 622-629.
- Casaburi R, Patessio A, Ioli F, Donner CF, Loli F, et al., (1991) Reduction in exercise lactic acidosis and ventilation as a result of exercise training in patients with obstructive lung disease. Am Rev Respir Dis. 143(1): 9-18.
- Puente-Maestu L, Garcia de Pedro J, Martinez-Abad Y, Cubillo JM, Ruiz de Ona JM, et al., (2005) Dyspnoea, ventilatory pattern, and changes in dynamic hyperinflation related to the intensity of constant work rate exercise in COPD. Chest. 128(2): 651-656.
- Maltais F, Leblanc P, Jobin J, Carrier L, Breton MJ, et al., (1997) Intensity of training and and physiologic adaptation in patients with chronic obstructive pulmonary disease. Am L Respir Crit Care Med. 155(2): 555-561.
- Fox EL, Robinson S, Wiegman DL (1969) Metabolic energy sources during continuous and interval training. J Appl Physiology. 27(2): 174-8.
- Vogiatzis I, Nanas S, Roussos C (2002) Interval training as an alternative modality to continuous exercise in patients with COPD. Eur Respir J. 20(1): 12-9.
- Sabapathy S, Kingsley RA, Schneider DA, Adams L, Morris NR (2004) Continuous and intermittent exercise responses in individuals with chronic obstructive pulmonary disease. Thorax. 59(12): 1026-1031.
- Gimenez M, Servera E, Salinas W (1982) Square Wave Endurance Exercise Test (SWEET) for training and assessment in trained and untrained subjects. I Description and cardiorespiratory responses. Eur J Appl Physiol Occup Physiol. 49(3): 359-68.
- Gimenez M, Cereceda V, Teculescu D, Aug F, Laxenaire MC (1982) Square-Wave Endurance Exercise Test (SWEET) for training and assessment in trained and untrained subjects. III - Effect on VO2 max and maximal ventilation. Eur J appl Physiol. 49(3): 379-387.
- Gimenez M, Servera E, Saunier C, Lacoste J (1982) Square-Wave Endurance Exercise Test (SWEET) for training and assessment in trained and untrained subjects. II - Blood gases and acid-base balance. Eur J appl Physiol. 49(3): 369-377.
- Giménez M, Servera E, Vergara P, Bach JR, Polu JM (2000) Endurance training in patients with chronic obstructive pulmonary disease: A comparison of high versus moderate intensity. Arch Phys Med Rehabil. 81(1): 102-09.
- Coppoolse R, Scholz AMWJ, Baarends EM, Jansee P, Wouters EF, et al., (1999) Interval versus continuous training in patients with severe COPD: a randomized clinical trial. Eur Respir J. 14(2): 258-63.
- Gimenez M, Hennequin R, Horsky P, Colas T, Saunier C (1974) Blood lactate concentration, acid base and electrolyte equilibrium during muscular exercise for 20 minutes at various loads and at the "maximal power tolerated" in man. Bull Physiopathol Resp. 10(4): 463-80.
- Adams L, Lane R, Shea SA, Cockcroft A, Guz A (1985) Breathlessness during different forms of ventilatory stimulation: a study of mechanisms in normal subjects and respiratory patients. Clin Sci (Lond). 69(6): 663-672.
- Hermansen L, Osnes JB (1972) Blood and muscle pH after maximal exercise in man. J Appl Physiol. 32(3): 304-08.
- Gimenez M, Predine E, Marchand M, Servera E, Ponz Jl, et al., (1992) Implications of lower-and-upper-limb training procedures in patients with chronic airway obstruction. Chest. 101(5): 279S-288S.
- Minette A (1989) Questionnaire of the European Community for Coal and Steel (ECSC) on respiratory symptoms. 1987 updating of the 1962 and 1967 questionnaires for studying chronic bronchitis and emphysema. Eur Respir J. 2(2): 165-77.
- Gimenez M, Salinas W, Servera E, Kuntz (1981) VO2max during progressive and constant exercise in sedentary men and women. Eur J Appl Physiol. 46(3): 237-48.
- Borg GA (1982) Psychophysical bases of perceived exertion. Med Sci Sports Exerc. 14(5): 377-81.
- Laird NM, Ware JH (1982) Random-Effects Models for Longitudinal Data. Biometrics. 38(4): 963-974.
- Gimenez M, Abril E, Rodríguez F (2004) Effects of SWEET raining on trained and untrained healthy subjects and on chronic lung patients. Prevention and rehabilitation in Chronic Respiratory Pathology: Physiotherapy, training and respiratory care. (2nd Edn), Pan American edn, Madrid . 47-59, 11, 103-117.
- Durand D, Saunier C (1959) Influence of age, sex, pulmonary volumes, morphology, training on the maximum power supported. Lung and Heart. 9: 109-118.
- Servera E, Gimenez M (1984) VO2max during progressive and constant bicycle exercise in patients with chronic obstructive lung disease. Respiration. 45(3): 197-206.
- Neder JA, Jones PW, Nery LE, Whipp BJ (2000) Determinants of the exercise endurance capacity in patients with chronic obstructive pulmonary disease. The power-duration relationship. Am J Respir Crit Care Med. 162(2): 497-504.
- Coley EF (2005) Improved muscular efficiency displayed as Tour de France champions mature. J Appl Physiol. 98(6): 2191-2196.
- Gimenez M, Predine E, Serrano E (2004) SWEET raining in walking career in healthy and asthmatic children of school age Prevention and rehabilitation in Chronic Respiratory Pathology: Physiotherapy, training and respiratory care. (2nd Edn), Pan American edn, Madrid. 397-403.
- Mettauer B, Lampert E, Schnedecker B, Frey M, Geny B, et al., (1933) A short endurance training program increases the physical fitness of heart transplant recipients. Sci Sports. 8: 25-26.
- Gimenez M, Abril E, Chabot F, Villemot JP, Plou JM, et al., (1994) Strategies for physical and ventilatory training of patients before and after pulmonary transplation. Med Sport (Paris). 68(3): 146-156.
- van Helvoort H, HeijdraYF, De Boer R, Swinkels A, Thijs HM, et al., (2007) Six-Minute Walking-induced systemic inflammation and oxidative stress in muscles –wasted COPD patients. Chest. 131(2): 439-445.


