Yield Response of Common Beans (Phaseolus vulgaris L. ) to the Rate of NPS and Bio-Fertilizer Inoculation at Boloso Bombe Woreda Wolaita Zone, South Ethiopia
Belay Yeb*, Masebo Magaze
Wolaita Sodo University, College of Agriculture, Department of Plant Sciences.P.O.Box 138, WolaitaSodo, Ethiopia.
*Corresponding Author
Belay Yeb,
Wolaita Sodo University, College of Agriculture, Department of Plant Sciences.P.O.Box 138, WolaitaSodo, Ethiopia.
E-mail: yayineblen@gmail.com, belayyebo@wsu.edu.et
Received: July 14, 2022; Accepted: October 06, 2022; Published: October 13, 2022
Citation: Belay Yeb, Masebo Magaze. Yield Response of Common Beans (Phaseolus vulgaris L.) to the Rate of NPS and Bio-Fertilizer Inoculation at Boloso Bombe Woreda Wolaita Zone, South Ethiopia. Int J Plant Sci Agric. 2022;5(1):173-179.
Copyright: Belay Yeb©2022. This is an open-access article distributed under the terms of the Creative Commons Attribution License, which permits unrestricted use, distribution and reproduction in any medium, provided the original author and source are credited.
Abstract
Common bean is one of the important pulse crops that play a vital role in human diet and consumed in sub Saharan Africa, including Ethiopia. Soil fertility is one of the factors limiting the production of common bean in Ethiopia. From these Biofertilizer and NPS fertilizers are the major yield limiting factors for common bean production in the study area. Thus, the experiment was conducted at Boloso Bombe Woreda in 2020/2021 cropping season to determine the rates of NPS and Biofertilizer on the yield components and yield of common bean at study area. The experiments were consisted of four levels of blended NPS (0, 50,100,150kg ha-1) and Bio-Fertilizer (0, 250, 500 and 750g ha-1). The RCB design in factorial arrangement with three replications was used. All data were collected and subjected to analysis of variance. The ANOVA result showed that Bio-Fertilizer had significanteffect on days to flowering and physiological maturity and plant height. The highest number of days to flowering (42.03) and days to physiological maturity (84.48) were recorded for Bio-Fertilizer (750 g). Significantly higher number of days to flowering (42.59) was recorded from 150 kg ha-1 NPS rate. The highest number of total nodules per plant (68.53) and seeds per pod (7.5) were recorded from the rate of 750 g ha 1 bio-fertilizer with NPS rate of 100 kg ha-1. The highest (3033.7 kg ha-1) and lowest (1174kg ha-1) grain yield were obtained from the interaction effect of 150 kg ha-1 NPS and 750 g ha-1 bio-fertilizer at control level respectively. The economic analysis also indicated that the highest net return of (95915.6) ETB ha-1 was obtained from rate of NPS and Bio-Fertilizer application at 100 kg ha-1 with 750 g ha-1 respectively. Based on the economic analysis of the study, it can be recommended that the rate of bio-fertilizer inoculation with 750 g ha 1and NPS 100 kg ha-11 were appropriate for superior production in the study area.
2.Introduction
3.Materials and Methods
4.Results and Discussion
5.Conclusion
6.References
Keywords
Biological Nitrogen Fixation; Effective Nodules; Economic Feasibility and Strain.
Introduction
Common bean (Phaseolus Vulgaris L.) is one of the important pulse
crops that play a vital role in human diet and consumed in Sub
Saharan Africa, including Ethiopia. It is lowland pulses and best
adapted in areas with a warm temperature having mean air temperature
between 18 and 24°C for its production. Common bean
adds not only diversity to production systems on resource poor
farmer's field; but also it contributes to the stability of farming
systems in Ethiopia [6]. In the study area the average productivity
is 1579 kg ha-1 which is lower than the national and attainable yield
(2500 to 3000 kg ha1) under good management conditions [9].
There are numbers of limiting factors contribute to low productivity
of common bean such as lack of improved varieties,
poor agronomic practices, low soil fertility management and inadequate
fertilizer application rate and type [4]. The main causes
of low productivity at farmer fields are a poor technology level,
utilization of low agricultural input and cropping in low fertility
soils [7]. The percentage of biological nitrogen fixation of the
N assimilation in common bean is lower as compared to other
legumes being 40 50% compared to 75% with fababeans (Vicia
faba), 70% with peas (Pisumsativum) and up to 95% with lupines
[3, 11]. Hence, it is characterized with poor capacity to fix atmospheric
nitrogen.
In Wolaita zone low NPS fertilizer usage and lack of adequate
information on the use of Bio-Fertilizer inoculants are the major
yield limiting factors for common bean production. Bio-Fertilizer
inoculation significantly improved nodule number perplant as
compared with un inoculated treatment; this is because of inoculated
bacteria strain had good nodulation inducing capacity overthe native soil [17]. Inoculation of Bio-Fertilizer strain (B
129) significantly increased hundred seed weight (56.2 g) and
grainyield (24161. Kg ha-1)[3]. To solve above problem, the research
was conducted with objective of determining the optimum
and economically feasible rate of bio-fertilizer and NPS fertilizer
for grain yield and nodulation of common bean in study area.
Material and Methods
Description of Study Area
The experiment was conducted in 2020/21, during the main rainy
cropping season at Farawochakebele which is located in Southern
Ethiopia about 325 km from the capital Addis Ababa. It is about
55 km away from Zonal town, Sodo towards west. Geographical
it was located at 7°8'31'' N latitude, 37°34' 85'' E longitude
and analtitude of 1542 meter above sea level. It receives mean
annual rainfall of 500-800 mm with annual average temperature
of 26.4°C. The monthly total rainfall and average maximum temperature
at the experimental area was 491.2mm and 25.3°C respectively
[18].
Experimental Materials
An improved variety of common bean (Nassir) was used as test
crop for the study. It was released from Melkasa agricultural Research
in 2003 adapted to low and mid altitude areas. It is semi
climbing, seeding rate of 90 100 Kg ha-1, days flowering 40 55,
mostly used for domestic consumption, takes about 86–88 days
to physiological maturity and has dark-red seed coat pigmentation
(Walelign, 2015). Blended NPS (19% N, 38% P2O5 and 7% S) and
Bio-Fertilizer (HB129) were used as source of fertilizer materials.
Treatments, Design and Experimental Procedures
The treatments were consisted of four rates of blended NPS fertilizer
(0, 50, 100, and 150kg ha-1) and four rates of Bio-fertilizer
strains (0, 250, 500, and 750 gha-1) arranged in a randomized complete
block design (RCBD) with three replications. Planting materials
and bio-fertilizer were prepared and the seed was soaked to
20-30c° on sun boiled water. After that 2 to 3 tea spoons of sugar
was added to the water in order to sticking purpose. Seed inoculation
was done under shade in the field to avoid bacterial cell
death by sun. Inoculated seed was allowed weir-drying for a few
minutes before sown, then added bio-fertilizer to the seed and
thoroughly mixed with seed. After sowing, the seed was immediately
covered with moist soil to avoid bio-fertilizer cell death from
desiccation. The size of each plot was 2.40m by 1.60m (3.84m2),
and the spacing between plots and replication was 0.6m and 1m
respectively. The plant spacing was 40cm between rows and10cm
between plants.
Agronomic Practices
All cultural practices were applied in according to the recommendation
of the area. Land was prepared on the onset of May. The
experimental field was ploughed by oxen three times before planting.
The number of rows marked in each plot according to the
spacing proposed. Hand weeding were done 3 and 4 weeks after
sowing. Harvesting was taken place when pods turn to grayish
red.
Data Collection and Measurements
Phenological and Growth Parameters: Days to flowerings was
measured by counting the number of days from the date of sowing
to the date on which at least 50% of the plants have flower.
Days to physiological maturity was taken as the number of days
from planting to the period when 90% of the plants in a plot
show change in the foliage and pod color and seed hardening.
Plant height was measured from eight randomly selected plants at
physiological maturity from the base of the plant to the top of the
main shoot. Numbers of primary branches counted by branches
emerge directly from the main shoot fromeight randomly selected
plants at physiological maturity. Number of total nodules per
plant and number of effective nodules per plant was measured
after 50 days of sowing from five plants plot-1 by destructive sampling
method.
Yield and Yield Components: Number of pods per plant was
counted from eight randomly selected plants from the net plot
area at harvest. Numbers of seeds per pod were taken by counting
the number of seeds from five pods from each of eight plants
at harvest. Hundred seed weight was determined by weighing
100 randomly selected dry seeds from the harvested net plot using
a sensitive balance and the weight was adjusted to 10% seed
moisture content. Total above ground biomass was determined by
weighing above-ground shoot with pods, stem, and foliage from
net plot area at physiological maturity. Grain yield was measured
by weighing air-dried seeds of the net plot area and adjusted at
10% seed moisture content. Harvest index is the proportion of
grain yield to biological yield.
Statistical Data Analysis
Data collected from experimental plots was summarized using
Microsoft excel. The pooled data was subjected to analysis of
variance (ANOVA) according to the Generalized Linear Model
(GLM) of Genstat 18th software (GenStat, 2016) [15]. Significance
differences between the treatment means were separated
and compared using the least significance difference (LSD) test
ata 5% level of significance.
Results and Discussion
Phenological Parameters of Common Bean
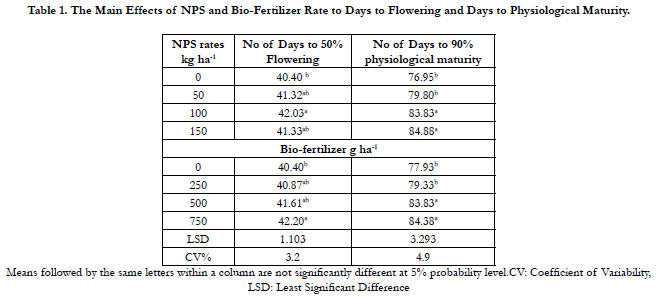
Days to Flowering: The analysis of variance showed that number
of days to 50% flowering was significantly (P< 0.05) affected
by the main effects of NPS and bio-fertilizer application. Increasing
NPS rate from control (40.40) to 100 kg NPS ha-1(42.03)
increased the number of days required to reach 50% flowering
(Table 1). The increased rates of NPS supply might be attributed
to the prolonged vegetative growth due to combined application
of N, P and S. Tewari and Singh (2000) reported that common
bean crop supplied with nitrogen (160 kg N ha 1) required significantly
more number of days to reach the growth stage of 50%
flowering. The result was also in accordance with that of Nebret
and Nigussie (2017) [23] who reported when the nitrogen supply
was increased from 0 to 46 kg N ha1, the days to flowering was
prolonged significantly in common bean. Likewise, Habtamu et
al. (2017) [17] reported that, significantly longest days (45.86) to flowering due to application of 46 kg ha 1 of P2O5 and 41 kg
ha-1of N.
Increasing bio-fertilizer rate from 0 kg ha1 to 750 kg ha 1 increased
the number of days required to reach 50% flowering from 40.40
days to 42.20 days (Table 1). The possible reason for delayed flowering
with the bio-fertilizer might be due to the fact that inoculation
enhanced N fixation and thereby increasing N uptake by
plants contributed to improved vegetative growth of common
bean there by delayed flowering.
Days to Physiological Maturity: Days to physiological maturity
was significantly (P<0.05) affected by the main effects of NPS
andbio-fertilizerrate. Increasing NPS ratefrom 0 kg ha1 to 150 kg
ha1 increased the number of days required to reach physiological
maturity from 76.95 to 84.88 days (Table 1). Also increasing biofertilizer
application rate from 0 to 750g ha1 increased the number
of days required to reach physiological maturity from 77.93 to
84.38 days (Table1). This is in line with the result of Nebret and
Nigussie (2017) [23] who reportedthat increase in N application
rate from 0 to 46 kg N ha1 led to a significant increase in the number
of days required to reach physiological maturity from 87.9 to
89.9 days.
Growth Parameters of Common Bean
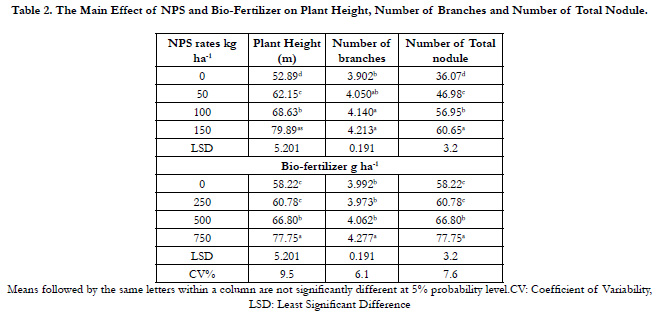
Plant Height: Analysis of variance showed that interaction effect
of NPS rate with bio-fertilizer were significantly (P<0.05)
affected on plant height (Table 2). The highest plant height
(79.89cm) and the lowest plant height (52.89cm) were observed at
NPS rate of control and 150 kg ha-1 respectively. Also the highest
plant height (77.75 cm) was observed at the rate of Bio-Fertilizer
(750 g ha1) and the lowest plant height was observed on control
(58.22cm) (Table 2). The response of common bean to combined
application of NPS with bio-fertilizer might be contributed the
increased availability of nitrogen in the soil for uptake by plant
roots, which may have sufficiently enhanced vegetative growth
through increasing cell division and elongation. This result was in
line with Nebret and Nigussie (2017) [23] who reported that, increasing
N level from 0 kg ha-1 to 23kg ha-1 increased plant height
of common bean at both Hirna and Haramaya. The promotion
effect of high phosphorus in NPS fertilizer level and balanced
NPS supply on plant height may be due to better development of
the root system and nutrient absorption [19].
Number of Branches per Plant: The main effects of bio-fertilize
application and NPS rate were significant (P<0.05) effect on
the number of primary branches per plant. The highest number
of branches (4.213) was observed at 150 kg NPS ha1 while the
lowest number (3.902) was at no application of NPS (Table 2).
The possible reason for the highest number of primary branches
per plant at 150 kg NPS ha-1 might be due to that legumes require P for optimal symbiotic performance and there was close relationship
between P level and symbiotic mechanism in legumes. The
highest number of branches(4.277) was observed at rate of 750 g
ha-1 Bio-fertilizer while the lowest number of branch (3.992) was
obtained from control.
The increment in number of primary branches per plant might
be due to the importance of P in NPS fertilizer for cell division
activity, leading to the increase of plant height and number of
branches and consequently increased the plant dry weight. Sulfur
in NPS is important for growth and physiological functioning,
promoting nodule formation in legumes, chlorophyll formationand
formation of nitrogenase enzymes. Meseret and Amin
(2014) [21] reported the highest number of branches per plant
(5.67) was obtained at application rate of 20 kg P2O5 ha1. Likewise,
Habtamuet, al. (2017) [17] reported the maximum number
of primary branches per plant (6.6) was obtained due to application
of recommended rate of NPS fertilizer (46 kg ha 1 P2O5 and
41 kg ha 1 N). Moreover,inoculation produced higher number
of primary branches (4.22) than control. This might be due to
higher vegetative growth of the plants under higher N by BNF
availability. Mfilingeet al. (2014) [22] reported that inoculation of
chickpea with Rhizobium in field and in the glass house significantly
increased number of primary branches per plant. Similarly,
Ahmed et al., (2010) obtained positive and significant effects of
inoculation and phosphorus fertilization on number of branches
of chickpea.
Number of Total Nodule: The main effect of bio-fertilizer
and NPS rate was significant (P<0.05) effect on total and effective
numbers of nodules per plant. The highest number of total
nodules (60.65) was obtained at 150 kg ha-1 NPS rate while the
lowest number (36.07) was at no application of NPS. The highest
number of total nodules (77.75) was obtained at Bio-fertilizer
application rate of 750 g ha1 while, the lowest number of nodule
(58.22) was obtained at control (table 2). Bio-Fertilizer application
resulted in increasednumber of nodules per plant compared to
unapplied treatment which could be due to the fact that fertilized
bacteria strain had good application inducing capacity over the
native soil bio fertilized population, low native Rhizobium population
in the soil, less competitive native Rhizobium against the
inoculated. In line with this result, Habtamu et al. (2017) [17] reported
the highest number of nodules per plant (15.3) for Nasir.
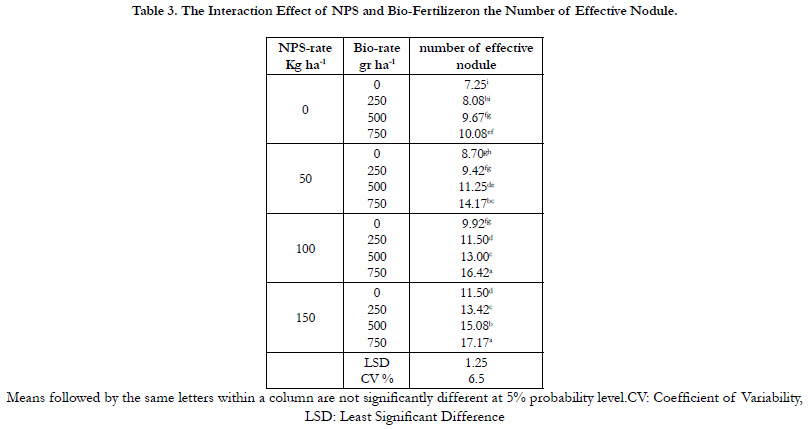
Number of Effective Nodule: The interaction effects of biofertilizer
and NPS rate were significant (P<0.05) on effective
numbers of nodules per plant The highest number of effective
nodules (17.17) were observed at 150 kg ha1 NPS and 750 gr ha
1 bio fertilizer while, the lowest number (7.25) were observed at
control (table 3). Bio-fertilizer application resulted in increased
number of nodules per plant compared to un inoculated treatment
whichcould be due to the fact that inoculated bacteria strain
had good nodulation inducing capacity over the native soil rhizobium
population, low native rhizobium population in the soil, less
competitive native Rhizobium against the inoculated. Mehrpouyan
(2011) [20] also reported that significant increase in nodule
number in common beancultivars when inoculatedwith rhizobium
leguminosarum strain Rb 117. Likewise, Fatima et al., (2007)
[14] reported in soybean that nodule formation was more sensitive
to phosphorus deficiency than plant growth and application
of phosphorus improved nodulation parameters when compared
with no phosphorous fertilizer.
Yield Components and Yield of Common Bean
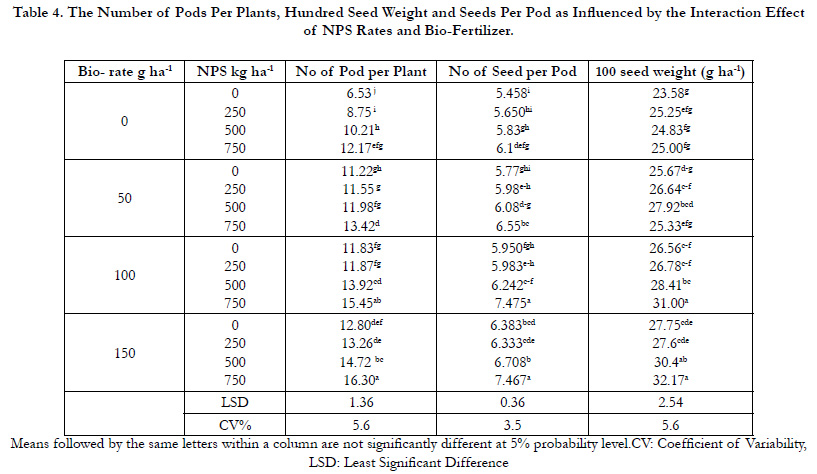
Number of Pods per Plant: The analysis of variance showed
that the interaction effect NPS and Bio-fertilizer rate were significant
(P<0.05) on numbers of pods per plant. Highest number of
number of pods (16.30) were observed at 150 kg ha-1 NPS and
750g ha-1 of Bio-fertilizer while, the lowest number (6.53) were
observed at controlled (Table 3). Increased number of pods with
NPS application might be due to optimum availability and utilization
of N, P and S for reproductive development and pod formation
in legumes. Application of nitrogen also increases panicles or
heads in cereals and number of pods in legumes [13]. Zafalet al.,
(2003)[27] reported thatapplication of P stimulate the plants to produce more pods per plant as P strongly encourages flowering
and podding. Similarly, Meseret and Amin (2014) [21] obtained
higher number of pods per plant (48.16) of common bean with
application of P(20 kg P ha1). Amare et al. (2014)[4] also reported
that, application of P at 40 kg P2O5 ha1 produced the maximum
significant number ofpods per plant (19.01). Pod number per
plant was significantly higher in seed applied plants (13.68) compared
to unapplied plants which might indicate the effectiveness
of applicants over native soil Rhizobium.
Number of Seeds per Pod: The analysis of variance showed
that common bean number of seeds per pod was significantly
(P<0.05) affected by the interaction effect of NPS and Bio-fertilizer.
The highest number of seed per pods at interaction effects
were (7.475) observed at 150 kg ha-1 and 750gr ha-1 while, the
lowest number (5.458) were observed at controlled (Table 4). The
results showed that the increment of seeds per pod with increasing
NPS fertilizer application up to optimum level might be due
to adequate supply of nutrients in NPS fertilizer for nodule formation,
protein synthesis, fruiting and seed formation. The result
was similar with Meseret and Amin (2014) [21] who reported the
highest number of seeds per pod (5.85) was obtained at 20 kg ha-1
phosphorus rate. Similarly, Habtamu et al., (2017) [17] reported
relatively highest number of seeds per pod was obtained with the
application of 46 kg ha-1 of P2O5 and 41 kg ha-1 of nitrogen.
Hundred Seed Weight: The analysis of variance showed that
the interaction effect NPS and bio-fertilizer were significant
(P<0.05) on numbers of hundred seed weight. The highest number
of hundred seed weight were (32.17) observed at 150 kg ha-1
NPS and 750gr ha-1 bio-fertilizer rates while, the lowest number
(23.58) were observed at controlled (Table 4). The possible reason
for this might be that nitrogen improves grain or seed weights in
crop plants and reduces grain sterility [13]. Similarly, Amare et al.
(2014) [4] reported that the increasing doses of phosphorus from
the control to 40 kg ha1 P2O5 resulted in significant increment in
100 seedweight. Inaddition, Abdulkadir et al., (2014) [1]reported
that phosphorous fertilized crop when compared with the control
produced more pods per plant which were better filled with heavier
seeds and this translated to higher grain yield. Nebret (2017)
[23] reported that increasing sulphur ratefrom 0 kg ha1 to 20 kg
ha1 increased 100 seed weight from 35.7 g to 36.8 g.
Rhizobiu minoculated treatments achieved significant increases
in hundred seed weight (28.76 g) compared to un-inoculated
(26.57g) treatments (Table 4) which could be due to the symbiotic
relationship between Rhizobium and common bean plants,
which results infixation of at mospheric nitrogen into the roots
and translocation of amino acids to the shoots, thus leading to
increased seed size. This result was in agreement with the study
by Asad et.al.(2004) [5] where weight of100 seeds increased significantly
in the common bean inoculated with carrier based as
well as pure cultures of rhizobium than thatof non-inoculated
treatment.
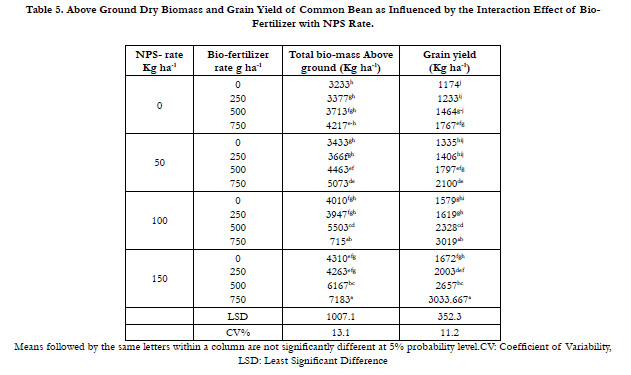
Above Ground Dry Biomass Yield: In this study the biomass
yield of common beam was significantly (P<0.05) affected by
the interaction effect of bio-fertilizer and NPS rate. The highest
above ground dry biomass (7183kg ha-1) obtained at 150 NPS kg
ha-1and 750g ha-1 bio-fertilizer, while the lowest (3233 kg ha-1)
was observed at control (Table 5). This increment in dry matter
yield with application of NPS fertilizer might be due to the
adequate supply of N, P and S which increased the number of
branches per plant, leaf area, photosynthetic area and number of
pods per plant there by dry matter accumulation. Sulphur may enhance
cell multiplication, elongation, expansion and chlorophyll
bio synthesis and increased the assimilate production with grain
yield in cereals and legumes [13]. In agreement with this result,
Veeresh (2003) reported that the dry matter production of common
bean increased significantly with the application of different levels of N and P fertilizers.Likewise, Gifoleet al., (2011) [16]
reported the highest total biomass (4597 kg ha 1) from the treatment
with the application of 40 kg Pha1.
Grain Yield: In this study the grain yield of common beam was
significantly (P<0.05) affected by the interaction effect of biofertilizer
and NPS rate. The highest grain yield (3033.7 kg ha-1)
obtained at 150 NPS kg ha-1and 750g ha-1 bio-fertilizer, while
the lowest (1174kg ha-1) was observed at control (Table 5). Abera
and Buraka (2016) [3] also reported that the maximum seed yield
(2160 kg ha-1) of common bean was obtained from the application
of the 23 kg ha-1 N rate. Amare et al., (2014) also reported
the maximum seed yield (2326 kg ha-1) of common bean was obtained
with the applicationof P2O5 at rate of 20 kg ha-1. Similarly,
Gifoleet al. (2011) [16] reported that, the highest grain yield (2547
kg ha 1) of common bean was obtained from the application of 40
kg P ha 1. Nyokiand Ndakidemi (2014) reported that bio fertilizer
inoculation significantly improved the yield and yield components
of legumes such as number of pods per plant, number of seeds
per pod, number of seeds per plant, 100 seed weight, and grain
yield relative tocontrol. Similarly, Abebe and Tolera (2014) [2] reported
that inoculation significantly increased grain yield in faba
bean. Abera and Buraka (2016) [3] also reported the maximum
seed yield (2416.3 kg ha-1) was obtained from seed inoculation
with bio-fertilizer strain.
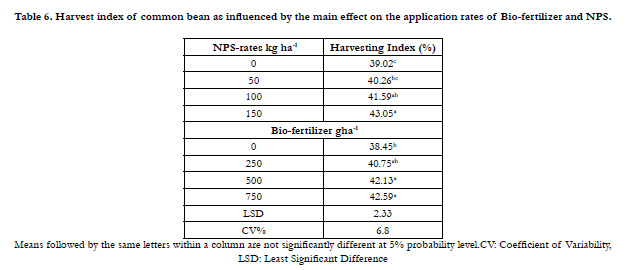
Harvest Index (HI): The analysis of variance indicated that the
main effect of bio-fertilizer and NPS rate was significant (p<0.05) effect on harvest index of common bean. The highest HI (43.05
% and 42.59%) was observed from the application of 150 kg ha
1 NPS and 750 g ha1 bio fertilizer rate respectively (Table 6). The
lowest HI (39.02%) and 38.45%) was observed from the control
(Table 6). Birhanu (2006) reported that there was a significant
increase of harvest index with the application of P on common
bean. Daniel et al. (2012) [10] reported that the highest HI
(43.69%) was observed from the application of NPS rate of 100
kg ha 1 and with Rhizobium inoculation (39.67%).
Table 1. The Main Effects of NPS and Bio-Fertilizer Rate to Days to Flowering and Days to Physiological Maturity.
Table 2. The Main Effect of NPS and Bio-Fertilizer on Plant Height, Number of Branches and Number of Total Nodule..
Table 4. The Number of Pods Per Plants, Hundred Seed Weight and Seeds Per Pod as Influenced by the Interaction Effect of NPS Rates and Bio-Fertilizer.
Table 5. Above Ground Dry Biomass and Grain Yield of Common Bean as Influenced by the Interaction Effect of Bio- Fertilizer with NPS Rate.
Table 6. Harvest index of common bean as influenced by the main effect on the application rates of Bio-fertilizer and NPS.
Summary, Conclusion And Recommendation
Summary and Conclusion: Low soil fertility status and reduced
biological nitrogen fixation are some of the major constraints
limiting common bean yield in the study area. Ensuring a well
balanced supply of blended NPS fertilizer and Bio-Fertilizer application
to the crop may result in higher grain yield. Limited research
has been done on the effective rate of blended NPS and
Bio-fertilizer on yield and yield components of common bean.
Therefore, field experiment was conducted to evaluate the effective
ratesof blended NPS and bio-fertilizer application on yield,
yield components and economic feasibility of common bean production.
Based on the results of study, it can be concluded that
the rate of 750 g ha 1 of bio-fertilizer with 100 kg ha1 of NPS
found appropriate to be used. Therefore, combined application
of bio-fertilizer (750 g ha1) and NPS (150 kg ha1) rates, were significantly
affected the number of total nodules, number of pods,
number of seeds, hundred seed weight and grain yields of common
bean. According to economic analysis the highest net return
was obtained from 100 kg ha1 of NPS and 750 g ha1 of Bio-
Fertilizer application. Also, the maximum marginal rate of returns
was obtained from the rate of NPS and Bio-Fertilizer application
at 100 kg ha1 with 750 g ha1.
Recommendation: Based on the economic analysis,statistical
analysis and marginal rate of returns results, it can berecommended
that, the combined application of 100 kg ha1 NPS and 750 g
ha1 bio-fertilizer inoculations were appropriate recommendation
for superior production of common bean in the study area. However,
the result should be repeated under different agro ecologies
in order to reach a conclusive recommendation.
References
- Abdulkadir M, Kevin M, Patrick AN.Effects of Rhizobium inoculation and supplementation with P and K, on growth, leaf chlorophyll content and nitrogen fixation of bush bean varieties. Am J Res Commun. 2014;2(10):49- 87.
- Abera T, Abebe Z. Effects of fertilizer rate, rhizobium inoculation and lime rate on seed yield of faba bean at Horro and Gedo highlands. J Agric Res. 2014;2(4):61-8.
- Habete A, Buraka T. Effect of Rhizobium inoculation and nitrogen fertilization on nodulation and yield response of common bean (Phaseolusvulgaries L.) at Boloso Sore, Southern Ethiopia. J BiolAgricHealt. 2016;6(13):72-5.
- Girma A, Demelash A, Ayele T. The Response of Haricot bean varieties to different rates of Phosphorus at Arbaminch, southern Ethiopia. ARPN J AgricBiol Sci. 2014;9(10):344-50.
- Asad SA, Bano A, Farooq M, Aslam M, Afzal A. Comparative study of the effects of biofertilizers on nodulation and yield characteristics of mung bean (Phaseolus vulgaris L.). Int J Agric Biol. 2004;6(5):837-43.
- Asfaw A, Blair MW. Quantification of drought tolerance in Ethiopian common bean varieties. Agric Sci. 2014 Jan 27;5:124-139.
- Beebe SE, Rao IM, Blair MW, Acosta-Gallegos JA. Phenotyping common beans for adaptation to drought. Front Physiol. 2013 Mar 6;4:35. PubMed PMID: 23507928.
- Birhan Abdulkadir. Response of haricot bean to nitrogen, phosphorus and inoculation of Rhizobium leguminosarum on yield and yield components at Melkassa”, M.Sc. Thesis, University of Hawassa, Hawassa College of Agriculture, Ethiopia. 2006.
- CSA (Central Statistical Agency). Agricultural Sample Survey 2020/2021. Area and production of major crops. V1 Statistical Bulletin. 590. Addis Ababa, Ethiopia. 2021.
- Tadesse D, Alem T, Wossen T, Sintayehu A. Evaluation of improved varieties of haricot bean in West Belessa, Northwest Ethiopia.IntJSci Res. 2014;3(12):2756-2759.
- Dereje S, Setegn G. Response of common bean cultivars to phosphorus application in Boloso Sore and SodoZuria Districts, Southern Ethiopia. EAJS. 2015;9(1):49-60.
- EPPA (Ethiopian Pulses Profile Agency). Ethiopian export promotion agency product development and market research directorate Ethiopian, Addis Ababa. 2004.
- Fageria NK, Baligar VC, Jone CA. Growth and mineral nutrition of field crops. 3rded. Boca Raton, CRC Press. 586p. 2011.
- Fatima Z, Zia M, Chaudhary MF. Interactive effect of Rhizobium strains and P on soybean yield, nitrogen fixation and soil fertility. Pak J Bot. 2007 Feb 1;39(1):255.
- GenStat. GenStat Procedure Library Release. 18th edition64 bit. International Ltd. 2016.
- Gidago G, Beyene S, Worku W, Sodo E. The response of haricot bean (Phaseolus vulgaris L.) to phosphorus application on Ultisols at Areka, Southern Ethiopia. Journal of Biology, Agriculture and Healthcare. 2011; 1(3):38-49.
- Assefa H, Amsalu B, Tana T. Response of common Bean (Pharsalus vulgaris L.) cultivars to combined application of rhizobium and NP fertilizer at Melkassa, central Ethiopia. IntJ Plant Soil Sci. 2017;14(1):1-10.
- HNMA (Hawassa National Meteorology Agency). Total rain fall and mean monthly temperature report. Hawassa, Ethiopia. (Unpublished). 2016.
- Hussain N, Khan AZ, Akbar H, Akhtar S. Growth factors and yield of maize as influenced by phosphorus and potash fertilization. SJA. 2006;22(4):579- 583.
- Mehrpouyan, M. Nitrogen fixation efficiency in native strains compared with non-native strains of Rhizobium leguminosarum.IntConfEngEnviron- Sci. 2011; 8: 216–219.
- Turuko M, Mohammed A. Effect of different phosphorus fertilizer rates on growth, dry matter yield and yield components of common bean (Phaseolus vulgaris L.). World J Agric Res. 2014; 2(3): 88-92.
- Mfilinge A, Mtei K, Ndakidemi PA. Effects of Rhizobium inoculation and supplementation with P and K, on growth, leaf chlorophyll content and nitrogen fixation of bush bean varieties. AmJ ResCommun. 2014; 2(10): 49-87.
- Tadesse N, Dechassa N. Effect of nitrogen and sulphur application on yield components and yield of common bean (Phaseolus vulgaris L.) in Eastern Ethiopia. Acad Res JAgricSci Res. 2017; 5: 77-89.
- Nyoki D, Ndakidemi PA. Effects of Brady Rhizobium japonica inoculation and supplementation with phosphorus on macronutrients uptake in cowpea (Vigna UNguiculata L.) Walp. American Journal of Plant Sciences. 2014; 5: 442-451.
- Tewari JK, Singh SS. Effect of nitrogen and phosphorus on growth and seed yield of French bean (Phaseolus vulgaris L.). J Veg Sci. 2000;27(2):172-5.
- Yoseph T. Effects of Rhizobium Inoculants and P Fertilization on Growth, yield and Yield Components of Haricot Bean (Phaseolus vulgaris L.) at UmbulloWacho Watershed, Southern Ethiopia. Southern Ethiopia, School of plant and Horticultural Sciences, Hawassa University, Hawassa, Ethiopia. 2011.
- Zafar M, Maqsood M, Anser MR, Ali Z. Growth and yield of lentil as affected by phosphorus. Int J AgricBiol. 2003;5(1):98-100.

