Calibration of Phosphorus Fertilizer for Barley (Hordeum vulgare L. ) on Different Soils of Wolaitain the Southern Ethiopia
Mesfin Kassa*
1 Department of Plant Sciences, Wolaita Sodo University, Ethiopia.
*Corresponding Author
Mesfin Kassa,
Medawolabu University, Department of Plant Sciences, Goba, Ethiopia.
E-mail: mesfine2004@gmail.com
Received: August 14, 2021; Accepted: December 27, 2021; Published: January 03, 2022
Citation: Mesfin Kassa. Calibration of Phosphorus Fertilizer for Barley (Hordeum vulgare L.) on Different Soils of Wolaitain the Southern Ethiopia. Int J Plant Sci Agric. 2021;4(4):168-172.
Copyright: Mesfin Kassa�2022. This is an open-access article distributed under the terms of the Creative Commons Attribution License, which permits unrestricted use, distribution and reproduction in any medium, provided the original author and source are credited.
Abstract
Global foodproduction strongly depends on availability of nutrients. Assessment of future global phosphorus (P) fertilizer under different levels of food demand requires a model-based approach. Site specific soil-test based crop response phosphorus fertilizer calibration experiment was conducted in Wolaita zone of the southern Ethiopia on barley during 207/18 cropping seasons with objective to determine phosphorus critical. Phosphorus requirement factor and economical P fertilizer level for barley on major soil type of barley growing area of Wolaita zone. This calibration study was conducted on four sites using four levels of P(0. 22.9, 45.80, and 68.70 kg ha-1) were arranged in a randomized complete block design with three replication, critical level Po determination using C'ate-Nelson diagram method. The critical concentration and requirement factor of Phosphorus on barley in the study area were 8.8 mg kg-1 and 9.17 mg kg-1 respectively. Hence, it could be concluded that the highest grain yield, P requirement factor and P critical obtained could serve in areas where the rainfall distribution and soil type is similar with study district where this experiment was conducted. Further studies should be done on phosphorous use efficiency and other related plant nutrition parameters.
2.Introduction
3.Materials and Methods
4.Results and Discussion
5.Conclusion
6.References
Keywords
Barley; Cate-Nelson Method; Critical P; Requirement Factor; Soil Test.
Introduction
Phosphorus (P) is an essential element for all plants. Plants will
grow slowly with low levels of P in the soil; however, for agricultural
production purposes, the soil should provide a sufficient
concentration of P for optimum plant growth [12]. Phosphorus
is among the most important limiting nutrients in most soils of
Sub-Saharan Africa [14]. This could be due to low P content in
the parent material from which the soils were derived, and due to
depletion of soil reserve P through intensive cultivation, without
adequate external replenishment [8, 3, 4]. Similar to the Ethiopian
soils are generally low in P [3, 4].
Fertilizer use trend of the country had been focused mainly on
the use and application of nitrogen and phosphorous fertilizers in
the form of di-ammonium phosphate (18-46-0) and urea (46-0-0)
for almost all cultivated crops and were applied as blanket recommendation
[1, 17]. The blanket recommendations are, regardless
of considering the physical and chemical properties of the soil as
well as does not taken to account climatic condition and available
nutrient present in the soil [16, 2].
In southern Ethiopia, most of the farmers usually apply P fertilizers
without judging the P status of the soils for which calibrationP
study have significant role to play Fluvisols, Cambisols, Arenosols,
Vertisols and Nitisols are the common types of soils in the
southern Ethiopia is low in P [20]. As indicated by Mesfin et al.
(2019) [11], there are different blanket fertilizer recommendations
for various soil types of Wolaita zone of the southern Ethiopia at
different locations. Phosphorus fertilization and its management
is a means of improving soil P for crop production in the cropping
system. Better management of P fertilizer can be achieved
by studying the calibration P behavior of the soil. Calibration P
helps in predicting the fertilizer P needed to replenish the soil
solution P to a level optimum for a particular crop [13]. However,
currently the Ministry of Agriculture and Agricultural Transformation
Agency advanced set 100 kgNPS ha-1 and 100 kg ha-1 of
urea [9]. The blanket recommendation leads to excess or low application
of chemical fertilizers, which aggravates stunted growth
of plants due to toxicity or deficiency of the essential elements.
However, for many years no studies have been conducted on sitespecific
fertilizer recommendation rate. But, since 2014 Ethiopian
soil information system have been started calibration studies for some cereal crops and developed some critical concentrations and
requirement factors of phosphorous fertilizer recommendation
[9]. Therefore, this study aimed to establish soil test based phosphorus
recommendation (Pc and Pf) for barley in the Districts.
Material and Methods
Description of experimental sites
The study was conducted in site 1 (SodoZuria), (site 2) Damot
Gale,( site 3) Damot Sore and ( site 4) Boloso Sore distracts,
Wolaita zone, Southern Nations�, Nationalities and Peoples�
Regional State (SNNPRS) of Ethiopia (Figure.1). The sites
are located between 037�35'30" - 037�58'36"E and 06�57'20" -
07�04'31"N with altitudinal range of 1895 to 2950 m above sea
level. The zone has three agro-ecological zones,56% of the area
is mid land; 35 % of the area is low land; and the rest 9% of the
area is covered by high land. The area has a bimodal rainfall pattern
and about 31 and 39% fall during Autumn (March- May) and
Summer (June- August) seasons, respectively. The mean average
monthly temperature for the last nine years is 20�C (NMA, 2017).
Site Selection
For selecting representative experimental locations, composite soil
samples were collected from 9 farmers' fields in each district. A
total of 36 samples were collected from 0-20cm depth using soil
augers and twelve composites were made for each district within
the four locations, where barley (HB1307) is a dominant crop.
Based on available soil P values determined by Bray II method [5],
fields were categorized into low by Pushparajah (1997) [19] who
classified the range of available P < 11, 11-20, 20-30 and > 30 mg
kg-1 as low, medium, high and very high, respectively.
Treatments and Experimental Design
Phosphorus response experiments with barley were conducted on
four sites in the Wolaita zone of the southern Ethiopian during
the 2016 cropping seasons. The experiment was laid out in randomized
complete block design with replicated three times. The
treatments, comprising four levels of P fertilizer (0, 22.9, 45.8
and 68.7 kg P2O5 ha-1), were arranged in a randomized complete
block design (RCBD) with three replication. The size of each plot
will be 3 m x 3 m, space between plots and blocks were 1m and
1.5 m, respectively. All doses of P (triple superphosphate) were
applied as basal dressing at sowing.
Soil Sampling and Analysis
Composite surface soil samples (0-20cm depth) were collected
from each experimental site before planting to determine initial
soil pH (H2O) and available P (Bray II method). Similarly, after
planting, intensive composite soil samples were collected from
each experimental plot to determine available Pwas determined
using [5], Particle size distribution was determined by hydrometer
method [7], the pH of the soil was measured in the supernatant
suspension of a 1: 2.5 soil to water ratio using a pH meter [18].
Soil organic carbon content was determined by the wet digestion
method as described by [21]. Total nitrogen was determined using
Kjeldhal method [10]. Exchangeable basic cations and cation
exchange capacity of the soils were determined by using 1MNH
4OAc (pH.7) method [6]. Exchangeable Ca and Mg in the leachate
was determined using atomic absorption spectrophotometer
(AAS), whereas K and Na were measured by using a flame
photometer.
Determination of Critical P Concentrations
For the determination of critical values of P, the Cate-Nelson
diagram method was used (Nelson and Anderson, 1977). Where
after planting analyzed soil available phosphorus values were put
on the X-axis and the relative maize grain yield values (%) on
the Y-axis.At eventually, the diagram of the results is divided into
four quadrants that maximize the number of points in the positive
quadrants and minimize the number of points in the negative
quadrants. The observations in the upper left quadrant overestimate
the fertilizer P requirement while the observations in the
lower right quadrant underestimate the fertilizer requirement. The
optimum is indicated by the point where the vertical line crosses
the x-axis and critical P value was determined using relative grain
yield against the soil test values at different rates of applied phosphorous
fertilizer for a given of nutrient rate.
Determination of P Requirement Factor
This factor enables one to determine the quantity of P required
per hectare to raise the soil test by 1 mg kg-1, and to determine the
amount of fertilizer required per ha to bring the level of available
P above the critical level. It was calculated using available P values
in samples collected from unfertilized and fertilized plots after
30 days starting from sowing date. Finally, the P requirement factor
was obtained using the available soil test P values of the soil
samples that received different P fertilizer rates. Pc and Pf was
calculated as follows rate of P2O5 kgha-1 fertilizer to be applied
= (Pc -Po) x Pf
Where:
Pc = critical P concentration
Po = initial P values for the site
Pf = P-requirement facto
Partial budget analysis
The cost of 100 kg urea (1260 birr) and TPS (1800 birr) used for
the benefit analysis. Benefit cost optimum was calculated by gross
(net) revenue (NR) divided by total variable cost (TVC) of the
successive net revenue and total variable cost levels (CIMMYT,
1988). Labor costs were calculated by assuming 50 ETB per day
per person and revenue was calculated by assuming 6 ETB kg-1 of
barley grain yield.
Results and Discussion
Critical Phosphorus Concentration (Pc)
Critical P (Pc) value was determined following the Cate-Nelson
graphical method where soil P values were put on the X-axis and
the relative yield values on the Y-axis. According to the Cate- Nelson
method, the critical levels of Bray- II P in the top 20 cm of
soil about 8.8 mg kg-1 at values of greater than or equal to 8.8 mg
kg-1, the crop achieved about 80 % of its maximal yield in the
absence of P fertilizer application (Figure 2). This implies that P
fertilizer application could be recommended for a build-up of the
soil P to this critical value, or maintaining the soil P at this level.
Increasing P beyond this level, the cost of additional P fertilizer
to produce extra yield would likely be greater than the value of
additional yield. Thus, in soils with available P status below 8.8
mg kg-1, yield of barley could show a significant response to applications
of P fertilizers. Whereas in areas with available P status
greater than 8.8 mg kg-1, the P concentration in the soil exceeds
crop needs (68.7P2O5) so that further addition of P fertilizer may
not outcome increase.in a profitable value.
Phosphorus requirement factor (Pf)
Phosphorus requirement enables to determine the quantity of P
required per ha to raise the soil test by 1 mg kg-1, and to determine
the amount of fertilizer required per ha to bring the level of available
P above the critical level. The Pf computed from the difference
between available P values in soil samples collected from
plots, which were received 0, 22.9, 45.8 and 68.7 kg P2O5 ha-1. As
indicates in the below table 1 and the average value of P- requirement
factor was 9.17 mg kg-1.
Phosphorus fertilizer recommendation
When a sufficient amount of data has been generated, such information
could easily be compiled as a guideline to be used by
extension agents for fertilizer recommendations to small holder
farmers based on soil test values. When the soil test value is below
the critical level addition all information is needed on the quantity
of P required elevating the soil P to the required level. This
is the P requirement factor , the amount of P required to raise
the soil test P by 1mg kg-1, computed from the from the difference
between available soil test P values from plots that received
0 � 68.7P2O5 kg P ha-1 (Table 2). Accordingly the calculated table
2 was 0.09178- 11.004 P2O5 kg ha-1 and the overall mean 9.17mg
kg-1of all sites and treatments for the study area of Wolaita zone.
Thus the rate of P fertilizer required per ha can be calculated using
the soil critical P concentration, initial soil P determined for
site 2 and site 4 were not required more than applied rates (Table
3) and the P requirement factor as indicated above in the table 2.
Partial Budget Analysis
The benefit cost associated with different treatments, the partial
budget technique of CIMMT (1988) was applied on grain yields.
The partial budget analysis indicated that treatments resulted in
maximum relative costs (6897.62Birr ha-1), while the highest net
benefit was obtained from 45.80 P2O5kg ha-1, which gave higher
net revenue than farmers� practices fertilizers application. The
dominated treatment (68.70P2O5 kg ha-1) was rejected from further
economic analysis. To identify treatments with the benefit
cost optimum to the farmer�s investment, benefit cost ratio analysis
was performed on non-dominated treatments. The analysis of
gross net return, on the other hand, revealed that the rate of return
per unit cost of production was highest from control (6496.2Birr
ha-1). This showed that it would yield 6 and 50 Ethiopian Birr for
every Birr and day per person invested.Therefore, application of
(45.80P2O5 kg ha-1) is profitable and recommended for farmers
and other areas with similar agro-ecological conditions.
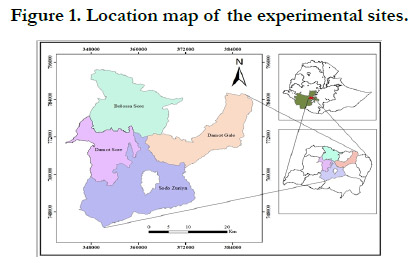

Figure 1. Location map of the experimental sites.


Figure 2. Comparative grain yield influenced by different soil P test.
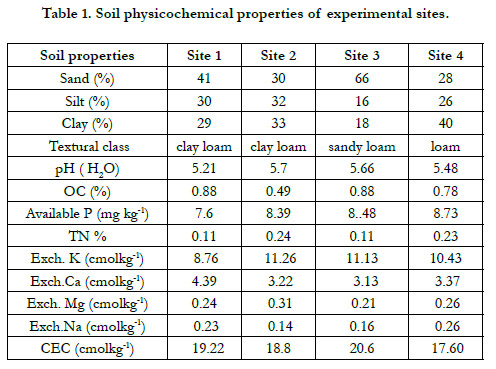

Table 1. Soil physicochemical properties of experimental sites.
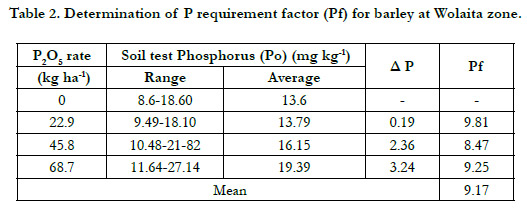
Table 2. Determination of P requirement factor (Pf) for barley at Wolaita zone.
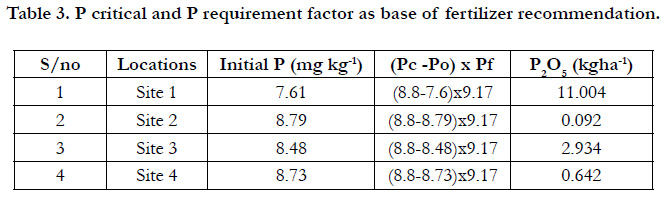
Table 3. P critical and P requirement factor as base of fertilizer recommendation.
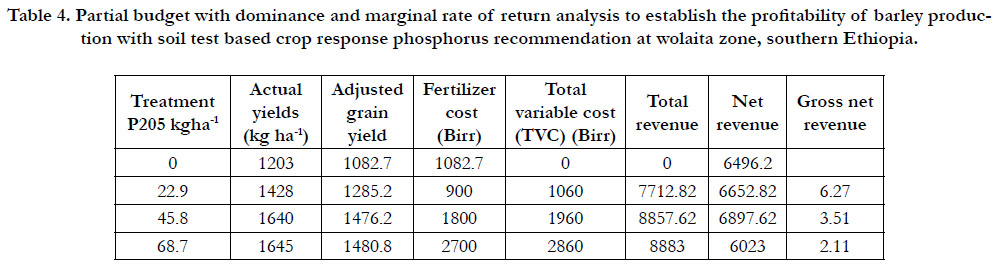
Table 4. Partial budget with dominance and marginal rate of return analysis to establish the profitability of barley production with soil test based crop response phosphorus recommendation at wolaita zone, southern Ethiopia.
Conclusions and Recommendation
Site specific soil test-based crop response fertilizer recommendation
study in WolaitaZone of the southern Ethiopia on barley
resulted in determination of optimum phosphors, P critical and
P requirement for specific area. Accordingly, optimum Prate (0-
68.70 P2O5kg ha-1), critical P concentrations (8.8mg kg-1) and P
requirement factors (9.17) were determined for barley in four district,
which could be extrapolated to similar agro-ecological zones
of the Wolaita Zone Further studies should be done on phosphorous
use efficiency and other related plant nutrition parameters.
References
- Asrat A, Tana T. Response of chickpea (Cicer arietinum L.) varieties to rates of nitrogen and phosphorus fertilizer at Debre Zeit, central Ethiopia. 2013.
- Agricultural Crop Association (ACA). Agriculture crops: Alternatives chickpea. Alternative crop species. 2004; 27-38.
- . Brady C, Weil R. The Nature and Properties of Soils, 13th edition. Person Education Ltd, USA. 2002.
- Fageria K. The use of nutrient in crop plant. Boca Raton, FL: CRC Press. 2009.
- Abebe G. Effect of NP fertilizer and moisture conservation on the yield and yield components of haricot bean (Phaseolus vulgaris L.) in the Semi-arid zones of the Central Rift Valley in Ethiopia. Advances in Environmental Biology. 2009 Sep 1; 3(3): 302-7.
- Gomez KA, Gomez AA. Statistical procedures for agricultural research. John Wiley & Sons; 1984 Feb 17.
- Halvin JL, Beaton JD, Tisdale SL, Nelson WL. Soil fertility and fertilizers: an introduction to nutrient management. Pretice Hall, New Jersey. 2005.
- Johansen C, Sahrawat KL. Strategies for maximizing the efficiency of phosphorus utilization in cropping systems involving chickpea and pigeonpea. 1991; 227-241.
- Khan MB, Asif M, Hussain N, Aziz M. Impact of different levels of phosphorus on growth and yield of mungbean genotypes. Asian Journal of Plant Sciences. 2003; 2(9): 677-679.
- Khan TA, Mazid M. Nutritional significance of sulphur in pulse cropping system. Biology and medicine. 2011; 3(2): 114-33.
- Lemma W, Wassie H, Sheleme B. Response of chickpea (Cicer Arietinum L.) to nitrogen and phosphorus fertilizer S in halaba and taba, Southern Ethiopia. Ethiopian Journal of Natural Resources. 2013; 13(2): 115-28.
- Dadi L, Regassa S, Fikre A, Mitiku D, Gaur PM, Gowda CL, Bantilan MC. Adoption studies on improved chickpea varieties in Ethiopia. 2005.
- Saxena MC, Singh KB. The chickpea. Commonwealth Agricultural Bureaux International; 1987.
- Hazelton P, Murphy B. Interpreting Soil Test Results: What do all the numbers Mean 2nd. Australia: Csiro Publishing. 2007.
- Olsen SR. Estimation of available phosphorus in soils by extraction with sodium bicarbonate. US Department of Agriculture; 1954. 96: 308-12.
- Panwar KS, Singh YP, Singh UV, Misra AS. Response of gram, lentil and field peas to inoculation and levels of nitrogen and phosphorus. Indian Journal of Agronomy. 1977 Jan 1; 22(3): 145-8.
- Rajendran S. Fertilizer responsiveness of chickpeas in India; an analytical review. 1982; 35.
- Rawsthorne S, Hadley P, Summerfield RJ, Roberts EH. Effects of supplemental nitrate and thermal regime on the nitrogen nutrition of chickpea (Cicer arietinum L.). Plant and Soil. 1985 Jun; 83(2): 279-93.
- Rawal DR, Bansal PP. Fertilizer requirement of gram under dry land condition on cultivators fields in Alwar district. Legume Research. 1986; 9: 106-7.
- Saxena MC. Recent advances in chickpea agronomy. InProceedings of the international workshop on chickpea improvement. ICRISAT. 1980 Feb; 28: 89-96.
- Shamsi K, Kobraee S, Haghparast R. Drought stress mitigation using supplemental irrigation in rainfed chickpea (Cicer arietinum L.) varieties in Kermanshah, Iran. African Journal of Biotechnology. 2010; 9(27): 4197-203.
- Statistical Analysis System (SAS). SAS institute version 9.20 Cary, NC, USA. 2008.
- Singh BG, Hiremath SM. Effect of phosphate fertilization on physiological aspects of mungbean. Journal of Maharashtra Agricultural Universities. 1990; 15(2): 176-8.
- Tadesse T, Haque I, Aduayi EA. Soil, plant, water, fertilizer, animal manure & compost analysis manual. 1991.
- Tripathi RS. EFFECT OF APPLICATION OF RHIZOBIUM INOCULUM ON THE YIELD OF GRAM (CICER ARIETINUM L.) VARIETIES IN CHAMBAL COMMANDED AREA OF RAJASTHAN. Science and Culture. 1975; 46 (6): 266 � 269.
- Walley FL, Kyei-Boahen S, Hnatowich G, Stevenson C. Nitrogen and phosphorus fertility management for desi and kabuli chickpea. Canadian Journal of Plant Science. 2005 Jan 1; 85(1): 73-9.
- Zewide I, Mohammed A, Tulu S. Effect of different rates of nitrogen and phosphorus on yield and yield components of potato (Solanum tuberosum L.) at Masha District, Southwestern Ethiopia. International Journal of Soil Science. 2012 Oct 1; 7(4): 146.


