Effects of Training Surface on Physiological Characteristics of Prepubescent Female Volleyball Players
Theos A1,3*, Gortsila E2, Maridaki M2
1 Faculty of Medicine, Department of Community Medicine & Rehabilitation, Sports Medicine Unit, Umeå University, Umeå, Sweden.
2 School of Physical Education & Sport Science, Sport Medicine & Biology of Exercise Section, National & Kapodistrian University of Athens, Athens, Greece.
3 School of Sport Sciences, Umeå University, Umeå, Sweden.
*Corresponding Author
Dr. Apostolos Theos,
Faculty of Medicine, Department of Community Medicine & Rehabilitation,
Sports Medicine Unit, Umeå University, Umeå, 901 87, Sweden.
Tel: +46907866619
E-mail: apostolos.theos@umu.se
Received: August 09, 2017; Accepted: September 18, 2017; Published: September 19, 2017
Citation: Theos A, Gortsila E, Maridaki M. Effects of Training Surface on Physiological Characteristics of Prepubescent Female Volleyball Players. Int J Pediat Health Care Adv. 2017;4(5):48-53. doi: dx.doi.org/10.19070/2572-7354-1700014
Copyright: Theos A© 2017. This is an open-access article distributed under the terms of the Creative Commons Attribution License, which permits unrestricted use, distribution and reproduction in any medium, provided the original author and source are credited.
Abstract
Purpose: The present study investigated the effects of different training surfaces on physiological characteristics of prepubescent female volleyball players.
Method: 45 prepubescent girls (age: 11.1 ± 0.5 years) were separated in groups S (N=15) and H (N=15) that consisted of volleyball players, while group C (N=15) consisted of girls that had no volleyball training experience. Groups S and H participated in a 10-week volleyball training program including sprints, jumps and technical exercises, while group C executed only technical skills exercises. Group S trained on sand surface, while groups H and C trained on hard surface indoors. Aerobic capacity (20m shuttle run), agility (Illinois test), countermovement (CMJ) and squat jump (SJ) as well as 10m sprint test were conducted before, in the middle (5th week) and after the end of the training program for groups S and H. Group C was tested only before and after the training period.
Results: Aerobic capacity, agility, jumping and sprinting ability were significantly (p<0.01) improved in groups S and H even from the 5th week of training. Group S achieved greater improvements than group H in all tested variables.
Conclusion: Training on sand surface seems to promote training adaptations improving the physiological characteristics of prepubescent female volleyball players.
2.Introduction
3.Methods
3.1 Participants
3.2 Procedures
3.3 Statistical Analysis
4.Results
4.1 Aerobic Capacity
4.2. Agility
4.3. Jumping Ability
4.4. Sprinting Ability
5.Discussion
6.Conclusion
7.Acknowledgements
8.References
Keywords
Children; Team Sport; Aerobic Capacity; Jumping Ability.
Introduction
Volleyball is characterized by frequent explosive bouts of exercise, mainly short (3-5m) sprints and jumps, interspersed by time periods of active or passive recovery [1] and can be played upon both hard flat surface or/and sand surface (beach volleyball). Beach volleyball is gaining more and more attention the last years [2] and has been developed into a professional sport. In both volleyball and beach volleyball physiological characteristics such as sprinting and jumping ability, agility as well as aerobic capacity seem to affect performance [3-6].
Muscle strength and muscle power are determinant factors of sports performance [7, 8]. In volleyball in particular, they seem to play a critical role in jumping ability [2, 3, 6] as well as in the development of volleyball players [9]. Lidor & Ziv (2010) [5] reported that skilled volleyball players could produce greater power and therefore perform better compared with the less skilled ones. In accordance Sheppard et al., (2008) [9] demonstrated that both strength and power contribute to jumping performance in elite volleyball players and a potential increase in volleyball performance can be achieved through strength and power improvements. Morerecently Schaal et al., (2013) [6] found that NCAA Division-I female collegiate volleyball players produced significantly more power and jumped higher during countermovement jump when compared with high school varsity volleyball athletes.
Agility is defined as the ability to change direction with a minimal loss of control and/or average speed [3]. Strength, power and sprinting performance seem to be linked to agility and thereafter to sport performance in many field and court sports [10-13]. Sassi et al., (2009) [14] showed that agility is highly correlated to countermovement jump and 10m sprint, while Barnes et al., (2007) [3] showed that countermovement jumping ability is correlated with agility and can be used as a predictor of agilitytest time in female volleyball players. Agility and speed (sprinting ability) seem therefore to be different aspects of the same coin and to be involved in almost every maneuver that volleyball players perform [5].
Data regarding aerobic capacity and its significance in volleyball performance are controversial [5, 15]. Aerobic fitness seems to be important during repeated high intensity efforts, contributing to a faster resynthesis of creatine phosphate and therefore faster recovery in between sprints [16, 17]. However studies that have investigated the correlation between VO2max and repeated sprints ability have reported disputed data [18, 19]. In volleyball in specific, Meckel et al., (2015) [19] failed to establish a significant correlation between peak VO2 and repeated jump test concluding that aerobic fitness does not seem to be a determinant factor for volleyball performance. Furthermore a study conducted in pubescent volleyball players [10] showed that VO2max, among other physiological variables, does not discriminate between successful and unsuccessful talent-identified volleyball players.
Several studies have investigated the anthropometric and physiological characteristics of both teenage [4, 20] and adult volleyball players [21-23] and their impact on volleyball performance. Additionally there have been studies investigating the effects of a training program conducted on a school’s volleyball court [24] or the impact of sand surface on the force and kinematic parameters of jumping [2]. According to our knowledge there is little or no research regarding the influence of different training surfaces on volleyball performance. Therefore the purpose of the present study was to investigate the effects of different training surfaces (hard or sand surface) on physiological characteristics of prepubescent female volleyball players.
Thirty prepubescent female volleyball players participated in this study and underwent a 10-week training program. Participants were randomly allocated in two groups according to the training surface. Group S (N = 15, age = 11.2 ± 0.6 yrs, body weight = 40.8 ± 6.8 kg, body height = 151.6 ± 7.1 cm) executed the trainingprogramme on sand surface, while group H (N = 15, age = 11.3 ± 0.6 yrs, body weight = 39.9 ± 6.4 kg, body height = 151.3 ± 7.5 cm) executed the same programme on hard surface indoors. An experienced paediatrician evaluated the maturity status of the girls according to Tanner‘s scale [25] for pubic hair (P) and genitals (G) development (Mode value P = 2 and Mode value G = 2 for both groups). None of the girls had experienced menstruation before or reported any menstruation signs during the study.
Participants in both groups had a volleyball training experience of at least two years and were members in regional volleyball clubs in Attiki, Greece. Additionally a third training group (N = 15, age = 10.8 ± 0.2 yrs, body weight = 35.4 ± 6.0 kg, body height = 147.0 ± 7.4 cm), which had no volleyball experience, was recruited and served as control during the 10-week training period. Control group (C) participated in the regular physical education lessons and practiced volleyball, three times per week and for 45 minutes per session, according to the program of the Greek Ministry of Education. All volunteers and their parents were fully informed about the purpose, procedures and potential risks involved in the study. Thereafter children’s parents signed an inform consent. All experimental procedures were according to the Helsinki Declaration, while the study had the approval of the Ethical Committee of the University of Athens.
In order to evaluate participants’ physiological characteristics a test battery was conducted on an indoor volleyball court and included: a) 20 m shuttle run test for the evaluation of aerobic capacity, b) Illinois agility test for the evaluation of agility, c) Countermovement Jump (CMJ) and Squat Jump (SJ) for the evaluation of jumping ability and d) 10 m sprinting for the evaluation of sprinting ability. All tests in groups S and H were conducted 2 -3 days before the beginning of the 10-week training program (pre), at the end of the 5th week and right after the end of the program, while group C conducted the tests only before and after the end of the 10-week training program. All tests were executed in a random and balanced order, the best out of two trials was recorded for each test and subjects had the chance to fully recover in between tests. The 20m shuttle run test was conducted according to Ramsbottom et al., (1988) [26] and the total distance covered during the test was measured. The Illinois agility test was conducted according to Hastad and Lacy (1994) [27] and time was recorded with the use of photocells (Brower Timing Systems, South Draper, USA). The same photocells were used for time recording during the 10m sprint test. For the measurement of jumping height during squat (SJ) and countermovement (CMJ) jumps a MuscleLab 4020e (Ergotest, Norway) was used. In order to achieve full familiarization with the testing procedure all participants executed the test battery a week before the beginning of the training program [28].
The 10 week-training program for groups S and H consisted of three training sessions per week separated by at least one day of recovery. Each training session lasted 90 minutes and included 15 minutes of general activity warm up, 60 minutes which were the main part of the training and 15 minutes of cool-down and stretching. The 60-minute main part consisted of 5-20m sprints (single and repeated), jumps (single, repeated and drop jumps) and exercises aiming to improve volleyball technical skills. All exercises were designed and conducted in a constant move with sudden changes of direction and short sprints (2-3m) even in the technical skills training part. The volume of the training sessions as well as the level of difficulty and complexity were gradually increased during the training program according to guidelines described elsewhere [29-31]. The training program for group C included 10 minutes of general activity warm up, 30 minutes of technical and passing skills exercises and 5 minutes of cool-down and stretching.
All dependent variables (distance in 20m shuttle run test, time in agility test, height in jumping tests and time in 10m sprint) were normally distributed according to Shapiro-Wilk’s normality test. Comparisons between and within groups (S, H and C) for all dependent variables were performed by two-way ANOVA (groups x time) for independent samples. Significant differences between means were determined using Tukey’s Post hoc tests. Effect sizes (ES) of the differences were also calculated [32]. The magnitude of the differences was considered trivial (ES < 0.2), small (0.2 ≤ ES < 0.5), moderate (0.5 ≤ ES < 0.8) and large (ES ≤ 0.8). Statistical analysis was performed using the JMP statistical package (JMP11, SAS, USA). The level of significance was set to α = 0.05 and the results are presented as mean ± standard deviation (effect size).
Results
No statistical significant differences among groups were detected regarding age (p = 0.73), body weight (p = 0.22) and body height (p = 0.69) of the participants.
Changes in the distance covered during the 20m shuttle run test over the 10-week training program are presented in Figure 1. No significant differences among groups were detected in the pre measurements (p = 0.09), while training induced significant (fig. 1, p < 0.01) increases in distance covered even from the 5th week for both groups (Pre: S = 481.3 ± 32.5 m, H = 461.3 ± 31.6 m vs. 5thweek: S = 669.4 ± 87.5 (3.1) m, H = 524.0 ± 66.4 (1.3) m). Performance in the 20m shuttle run test was further significantly improved (p < 0.05) in the last five weeks of the training program (10th week: S = 796.0 ± 70.2 (1.6) m, H = 596.0 ± 50.3 (1.2) m), but group S achieved greater improvements and therefore a statistically significant difference among groups was detected (Figure 1, p < 0.01). Group C also improved its performance (Pre = 458.4 ± 31.2 m vs. 10th week = 503.4 ± 48.4 (1.1) m, p < 0.05), but at the end of the 10-week training program differed significantly from both groups S and H (Figure 1, p < 0.01).
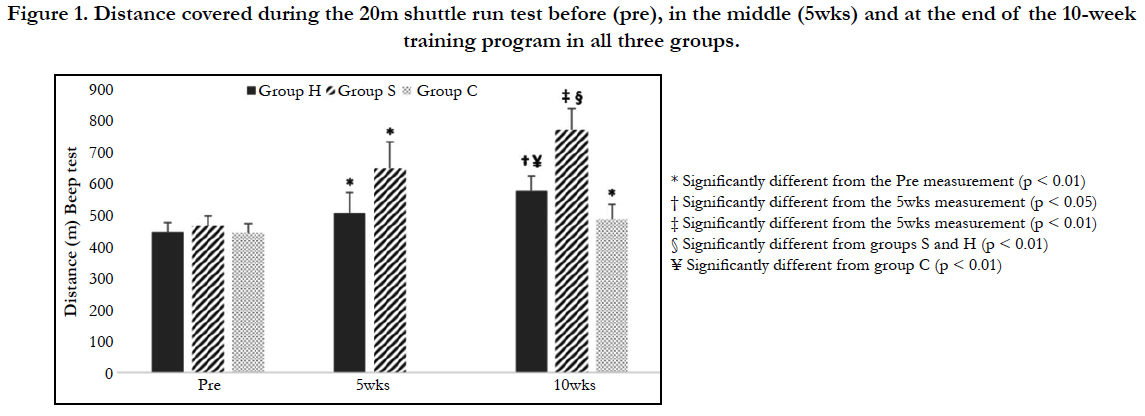
Figure 1. Distance covered during the 20m shuttle run test before (pre), in the middle (5wks) and at the end of the 10-week training program in all three groups.
Changes in the Illinois agility test over the 10-week training program are presented in Figure 2. Both groups S and H (S = 22.2 ± 0.5 sec & H = 22.0 ± 0.7 sec) performed significantly better (p < 0.01) than group C (C = 23.1 ± 1.3 sec) at the pre measurements, but there was no significant difference between groups S and H (p = 0.35). After 5 weeks of training both groups S and H performed better (S = 21.1 ± 0.5 (1.9) sec & H = 21.6 ± 0.7 (0.5) sec) but it was only performance in group S that reached significant levels (Figure 2, p < 0.01). At the end of the 10-week training program, time during the program differed significantly (p < 0.01) from both groups H and C, while group H in turn performed significantly (p < 0.01) better than group C (20.5 ± 1.8 (0.9) cm).
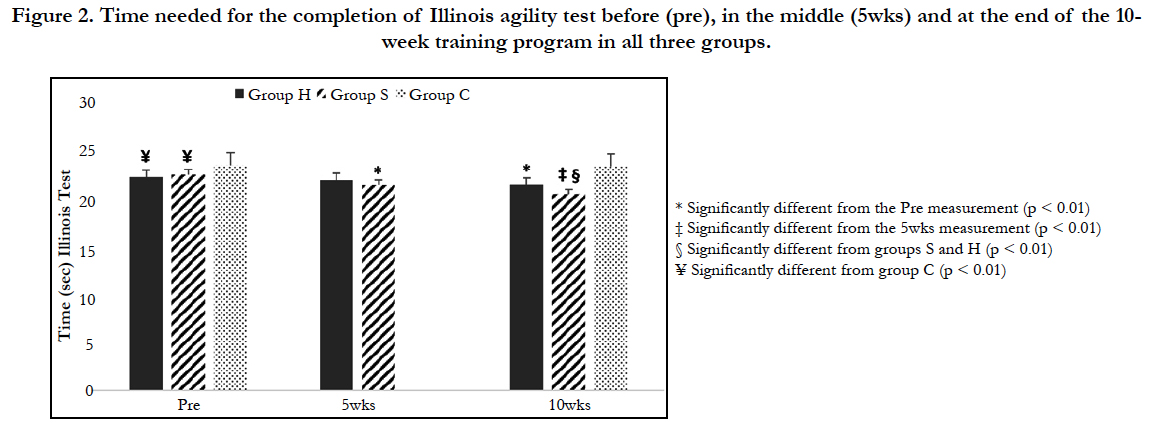
Figure 2. Time needed for the completion of Illinois agility test before (pre), in the middle (5wks) and at the end of the 10- week training program in all three groups.
The changes in jumping ability as reflected in Squat and Countermovement jump over the 10-week training program are shown in Figure 3. Both groups S and H performed significantly better (Figure. 3, p < 0.05) in squat (S = 20.3 ± 1.2 cm & H = 19.6 ± 1.4 cm) as well as countermovement jump (S = 21.4 ± 1.1 cm & H = 20.6 ± 1.4 cm) in comparison with group C (18.1 ± 1.7 cm & 19.0 ± 1.6 cm respectively) at the pre measurements, but there was no significant difference between groups S and H in neither squat (p = 0.08) nor countermovement jump (p = 0.10). After 5 weeks of training both groups S and H improved significantly their jumping performance in comparison with the pre measurements (SJ: S = 22.4 ± 1.8 (1.4) cm, p<0.01 & H = 20.8 ± 1.6 (1.1) cm, p < 0.05, CMJ: S = 24.0 ± 1.9 (1.1) cm & H = 21.9 ± 1.6 (1.2) cm, p < 0.01 respectively). At the end of the 10-week training program both groups S and H improved further their jumping performance in squat jump (S = 24.8 ± 1.2 (1.6) cm, p<0.01 & H = 23.7 ± 1.5 (1.8) cm, p < 0.05) compared with the 5th week measurement, while performance in group S differed significantly (fig. 3A, p < 0.01) from both groups H and C (C= 19.2 ± 2.0 (0.5) cm). In accordance are the results of the countermovement jump (Figure. 3B). Jumping performance was improved in both groups S and H (S = 26.1 ± 1.8 (1.4) cm & H = 23.1 ± 1.4 (0.8) cm), but it was only in group S that differed significantly (fig. 3B, p < 0.01) from the 5th week measurement. Furthermore performance in group S at the end of the 10 program differed significantly (p < 0.01) from both groups H and C, while group H in turn performed significantly (p < 0.01) better than group C (20.5 ± 1.8 (0.9) cm).
Changes in sprinting ability over the 10-week training program are presented in Figure 3. Time during the 10m sprint test in the pre measurement did not differ significantly among groups (S = 2.41 ± 0.05 sec, H = 2.40 ± 0.05 sec & C = 2.44 ± 0.06 sec, p = 0.18). After 5 weeks of training performance time was decreased in both groups S and H (S = 2.33 ± 0.03 (1.9) sec & H = 2.38 ± 0.04 (0.6) sec), but it was only performance time in group S that reached significant levels (Figure 4, p < 0.01). At the end of the 10-week training program, time during the 10m sprint test decreased further in group S and differed significantly from the 5th week measurement (S = 2.25 ± 0.05 (1.8) sec, p < 0.01). Furthermore performance in group S differed significantly (p<0.01) from both groups H and C (H = 2.36 ± 0.04 (0.2) sec and C = 2.42 ± 0.07 (0.3) sec respectively), while performance in group H differed significantly (Figure 4, ES = 0.7, p < 0.01) from the respective pre measurement.
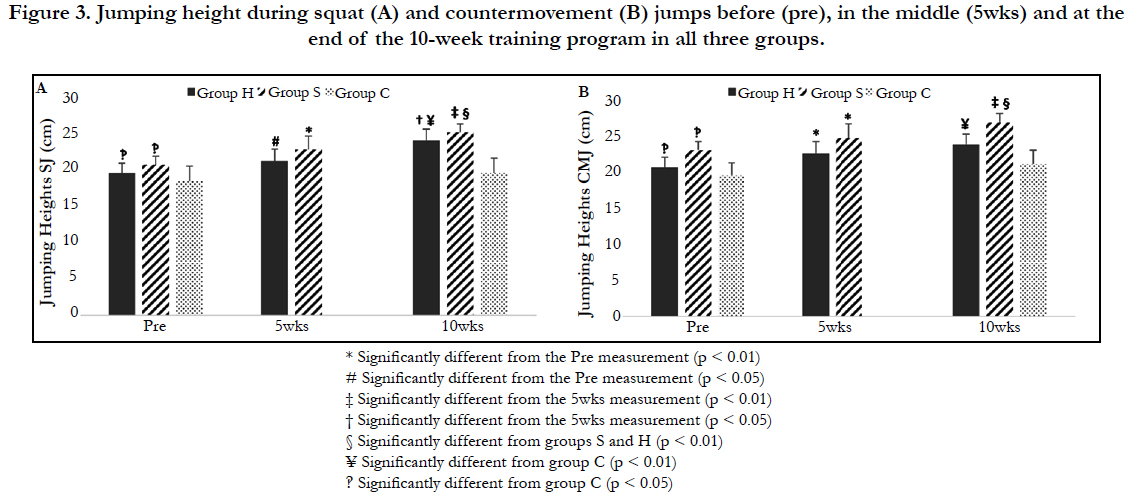
Figure 3. Jumping height during squat (A) and countermovement (B) jumps before (pre), in the middle (5wks) and at the end of the 10-week training program in all three groups.
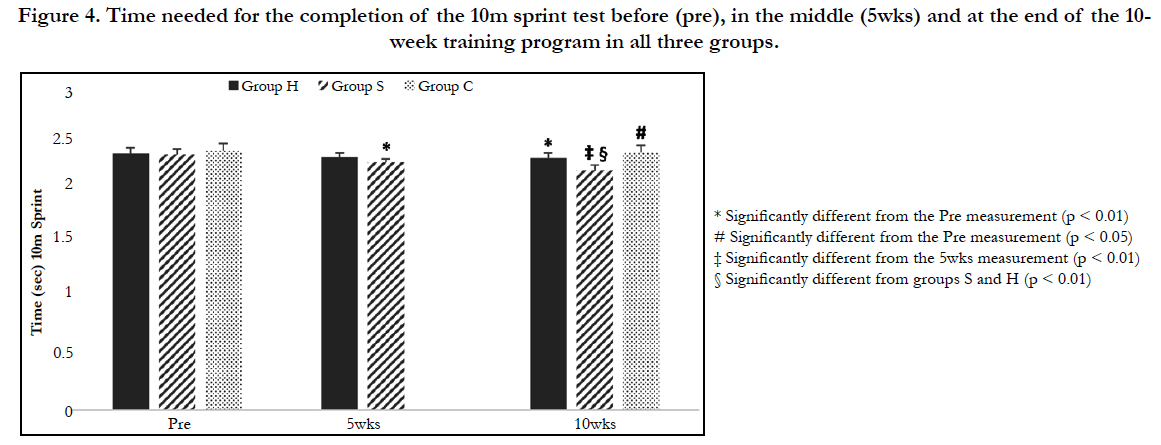
Figure 4. Time needed for the completion of the 10m sprint test before (pre), in the middle (5wks) and at the end of the 10- week training program in all three groups.
Discussion
The present study is the first to examine the effects of sand surface during a 10-week training program on aerobic capacity, agility, jumping and sprinting ability among prepubescent female volleyball players. The main findings were that a) aerobic capacity improved significantly in both groups S and H during the 10-week training program, but group S achieved greater improvements compared with group H, b) agility was also improved in both groups S and H, but after the 10-week training program group S performed significantly better than group H, c) jumping (SJ and CMJ) and sprinting (10m sprint) ability of prepubescent female volleyball players were significantly improved, as a result of the training stimulus, while the group that trained on sand surface (group S) achieved greater improvements compared to group H.
Anthropometric, somatotype and body composition seem to have a significant impact on sport [33, 34] and volleyball [4, 10, 22] performance while training during the developmental stages of growth. In the present study, no significant differences in the anthropometrical characteristics of participants were observed neither before nor after the 10-week training program and therefore observed differences should be attributed to the impact of training surface. Aerobic capacity and its importance in volleyball performance has been questioned [5, 10]. In a recent study by Meckel et al., (2015) [19] aerobic fitness was significantly correlated with repeated sprint ability, but not with repeated jump ability. The researchers had concluded that aerobic fitness seems to be more important in repeated running activity and therefore does not affect volleyball performance. In our study the 10-week training program resulted in significant improvements (ES = 1.2 – 3.1) in the 20m shuttle run test in all three groups. This is in accordance with previously reported data by Noyes et al., (2011) [24] which reported that a 6-week volleyball specific training program can significantly increase VO2max in female pubescent volleyball players. Significant improvement of the aerobic capacity in the present study were observed in both groups (S and H) even after only five weeks of training (Figure 1), despite the fact that the training program included mainly explosive exercises like sprinting and jumping. A part of the achieved improvements should though be attributed to growth and maturation of the participants since the control group achieved significant improvements too (ES = 1.1).
Jumping and sprinting performance were also significantly improved as a result of the 10-week training program. More specifically participants in both groups S and H performed significantly better (ES = 0.6-1.9) in 10m sprint test, while group C also improved significantly its performance (ES = 0.3) probably as a result of maturation. According to Sheppard et al., (2008) [9] any training triggering the neuromuscular system to generate maximal tension should contribute to higher vertical jump heights as a result of higher power outputs. In our study participants executed jumping and sprinting exercises even when they trained the technical skills part and this could have led to the observed improvements. Furthermore and as it was mentioned previously in the text, a part of the improvements should be attributed to the participants growth during the 10- week training program since even group C improved its sprinting ability. Improvements in speed, jumping ability and power result in significant improvements in agility [11, 13, 35] and this is also observed in the present study. Both groups S and H decreased their time to completion during Illinois agility test and differed significantly (Figure 2) from the control group. Differences were observed even in the pre measurement probably as a result of the previous training experience that both groups S and H had.
In our study, group S achieved greater improvements during and after the 10-week training program in all tested variables (aerobic capacity, agility, jumping and sprinting ability) compared with both groups H and C. Differences caused on biomechanical variables as well as energy expenditure during human locomotion on sand surface have been examined previously [36, 37]. The instability of a non-solid ground, like sand, can result in reductions in maximum produced force during squat jump compared to force produced during jumping on rigid surface [2]. The ankle-, kneeand hip joint kinematics are altered because of sand instability implying altered demands on the neuromuscular system [2, 38]. Furthermore sprinting and jumping on sand surface seems to decrease significantly stride length, because of loss of energy during acceleration, leading in a larger number of surface contacts in order to cover the same distance [36-38]. Gaudino et al., (2013) [36] reported also that running on sand surface increases the energy cost by 30% compared with the values achieved during running on grass surface. In accordance Lejeune et al., (1998) [39] showed that the power loss due to energy absorption of the sand may lead to increased mechanical work and therefore increased energy demand for the same work load.
Thus training on sand surface seems to increase the relative intensity of the conducted exercises, as well as altering the kinematics of the movements evoking changes in the neuromuscular junctions. Hence the greater improvements in group S might be the result of training adaptations caused by differences in relative intensity and kinematics of the exercises compared with groups H and C.
Conclusion
In conclusion our results revealed significant improvements of aerobic capacity, agility, sprinting and jumping ability in prepubescent female volleyball players, as a result of a 10-week training program. Group S which trained on sand surface achieved the greater improvements in all tested variables, highlighting the effectiveness of a non-solid training surface. Differences among groups should be attributed to the altered kinematics of the movements and the increased energy demands when training on sand surface, which in turn seem to promote training adaptations and therefore improve performance.
Acknowledgements
The present study was partially funded by School of Sport Sciences, Umeå University, Sweden, Dnr: IH 5.3-1-2015.
References
- Viitasalo JT, Rusko H, Pajala O, Rahkila P, Hila M, Montonen H, et al. Endurance requirements in volleyball. Canadian J Appl Sports Sci. 1987 Dec;12(4):194 - 201.
- Giatsis G, Kollias I, Panoutsakopoulos V, Papaiakovou G. Biomechanical differences in elite beach-volleyball players in vertical squat jump on rigid and sand surface. Sports Biomech. 2004 Jan;3(1):145-158.
- Barnes JL, Schilling BK, Falvo MJ, Weiss LW, Creasy AK, Fry AC. Relationship of jumping and agility performance in female volleyball athletes. J Strength Cond Res. 2007 Nov; 21(4):1192-1196.
- Gabbett T, Georgieff B. Physiological and anthropometric characteristics of australian junior national state, and novice volleyball players. J Strength and Cond Res. 2007 Aug;21(3): 902-908.
- Lidor R, Ziv G. Physical and physiological attributes of female volleyball players – A review. J Strength Cond Res. 24(7): 1963-1973.
- Schaal M, Ransdell LB, Simonson GR, Gao Y. Physiologic performance test differences in female volleyball athletes by competition level and player position. J Strength Cond Res. 2013 Jul;27(7):1841-1850.
- Kraemer WJ, Adams K , Cafarelli E , Dudley GA , Dooly C , American College of Sports Medicine, et al. American College of Sports Medicine position stand. Progression models in resistance training for healthy adults. Med Sci Sports Exerc. 2002 Feb;34(2):687-708.
- Granacher U, Lesinski M, Busch D, Muehlbauer T, Prieske O, Puta C, et al. Effects of resistance training in youth athletes on muscular fitness and athletic performance: A conceptual model for long-term athlete development. Front Physiol. 2016 May 9;7:164.
- Sheppard JM, Cronin JB, Gabbett TJ, McGuigan MR, Etxebarria N, Newton RU. Relative importance of strength, power, and anthropometric measures to jump performance of elite volleyball players. J Strength Cond Res. 2008 May;22(3):758-765.
- Gabbett T, Georgieff B, Domrow N. The use of physiological, anthropometric, and skills data to predict selection in a talent-identified junior volleyball squad. J Sports Sci. 2007 Oct;25(12):1337-1344.
- Little T, Williams AG. Specificity of acceleration, maximum speed and agility in professional soccer players. J Strength Cond Res. 2005 Feb;19(1):76-78.
- Markovic G, Sekulic D, Markovic M. Is agility related to strength qualities? – Analysis in latent space. Coll Antropol. 2007 Sep;31(3):787-793.
- Sheppard JM, Young WB. Agility literature review: Classifications, training and testing. J Sports Sci. 2006 Sep;24(9):919-932.
- Sassi RH, Dardouri W, Yahmed MH, Gmada N, Mahfoudhi ME, Gharbi Z. Relative and absolute reliability of a modified agility T-test and its relationship with vertical jump and straight sprint. J Strength Cond Res. 2009 Sep;23(6):1644-1651.
- Nikolaidis PT, Ziv G, Arnon M, Lidor R. Physical characteristics and physiological attributes of female volleyball players. The need for individual data. J Strength Cond Res. 2012 Sep;26(9):2547-2557.
- Bogdanis GC, Nevill ME, Lakomy HK, Boobis LH. Power output and muscle metabolism during and following recovery from 10 and 20 s of maximal sprint exercise in humans. Acta Physiol Scand. 1998 Jul;163(3):261-272.
- Glaister M. Multiple-sprint work: methodological, physiological, and experimental issues. Int J Sports Physiol Perform. 2008 Mar;3(1):107-112.
- Dawson BT, Fitzsimons M, Ward D. The relationship of repeated sprint ability to aerobic power and performance measures of anaerobic work capacity and power. Australian J Sci Med Sport. 1993;25:88–92.
- Meckel Y, May-Rom M, Ekshtien A, Eisenstein T, Nemet D, Eliakim A, et al. Relationships among two repeated activity tests and aerobic fitness of volleyball players. J Strength Cond Res. 2015 Aug;29(8):2122-2127.
- Gabbett T, Georgieff B. Physiological characteristics of elite junior volleyball players over competitive season. Strength Cond Coach. 2005;13(1):2-7.
- Fleck SJ, Case S, Puhl J, Van Handle P. Physical and physiological characteristics of elite women volleyball players. Can J Appl Sport Sci. 1985 Sep;10(3):122 - 126.
- Martin-Matillas M, Valades D, Hernandez-Hernandez E, Olea-Serrano F, Sjostrom M, Ortega FB, et al. Anthropometric, body composition and somatotype characteristics of elite female volleyball players from the highest Spanish league. J Sports Sci. 2014;32(2):137-148.
- Smith DJ, Roberts D, Watson B. Physical, physiological and performance differences between Canadian national team and universiade volleyball players. J Sports Sci. 1992 Apr;10(2): 131-138.
- Noyes FR, Barber-Westin SD, Smith ST, Cambell T. A training program to improve neuromuscular indices in female high school volleyball players. J Strength Cond Res. 2011 Aug;25(8):2151-2160.
- Tanner JM. Growth at adolescence. 2nd ed. Oxford: Blackwell Scientific Publications; 1962.
- Ramsbottom R, Brewer J, Williams C. A progressive shuttle run test to estimate maximal oxygen uptake. Br J Sports Med. 22(4):141-144.
- Hastad DN, Lacy AC. Measurement and evaluation in physical education and exercise science. 2nd ed. Scottsdale: A.Z: Gorsuch Scarisbrick; 1994.
- Mirkov DM, Nedeljkovic A, Milanovic S, Jaric S. Muscle strength testing: evaluation of tests of explosive force production. Eur J Appl Physiol. 2004 Mar;91(2-3):147-154.
- Diallo O, Dore E, Duche P, Van Praagh E. Effects of plyometric training followed by a reduced training program on physical performance in prepubescent soccer players. J Sports Med Phys Fitness. 2001 Sep;41(3):342-348.
- Kotzamanidis C. Effect of plyometric training on running performance and vertical jumping in prepubertal boys. J Strength Cond Res. 2006 May;20(2):441-445.
- Witzke KA, Snow CM. Effects of plyometric jump training on bone mass in adolescent girls. Med Sci Sports Exerc. 2000 Jun;32(6):1051-1057.
- Cohen J. Statistical power analysis for the behavioral sciences. 2nd ed. Academic Press, San Diego: C. A; 1988.
- Claessens A, Levevr, J, Beunen G, Malina RM. The contribution of anthropometric characteristics to performance scores in elite female gymnastics. J Sports Med Phys Fitness. 1999 Dec;39(4):355-360.
- Watts PB, Joubert GM, Lish AK, Mast JD, Williams B. Antropometry of young competitive sport rock climbers. Br J Sports Med. 2003;37(5):420-424.
- Gabbett T, Kelly JN, Sheppard JM. Speed, change of direction speed, and reactive agility of rugby league players. J Strength Cond Res. 2008 Jan;22(1):174-181.
- Gaudino P, Gaudino C, Alberti G, Minetti AE. Biomechanics and predicted energetic of sprinting on sand: Hints for soccer training. J Sci Med Sport. 2013 May;16(3): 271-275.
- Muramatsu S, Fukudome A, Miyama M, Arimoto M, Kijima A. Energy expenditure in maximal jumps on sand. J Physiol Anthropol. 2006 Jan;25(1):59-61.
- Tilp M, Wagner H, Muller E. Differences in 3D kinematics between volleyball and beach volleyball spike movements. Sports Biomech. 2008 Sep;7(3): 386-397.
- Lejeune TM, Willems PA, Heglund NC. Mechanics and energetics of human locomotion on sand. J Exp Biol. 1998 Jul;201(Pt 13):2071-2080.


