Quantitative and Qualitative Characteristics of Retinal Vasculature Shadowing on Enface Swept Source Oct, in Healthy Subjects and Diabetic Macular Edema
Hanhart J1*, Arieli Y2, Caspi A2, Rozenman Y1
1 Department of Ophthalmology, Shaare Zedek Medical Center, Jerusalem, Israel.
2 Electro-Optics Department, Jerusalem College of Technology, Israel.
*Corresponding Author
Joel Hanhart, MD, FEBO,
Department of Ophthalmology, Shaare Zedek Medical Center,
12 Beyt Street, Jerusalem 91031, Israel.
Tel: +972-2-6666665
Fax: +972-2-6666580
E-mail: hanhart@szmc.org.il
Received: June 16, 2016; Accepted: August 04, 2016; Published: August 09, 2016
Citation: Hanhart J, Arieli Y, Caspi A, Rozenman Y (2016) Quantitative and Qualitative Characteristics of Retinal Vasculature Shadowing on Enface Swept Source Oct, in Healthy Subjects and Diabetic Macular Edema. Int J Ophthalmol Eye Res. 4(7), 237-241.DOI : dx.doi.org/10.19070/2332-290X-1500049
Copyright: Hanhart J© 2016. This is an open-access article distributed under the terms of the Creative Commons Attribution License, which permits unrestricted use, distribution and reproduction in any medium, provided the original author and source are credited.
Abstract
Background: To evaluate the characteristics of retinal vascular shadowing, viewed through en face swept source optical coherence tomography (SS-OCT) imaging in normality and diabetic macular edema (DME).
Design: Prospective case series conducted at Shaare Zedek Medical Center.
Participants or Samples: 34 eyes of 17 healthy subjects and 30 eyes of 16 diabetic patients.
Methods: Collected data included demographics, Snellen chart measured visual acuity, current HBA1C levels, previous laser treatments and swept source OCT measured central retinal subfield thickness. SS-OCT en face images were generated and flattened at three planes: ganglion cell layer (GCL), inner plexiform layer (IPL), retinal pigment epithelium (RPE). The largest vessel was identified at the RPE level, retrieved at the GCL and IPL layers and its diameter measured. The deepest plane in the choroid at which shadow of this vessel could be identified was then measured from the RPE. Main Outcome Measures: Diameter of the largest vessel, depth of the vascular signal.
Results: DME mostly affected the vascular shadow at the IPL level. At this plane, the measured vessel of the largest vessel was significantly reduced in DME (93.3 ± 33.5 vs. 115.9 ± 2.54 microns; p<0.01). A trend was found between DME and reduction of depth of the vascular signal (retrieved at 120.0 ± 74.2 microns below the RPE in diabetic eyes vs. 148.7 ± 92.1 microns in eyes of healthy patients aged more than 55 years; p=0.07).
Conclusions: DME impacts vascular shadowing, over and under the RPE.
2.Introduction
3.Methods
3.1.Participants and imaging protocol
3.2.Image evaluation
3.3.Statistical analysis
4.Results
4.1.Healthy subjects
4.2.Appearance of the largest retinal vessel
4.3.Diameter of the larger vessel(DLV) at selected planes
4.4.Depth of the vascular signal (DVS)
4.5.Correlation between the diameter of the larger vessel and the depth of the vascular signal
4.6.Diabetic patients
4.7.Appearance of the largest retinal vessel
4.8.DLV at selected planes
4.8.DVS
4.9.Correlation between the diameter of the larger vessel and DVS
4.10.Correlation between DVS and visual acuity
5.Discussion
6.References
Keywords
Swept Source OCT; Retina; Choroid; Vessels; Arteries; Veins; Artefacts.
Introduction
There are two sources of blood supply to the mammalian retina: the central retinal artery and the choroidal blood vessels. 20-30% of the blood supply is provided through the central retinal artery and nourishes the inner retinal layers [1, 2]. The central retinal artery has 4 main branches in the human retina [3].
Optical coherence tomography (OCT) is based on the imaging of the reflected light. Due to high light absorption by retinal vessels, reflected light from locations beneath these vessels is significantly decreased [4]. The phenomenon produces a shadow image below vascular structures.
In 1997, Podoleanu et al., suggested using OCT to generate en face images of the retina [5]. This technique offered the potential to image individual retinal layers on the coronal plane. One of the main advantages of en faceimages is that the branching pattern of arterioles and veinules is more easily appreciated at several planes than on B-scans. Adequate averaging and flattening of the obtained C-scans allow additional improvement in the delineation of blood vessels.
OCT angiography is a further developpement used to image threedimensional vascular structures by detecting erythrocyte motion contrast between OCT intensity cross-sectional images [6]. Large retinal vessels are known to produce shadow images, on static en face views [4, 7-10] as well as angiograms [11, 12]. This shadow is usually considered as an artefact, affecting the measurement of retinal layers and visualization of choroidal vessels. Methods have therefore been developped in order to attempt to reduce the effects of vessel shadowing on clinical interpretation of images obtained by OCT [4, 6- 8, 11, 13-15].
In this study, we aim to adopt a different stand, looking at this vascular shadowing as a source of information on the vessel itself as well as on the tissues it overpasses. On that purpose, we propose to quantitatively and qualitatively describe the vascular shadow at selected retinal C-scans and analyse the maximal depth of vascular retinal shadow in healthy eyes and eyes with diabetic macular edema (DME), the most frequent cause of visual impairment in diabetes.
Methods
This study was approved by ethics committee of the Shaare Zedek Medical Center.
A cohort of healthy volunteers underwent swept source OCT fundus imaging. All healthy subjects were at least 18 years old, with refractive error below ± 2 spherical equivalent diopters. Healthy volunteers had no history of any ocular condition requiring monitoring or surgery. They were not taking topical nor systemic medication. Pregnant women were excluded.
Type 1 and Type 2 diabetes patients were included if one or both eyes met the following criteria: (1) best-corrected visual acuity of finger counting or better, (2) OCT retinal thickness of at least 250 μm in the central subfield, at least 300 μm in theETDRS extern subfield closer to the largest macular vessel as defined below. Exclusion criteria comprised any other significant macular pathology such as AMD or vascular occlusive disorder, epiretinal membrane or vitreomacular traction. Eyes were not eligible if they had undergone any macular photocoagulation. Any major ocular surgery including cataract extraction within the prior 12 months was a criterion of exclusion. Panretinal photocoagulation was not an exclusion criteria if it had been delivered at least 12 months prior to imaging. Both eyes were excluded in case of previously documented uveitis. Eyes were excluded if they had received topical medication other than intraocular lowering pressure and lubricants for the last 6 months. An eye was excluded if cataract precluded visualization of the large vessels on the averaged image at the RPE level.
For both groups, optical coherence tomography images were acquired by swept source domain OCT (OCT (DRI OCT-1 Atlantis; Topcon, Tokyo, Japan). We employed a 3D volumetric scan, which produces an OCT image containing 512×256 axial scans with a scan area of 6×6 mm.
Retinal thickness mapping was automatically generated.
En face images of the retina and choroid were obtained by En-View, a program in the swept source OCT software. The en face images were then flattened at three planes, without using the averaging function (Figure 1): ganglion cell layer (GCL), inner plexiform layer (IPL), retinal pigment epithelium (RPE). Those planes were automatically defined by the software. The accuracy of the layer identification was checked on the corresponding B-Scan.
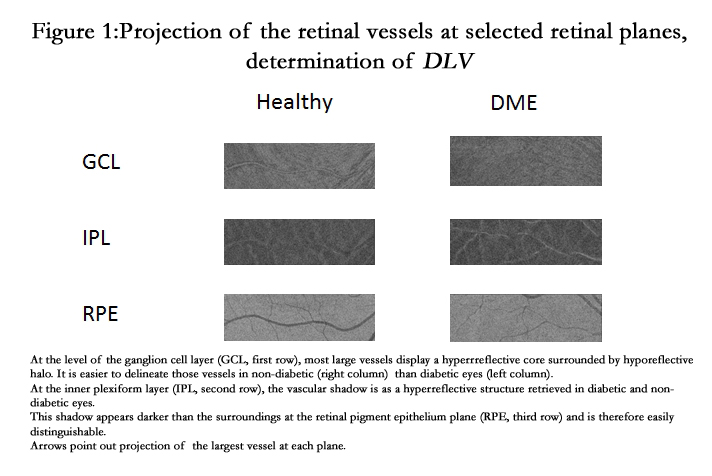
Figure 1. Projection of the retinal vessels at selected retinal planes, determination of DLV
The largest vessel was identified at the RPE level, retrieved at the GCL and IPL layers. Its diameter was then measured (measured diameter at the projection of the largest vessel, DLV), using the caliper provided with the software, at a constantlocus of the vessel (determined as the largest caliber on the shadowgram provided with the image analysis software.
As flattening had been performed at the RPE level, the remotest distance from the RPE at which this vessel could be identified was measured from the RPE by the caliper (depth of vascular signal, DVS) (Figure 2).
Appearance of the large retinal vessel was noted for each level (Figure 1).
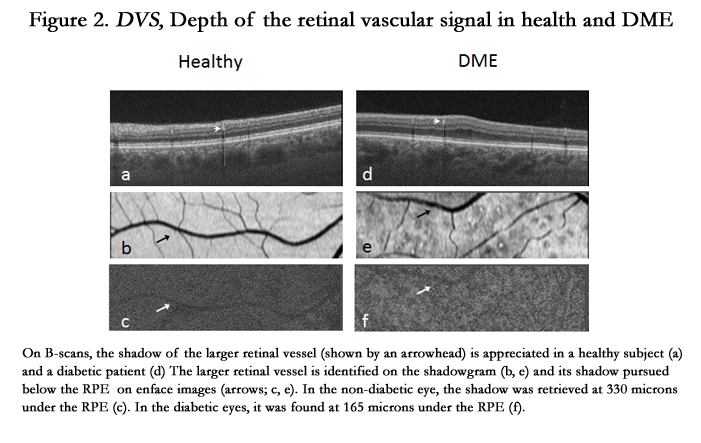
Figure 2. DVS, Depth of the retinal vascular signal in health and DME
Collected data included demographics, Snellen chart measured visual acuity, current HBA1C levels, previous laser treatments and swept source OCT measured central retinal subfield thickness. Using statistical software, means and standard deviations were calculated and baseline differences in retinal and other parameters between healthy subjects and diabetic patients were evaluated using a t-test. The Pearson correlation coefficient was used for analysis of the data, with an alpha level of 0.05.
Results
A total of 34 eyes from 17 normal healthy subjects (9 men, 8 women) were studied. The mean age (±SD) was 42.7±11.5 years (range: 22-66 years). In all studied eyes, BCVA was 1.0.
At the GCL plane, the largest vessel appeared in 30 eyes with a hyperreflective core surrounded by a halo of variable hyporeflectivity. This hyporeflective halo was not seen in four eyes. At the IPL, the vessel was retrieved as a hyperreflective structure, while at the RPE plane, projection of the largest vessel, like all other parts of the vasculature, was darker than the surroundings.
In 13 eyes, DLV was higher at the IPL; in 7 eyes, at the RPE; in 5 eyes at the GCL. In 3 eyes, DLV was analogous at those three levels, while in 2 eyes it was found to be identical at RPE and GCL.
Mean DLV (±SD) was 95.7± 40.0 microns at GCL (range: 50-200), 115.9 ± 2.54 microns at IPL (range: 60-170) and 112.1 ± 3.75 microns at the RPE (range: 60-190). Those differences did not reach statistical significance (P = 0.03 for GCL vs IPL; 0.65 for IPL vs RPE; 0.12 for GCL vs RPE).
Mean DLV(±SD) considering all the studied layers was 130.4 ± 35.6 microns. When excluding the RPE plane and considering only IPL and GCL, DLV was 123.4 ± 30.7 microns.
When the diameter of the selected vessel was greater at the RPE,highestDLV amoung other considered layers was found to be 83.6±8.0 % of the diameter at the RPE.
Mean difference of DLVbetween both eyes was 25.5% at the RPE, 22.7% at the GCL and 14.2% at the IPL.
Below the RPE, the largest vessel could be retrieved as such at a depth of 161.0 ± 100.1 microns (range 50-430) from the RPE plane. Difference between both eyes was 18.6%.
No correlation was found between age and DVS(Pearson’s correlation = -0.3, NS) and no significant differences were found when distributing the patients among several age subgroups.
DLV at the IPL and DVSwere found to be correlated with a Pearson’s correlation coefficient of 0.8 (P < 0.001). The correlation was weaker between DLV at the GCL and DVS (Pearson’s correlation coefficient = 0.5; p=0.005). The correlation between DLV at the RPE and DVS was markedly less important (Pearson’s correlation coefficient = 0.26, NS).
30 eyes of 16 patients (10 males, 6 females) were studied. One eye was excluded because posterior subcapsular opacification precluded delineation of the large vessels on the shadowgram; the other one had received additional panretinal photocoagulation two months before assessment.
The mean age (±SD) was 43.4 ± 22.1 (range: 18-73 years, p = 0.3). Diabetes mellitus had been diagnosed 10.2 ± 6.5 years prior to imaging. HBA1c measure closest to imaging was 7.9 ± 1.5%. 7 eyes had undergone panretinal photocoagulation. BCVA was 0.36 ± 0.22 (range: 0.03-0.67).
Central subfield thickness was 305 ± 44.2 microns (range: 225- 412). Retinal thickness at the extern subfield closer to the largest macular vessel was 371 ± 65.2 microns μm (range: 302-458).
In 22 eyes, the largest vessel appeared at the GCL plane with a hyperreflective core surrounded by a halo of variable hyporeflectivity. This halo was not found in eight eyes.
As compared to healthy eyes, it was more difficult to delineate the vessel shadow at the IPL in diabetic eyes. However, analysing the RPE plane, the shadow appeared then darker than the surroundings and could easily be differentiated from it, even in the presence of outer retinal changes including subretinal fluid.
Mean DLV (±SD) was 92.9 ± 42.6 microns at GCL (range: 40- 220; p=0.76 with regard to the healthy population).
In three eyes, DLV could not been assessed at the IPL as the shadow boundaries were not accurately delineated. For the remaining 27 eyes mean DLV (±SD) was 93.3 ± 33.5 microns at IPL (range: 40-140). It differed significantly from eyes in the healthy group (p<0.01 for comparison with the healthy population).
At the RPE plane, mean DLV(±SD) was 114.5 ± 38.2 microns (range: 40-220; p=0.8 with regard to the healthy population).
When considering all the studied planes, mean DLV(±SD) was 128.1 ± 36.0 microns (p=0.7 with regard to the healthy population).
In eyes patients with diabetic macular edema, the largest vessel could be retrieved at 120.0 ± 74.2 microns (range 30-330) from the RPE plane (p=0.04 when compared to healthy subjects).
No correlation was found between DVS and total central subfield thickness (Pearson correlation coefficient = -0.3, NS).
DLV at the RPE and DVS were found to be correlated with a Pearson’s correlation coefficient of 0.5 (p = 0.002) in diabetic eyes.
Significant correlation was not found between DVS and DLV at the IPL (Pearson’s correlation coefficient = -0.01; NS) or at the GCL (Pearson’s correlation coefficient = 0.1; NS).
No significant correlation was found between DVS and visual acuity (Pearson’s correlation coefficient = 0.03; NS).
Discussion
In this study, we found that in normal and diabetic eyes, projection of the largest retinal vessel was differentially and consistently displayed at several layers.
In healthy eyes, no significant difference was found in DLV between the studied planes. DLV at a certain plane does not predict whether DLV will be greater or lesser at another plane. Age was not found to influence DVS.
If DME does not significantly modify DLV at the RPE as compared to healthy eyes, it does affect vascular shadowing in several ways.
First, the presence of fluids in the inner retina blurs the appearance of the projected vessel. The most noticeable change was found at the IPL level. At this plane, DLV was significantly reduced in DME (93.3 ± 33.5 vs. 115.9 ± 2.54 microns; p<0.01).
Secondarly, a trend was found between diabetic macular edema and reduction of DVS.
In order to attempt to understand those results, we have to remind that our ability to discern shadow below the actual image of the retinal vessels actually depends on two main factors. On one hand, in OCT, light is backscattered by the vascular wall and content, what results in lesser reflection of the structures beyond the vessel. On the resulting A, B and C-scans, we will therefore observe hyperreflectivity of the vessel itself and hyporeflectivity below it. On the other hand, our ability to follow the shadow is limited by contrast between this projected image and its surrounding limits. Hence, if less light is reflected by the environning tissues, for instance if fluids or exudates modify their refractive properties, contrast between the dark shadow and relatively hyporreflective structure will be less striking, affecting shadow depth.
Another possible phenomenon we have to take into account is that, despite the fact that in OCT light from the source is collimated, some scattering cannot be avoided. The wider the light beam reaching the tissue, the more blurred its shadow becomes, with a penumbra, a region of medium reflectivity being added to the dark umbra. Moreover, a halo can appear in projection of a vascular structure as at its center, intravascular content contribute to a greater measure to reflection than at its periphery, where the lumen is smaller.
The specific aspect of the shadow at various planes depends on the reflective properties of this particular plane. Penumbra phenomenon as well as difference in lumen diameter between the center of the cylindric vascular structure and its periphery may account for the observed halo.
The appearance of vascular shadow is severely modified in DME, as the IPL is invaded by fluids and its reflectivity severely modified. Interestingly, projection of the retinal vessels at the RPE can be used as a landmark in normal and diabetic eyes [16].
Diabetes related vascular changes may result in a change in the reflective properties of the vascular walls and possibly of the vessel content. This could explain, at least partially, why the presence of diabetic macular edema is associated with a reduction in the depth of the vascular signal. In order to corroborate this hypothesis, the depth of vascular shadowing should be investigated in eyes with cystoic macular edema from other causes than diabetes and in diabetic eyes without intraretinal fluids.
As already underlined by other researchers [10, 17], our results suggest that shadowing properties of the retinal vessels can actually provide new insight on their inner properties.
In summary, our study suggests that DME impacts vascular shadowing, over and under the RPE.
To our knowledge, this is the first time shadowing of the retinal vessels is studied in DME.
Since the shadow effect depends on both the reflectance of the considered structure and the optical properties of tissues beyond it, further analysis of vascular shadowing could give insight on the way various conditions impact the vessels as well as neuronal and glial tissues below them.Those changes in vascular shadow at the macula could be exploited as a meaningul biomarker in diabetic maculopathy.
References
- Henkind P (1969) Microcirculation of the peripapillary retina. Trans Am Acad Ophthalmol Otolaryngol 73(5):890-7.
- Werkmeister RM, Schmidl D, Aschinger G, Doblhoff-Dier V, Palkovits S, et al., (2015) Retinal oxygen extraction in humans. Scientific reports 5:15763.
- Dollery CT (1969) The retinal circulation in hypertension and diabetes. The Scientific basis of medicine annual reviews 44-59.
- Golzan SM, Avolio A, Graham SL (2011) Minimising retinal vessel artefacts in optical coherence tomography images. Computer methods and programs in biomedicine 104(2):206-11.
- Podoleanu AG, Dobre GM, Webb DJ, Jackson DA (1997) Simultaneous en face imaging of two layers in the human retina by low-coherence reflectometry. Optics letters 22(13):1039-41.
- An L, Subhush HM, Wilson DJ, Wang RK (2010) High-resolution widefield imaging of retinal and choroidal blood perfusion with optical microangiography. Journal of biomedical optics 15(2):026011.
- Balk LJ, Mayer M, Uitdehaag BM, Petzold A (2014) Retinal hyperaemiarelated blood vessel artifacts are relevant to automated OCT layer segmentation. Journal of neurology 261(3):511-7.
- Fabritius T, Makita S, Hong Y, Myllyla R, Yasuno Y (2009) Automated retinal shadow compensation of optical coherence tomography images. Journal of biomedical optics 14(1):010503.
- Goldenberg D, Shahar J, Loewenstein A, Goldstein M (2013) Diameters of retinal blood vessels in a healthy cohort as measured by spectral domain optical coherence tomography. Retina 33(9):1888-94.
- Ouyang Y, Shao Q, Scharf D, Joussen AM, Heussen FM (2015) Retinal vessel diameter measurements by spectral domain optical coherence tomography. Graefe's archive for clinical and experimental ophthalmology 253(4):499-509.
- Spaide RF, Fujimoto JG, Waheed NK (2015) IMAGE ARTIFACTS IN OPTICAL COHERENCE TOMOGRAPHY ANGIOGRAPHY. Retina 35(11):2163-80.
- Yousefi S, Liu T, Wang RK (2015) Segmentation and quantification of blood vessels for OCT-based micro-angiograms using hybrid shape/intensity compounding. Microvascular research 97:37-46.
- An L, Shen TT, Wang RK (2011) Using ultrahigh sensitive optical microangiography to achieve comprehensive depth resolved microvasculature mapping for human retina. Journal of biomedical optics 16(10):106013.
- Hendargo HC, Estrada R, Chiu SJ, Tomasi C, Farsiu S, et al., (2013) Automated non-rigid registration and mosaicing for robust imaging of distinct retinal capillary beds using speckle variance optical coherence tomography. Biomedical optics express 4(6):803-21.
- Pilch M, Wenner Y, Strohmayr E, Preising M, Friedburg C, et al. (2012) Automated segmentation of retinal blood vessels in spectral domain optical coherence tomography scans. Biomedical optics express 3(7):1478-91.
- Hanhart J, Strassman I, Rozenman Y (2016) En face Integrated Central Avascular Zone (EFICAZ) scoring: a noninvasive tool for correlating morphological and functional damage in central diabetic macular edema. Graefes Arch Clin Exp Ophthalmol.
- Antcliff RJ, ffytche TJ, Shilling JS, Marshall J (2000) Optical coherence tomography of melanocytoma. American journal of ophthalmology 130(6):845-7.


