Marine Turtles Nesting Activity Assessment and Trend along the Central African Atlantic Coast for the Period of 1999-2008
Girard A1,2#, Godgenger MC1,2#, Gibudi A3, Fretey J3,4, Billes A3, Roumet D3,8, Bal G5, Breheret N5, Bitsindou A6, Van Leeuwe H6, Verhage B7, Ricois S8,Baye JP9, Carvalho J10, Lima H10, Neto E10, Angoni H11, Ayissi I11, Bebeya C11, Folack J11, Ngueguim JR11, Girondot M1*
1 Laboratoire Ecologie, Systématique et Evolution, UMR, Université Paris-Sud, Université Paris Saclay, CNRS, AgroParisTech, Orsay, France.
2 Association Rénatura France, 47 rue des cinq diamants, 75013 Paris, France.
3 PROTOMAC – Protection des Tortues Marines d’Afrique Centrale, Libreville, Gabon.
4 Centre de Recherche sur les Tortues Marines, Chélonée, Beauregard, France.
5 Association Rénatura Congo, Pointe-Noire, Congo.
6 Wildlife Conservation Society – Conkouati, Brazzaville, Congo.
7 World Wide Fund for Nature – Gamba, Libreville, Gabon.
8 Gabon environnement, Libreville, Gabon.
9 ACPE - Ibonga – Association pour la Connaissance et la Protection de l’Environnement, Gamba, Gabon.
10 MARAPA – Mar, Ambiente e Pesca Artesanal, São Tomé, São Tomé e Principe.
11 CERECOMA - Centre Spécialisé de Recherche sur les Ecosystèmes Marins, Kribi, Cameroun.
# co-first-authors
*Corresponding Author
Marc Girondot,
Laboratoire Ecologie, Systématique et Evolution,
UMR 8079, Université Paris-Sud, Université Paris Saclay, CNRS, AgroParisTech,
Orsay, F-91405, France.
E-mail: marc.girondot@u-psud.fr
Received: May 30, 2016; Accepted: June 22, 2016; Published: June 28, 2016
Citation: Girard A., Godgenger MC, et al., (2016) Marine Turtles Nesting Activity Assessment and Trend along the Central African Atlantic Coast for the Period of 1999-2008. Int J Marine Sci Ocean Technol. 3(3), 21-32. doi: dx.doi.org/10.19070/2577-4395-160005
Copyright: Girondot M© 2016. This is an open-access article distributed under the terms of the Creative Commons Attribution License, which permits unrestricted use, distribution and reproduction in any medium, provided the original author and source are credited.
Abstract
Four marine turtle species commonly nest along the Atlantic coast of Central Africa: leatherback (Dermochelys coriacea), olive ridley (Lepidochelys olivacea), hawksbill (Eretmochelys imbricata) and green (Chelonia mydas) turtles. The most important regional status assessment to date is reported in this study integrating data from 40 nesting sites from Cameroon to the Republic of Congo. The description of marine turtle nesting seasons has been performed and annual nesting activity estimated for each studied nesting site. Thus, we were able to present the spatial pattern of nest distribution throughout the studied nesting beaches. Moreover, leatherback and olive ridley Central African stocks have been assessed and we show hereby their nesting trend over these 8 years. Leatherbacks trend is decreasing in Gabonese coast while increasing in Congolese one. The pattern is not understood and need more attention, as Gabon coast shares the highest worldwide aggregation for this species. Ridleys trend is decreasing in Congo and stable elsewhere in Central Africa. Finally, the necessity of a regional and international framework for marine turtle conservation and future assessment priorities are discussed.
2.Introduction
3.Materials and Methods
3.1.Study area and local partners
3.2.Data series
3.3.Nesting season model
3.4.Error distribution and parameter estimation
3.5.Model selection
3.6.Standard error on parameters and nest numbers
3.7.Estimation of parameters of exponential growth
4.Results
4.1.Nesting season fit
4.2.Trend analysis
4.3.Spatial pattern of nest distribution in Central Africa
5.Discussion
6.Acknowledgements
7.References
Keywords
Central Africa; Conservation; Dermochelys Coriacea; Lepidochelys Olivacea; Nest Distribution; Stocks Assessment; Temporal Trend.
Introduction
For several centuries, many factors such as exploitation and diverse human activities have contributed to the worldwide decline of marine turtle populations [13]. This general trend has been reported for many populations around the world although some of them appear locally stable (e.g. French Guiana in Girondot et al. 2007 [19]) or increasing (e.g. US Virgin Islands in Dutton et al. 2005 [10]). Therefore, it is impossible to generalize about the status of marine turtles and each population must be analyzed before a conclusion can be made about its status.
The Central African coast hosts marine turtle nesting sites and feeding areas of worldwide interest due to the importance of the surface area of concern. Four marine turtle species, leatherback (Dermochelys coriacea), olive ridley (Lepidochelys olivacea), green (Chelonia mydas) and hawksbill (Eretmochelys imbricata) turtles have been reported to nest along the Central African coast (Figure 1). The region hosts nesting sites dispersed from Cameroon to Angola containing some of the most important international leatherback nesting areas, such as the national parks of Pongara and Mayumba in Gabon [14, 15] and the Conkouati-Douli national park in the Republic of Congo [35].
Although there has been recent advances in research and conservation of marine turtles along the Atlantic coast of Africa, marine turtles status and population trends are still unknown [12]. Nevertheless, considering all threatening factors, the conservation status of all marine turtles has been qualified as “unfavourable” [6] without quantitative justification. IUCN statuses for the marine turtles nesting in central Africa are: C. mydas (Endangered A2bd ver 3.1), L. olivacea (Vulnerable A2bd ver 3.1), D. coriacea (Vulnerable A2bd ver 3.1), E. imbricata (Critically Endangered A2bd ver 3.1). However, these global statuses could mask local differences. The aim of this study is to quantify the nesting level for each marine turtle species in central Africa and to propose a more rigorous status for these species. It will help to manage a coherent conservation strategy by reducing the knowledge gap regarding the region’s marine turtle populations.
This study is based on marine turtle nesting survey data for the period 1999-2008 along the coast of four countries: Cameroon, Gabon, the Republic of Congo, and São Tome and Principe. The surveys include approximately 250 km of insular and continental littoral. Survey duration ranges from 1 to 8 years depending on the field constraints, which produced a large heterogeneity of data (Table 1). We had previously developed a statistical model that reveals the frequency of marine turtles nesting at nesting beaches with high levels of nesting [20] and with low levels of nesting [22]. For the purpose of this study, the nesting season model was adapted for sites with various nesting levels, which is more typical in the region being studied. The number of tracks left on the beach by eachspecies has been used as an index of the population size [16] to define the trend of these population when sufficient time series were available.
Seasonality and nesting season shapes have been defined for four species nesting in Central Africa. We have identified nesting activity at 36 Leather-back beaches, 36 Olive Ridley beaches, 17 green turtle beaches and 11 hawksbill beaches dispersed along 40 sites of the African Atlantic coast. As a conclusion, we show the stability results for Leatherback and Olive Ridley nesting number during the 1999-2008 period. The data for the greens and hawksbills are insufficient to get a conclusion on their trend.
Materials and Methods
The studied sites are located in Cameroon, Gabon, the Republic of Congo and on the insular territories of São Tome and Principe, all in Central Africa (see maps in Figures 1 and 2). The morphology of the different nesting areas appears in constant evolution due to important coastal dynamics with periods of sand deposition and erosion. However at the timescale of this study, the nesting sites can be considered as stable. Sand beaches and mangroves alternate along these coasts.
Sea turtle projects are underway in all of the above stated countries. The different projects monitor sea turtle nesting activity as well as other population studies and conservation activities (see table 1 for a list of the organizations).
Cameroon has an Atlantic coastline of 402 km with a littoral rich in estuary. Nesting site survey is done between Ebodjé and Kribi, which are located in the Campo Ma’an Technical Operational Unit around the Campo Ma’an national park. São Tome and Principe is composed of two main islands and around twenty smaller ones of volcanic origin in the Malfras Archipelago. São Tome and Principe is situated in the Gulf of Guinea on the equator level. This archipelago is composed of 209 km of coast. Marine turtle nesting beaches are monitored since the 2004-2005 nesting season. The coast of Gabon spreads out over nearly 950km and consists mainly of long sandy beaches and few rocky parts [31]. Congo Brazzaville is located in the South of Gabon and has a short Atlantic coast of 170 km. PROTOMAC (Protection des Tortues Marines d’Afrique Centrale) is a regional program based in Libreville since 1997. This This organisation coordinated the work of all the organisations along the Central African territories.
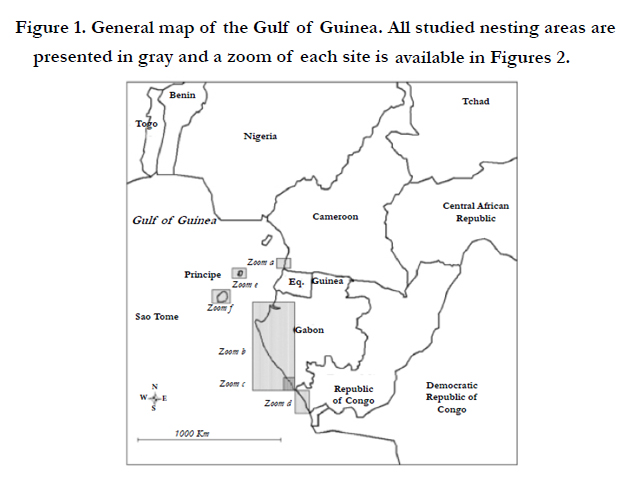
Figure 1. General map of the Gulf of Guinea. All studied nesting areas are presented in gray and a zoom of each site is
available in Figures 2.
Figures 2. Map of Central African countries where the marine turtles nest surveys have been performed. Each species nest occurrence is represented by a different symbol: Dermochelys coriacea (cross), Lepidochelys olivacea (ring), Chelonia mydas (square) and Eretmochelys imbricata (lozenge). The relative importance of nesting activity for each nesting site is represented with the according thickness of the outlined symbol.
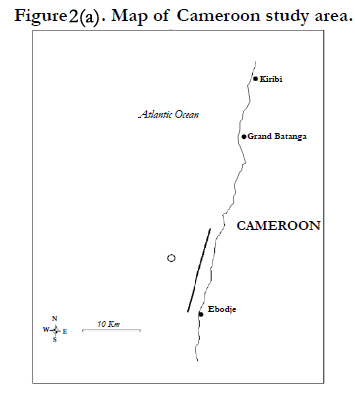
Figure 2(a). Map of Cameroon study area.
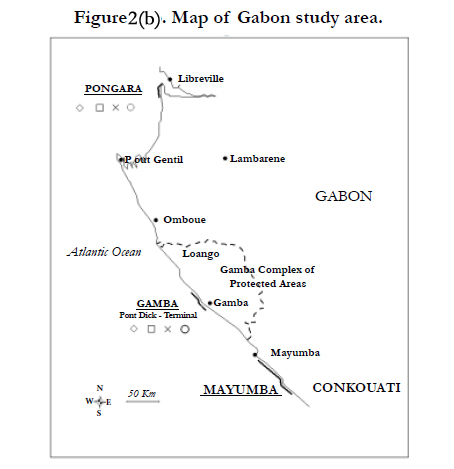
Figure 2(b). Map of Gabon study area.
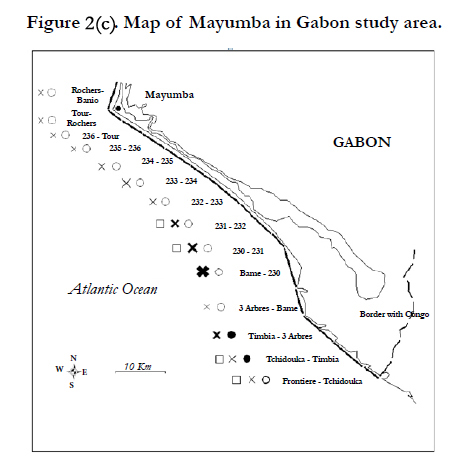
Figure 2(c) Map of Mayumba in Gabon study area.
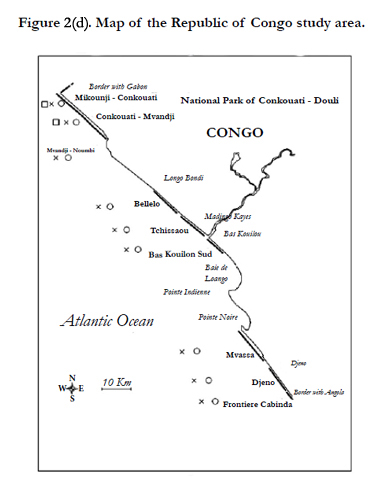
Figure 2(d) Map of the Republic of Congo study area.
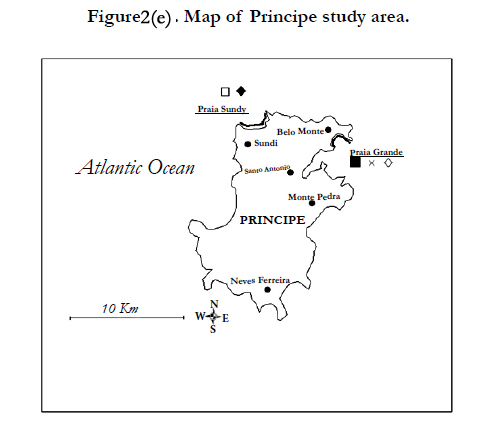
Figure 2(e). Map of Principe study area.
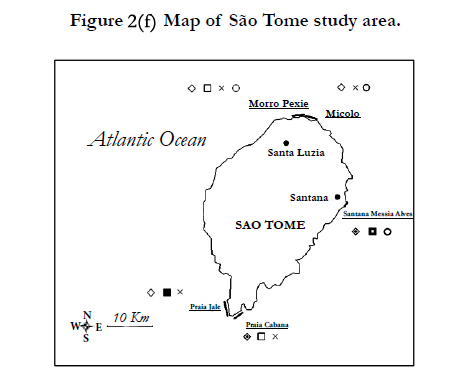
Figure 2(f). Map of São Tome study area.
Female tracks on beaches have been counted by morning patrols and species have been identified by the appearance of tracks in the sand. The data have been centralized in adatabase at the end of each nesting season. Only new tracks from the night before have been taken into account. The dates reported is the night where the patrols begin. Most of these beaches are in remote place and human activity does not perturb the detection of the tracks.
The coast of Cameroon hosts few but regular nests of leatherbacks and olive ridleys. Nesting monitoring in Cameroon is performed on daily basis on 15 km of adjacent beaches in front of the villages of Békolobé, Ipenyendjé, Likodo, Ebodjé and Mbendji (Figures 2/a). This work was conducted from January to June in the 2003-2004 nesting season, from July to May in the 2004-2005 nesting season, and from September to November in the 2006-2007 nesting season. No data of nesting activity tracks is available for the 2005-2006 nesting season due to financial difficulties.
Along the littoral of Principe, the nests of greens, hawksbills and leatherbacks are regularly sighted. São Tome hosts the nest of the four regional species [23]. Nesting surveys in São Tome and Principe have been carried out since the 2004-2005 nesting season along Praia Sundy and Praia Grande in Principe and five sites in São Tome (Morro Peixe, Micolo, Praia Jalé, Santana, Praia Cabana) (Figures 2/e, 2/f). In São Tome, nest counting field patrols were carried out on a daily basis from August to May, covering lengths of nesting season which varies depending on the site and the species of concern. In Principe, beaches are patrolled during the months of December and January.
Nests of four marine turtle species are sighted in Gabon with important and regular sightings of leatherbacks and olive ridleys and the occasional greens and hawksbills nests. Nesting activity in Gabon takes place along 3 main sites (Figures 2/b):
- Gamba Complex of Protected Areas: this is a 5.75 km-long beach situated near the airport of Gamba. The nesting surveys have been conducted morning from November to Marchsince the 2002-2003 nesting season.
- Mayumba national park: this is the most important regional Leatherback nesting area. It is 95 km long and is divided in 14 sites (see list in Table 1, map in Figure 2/c). Monitoring is done on a daily basis for nesting sites of interest and otherwise is performed on a weekly basis or each 15 days since the 1999-2000 nesting season.
- Pongara national park: this area of 25 km is divided in 4 parts: PK 1-PK 5.3; PK 5.3-PK 11.8; PK 12.6-PK 18.3 and PK 18.3-24.3 (see list in Table 1).Field patrols have occurred on a daily basis in the 2005-2006 nesting season.
Nesting ofleatherbacks, olive ridleys and to a lesser extent greens take place annually from September to Aprilalong the beaches of the Republic of Congo [22]. Nesting surveys have taken place from November to April on 2 beaches since the 2003-2004 nesting season and on 4 more beaches since 2005-2006 nesting season covering a total of 59 km dispersed along the littoral of Congo (Figures 2/d). In addition, the Conkouati-Douli national park has been patrolled by RENATURA in the 2000-2001 nesting season.
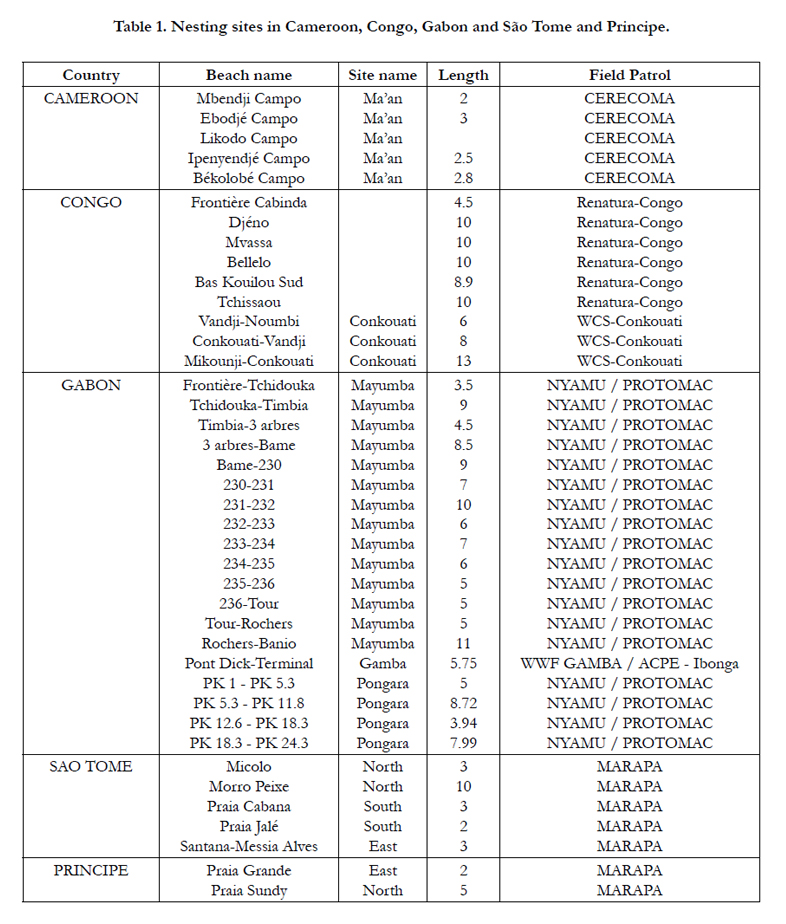

Table 1. Nesting sites in Cameroon, Congo, Gabon and São Tome and Principe.
The nesting season has been modeled using a set of equations based on Girondot (2010, 2015) [17, 21]. Let “t” being an ordinal date, the number of nests deposited per night is modeled using the set of equations (1).
if t < B → MinB
if t ε [B, P - F/2] → ((1 + cos(π(P - F/2 -t)/(P - F/2 - B)))/2) (Max - MinB) + MinB
if t ε [P-F/2, P+F/2]- Max
if t ε [P + F/2, E] - ((1 + cos(π(t - P + F/2)/(E - P + F/2)))/2) (Max - MinE)+ MinE
if t > E → MinE --------- (1)
The model requires at most 7 parameters:
- minB, the mean nightly nest number before the beginning of the nesting season
- minE, the mean nightly nest number after the end of the nesting season
- max, the mean number of nests at the peak of the nesting season
- P, the Julian time at the peak of the nesting season
- B, the Julian date at the beginning of the nesting season
- E, the Julian date at the end of the nesting season
- F, the number of days where mean number of nests is constant around the peak of the nesting season.
Various constraints can be set up to simplify this model:
minB = min E, same number of nests out the nesting season minB and/or minE # 0 (eg. 10-9), no nests out of the nesting season P-B=E-P, nesting season is symmetric around P F=0, no flat portion around peak
The simplest model uses 4 parameters, (P, P-B = E-P=cst, F=0, max, min B = min E=10-9).
The nesting season is defined as the interval [B, E]. Note that it is not exactly the same definition as in Girondot et al. (2006) [20], which considers the range of time where more than 5% of the mean number of nests at the peak of the nesting season are observed.
In the use of this model, the min parameters, which describes the daily number of nests outside the nesting season, is fixed to 0 as no nest is observed during half of the year (Girard, personal observation).
Some nesting surveys have only partially covered the nesting seasons and the correct date for the beginning, peak or/and end of the nesting season dates were not possible to be determined. In these cases, the average of the other nesting season fitted dates has been used.
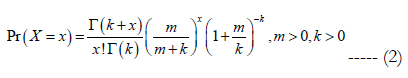
The parameters have been fitted using maximum likelihood statistical methodology. In short the parameter values that maximizes the likelihood of observations in the model are searched for using a non-linear fitting algorithm [28, 29]. A negative binomial model will be used as the underlying distribution for nest numbers of a particular night. The popularity of the negative binomial distribution is due largely to its ability to model count data with varying degrees of over dispersion (i.e. with sample variance exceeding the mean) [32]. The distribution is commonly expressed in terms of the mean m and dispersion parameter k such that the probability of observing a non-negative integer x is (equation 2):
Model selection was performed using the Akaike Information Criterion [20]. This is a ranking measure that takes into account the quality of the model fit comparing it to the data while penalizing the number of used parameters:
Where L corresponds to maximum likelihood, and M to the number of parameters. Models with the lowest values of AIC were retained as good candidate models and ΔAIC was calculated as the difference in value of AIC between a particular model and the one with the lowest AIC. Akaike weights ( wi = exp(-ΔAIC/2) normalized to 1) were used to evaluate the relative support of various tested models [9]. Akaike weights can be directly interpreted as conditional probabilities for each model. Ideally, the model with the lowest AIC was kept for further testing. When two or more models possessed similar Akaike weights, the model with the lowest number of parameters was selected. When several of these models had the same number of parameters, the model with the lowest AIC among them was selected.
An inverse of the Fisherian matrix is used to estimate the variance of parameters. Standard error of parameter i (ESi) is then obtained by taking the square root of the variance and the confidence interval at 95% by Xi ± 1.96 ESi. The total number of nests expected for each nesting season and nesting site has been calculated summing the observed number of nests laid per night when available with the estimated ones.
An exponential growth was used to describe annual nest number time series along African nesting sites.
The annual nest numbers have been estimated using maximumlikelihood and are therefore asymptotically normally-distributed [11]. Growth parameters are adjusted also by the maximum likelihood method. Standard deviation was modelled using two additive components: error on annual estimation and an adjusted component describing inter annual fluctuation. Error on r and N2006 parameters are estimated by the inverse of Fisher matrix calculated at maximum of likelihood [1]. The instantaneous growth rate of the exponential growth model has been fitted with maximum likelihood method firstly at the Central African scale and then at a country scale.
Statistical analyses have been done in R 3.3 using phenology packages version 5.1.1 [18].
In order to perform an appropriate model describing nesting seasons in Central Africa, predominance between the country and the year effects on nesting season occurrence has been determined. Due to a rich Leatherback database at our disposal, tests have been performed on this species on 2 beaches in Congo, 3 in the South and 3 in the North of Gabon. Four models have been implemented and their AIC were compared:
- A country and yearly-based model with beach and year-specific max and k values,
- A country-based model with country-specific max and k values,
- A yearly-based model with year-specific max and k values,
- A model with the same shape for all the years and countries.
A specific nesting season shape for each beach and each nesting season is selected among the 4 tested models (AIC=15069.50). Nonetheless, this model cannot be applied to all the nesting seasons at our disposal because data for some nesting beach/ species or year are too sparse. The second model is the order is the yearly-based model (AIC=15114.07). The country-based model (AIC=15407.26) and the model with the same shape for all nesting seasons and nesting sites perform the worst (AIC=15559.22).
So a yearly-based nesting season model will be used for the rest of the fitting procedure. Under these conditions, the lack of information for some nesting seasons is filled. Thus, a single shape for all nesting sites is implemented with B, P and E values equal for all nesting sites but different for each year. Only the k and max parameters are set beach-specific. The min parameter was always fixed to 0 because no nest is observed outside of the nesting season.
There is no sufficient nesting season information for the three others species to test the importance of the country and year effects on nesting season shape. Thus, a yearly-based model has been implemented for nesting season description for all others species.
For each species, we propose an approximate estimation of annual nesting activity in all the studied nesting sites during the 1999-2008 period. Two levels of second order errors are reported here. One measures the natural interannual variability of nesting activity and the other is the consequence of the estimation of missing data using the model of the nesting season. We report here the mean number of nests for each species and countries as well as the min and max confidence interval at 95% for all the years considered.
Dermochelys coriacea: The beginning of the nesting season of leatherback for the 2001-2002 and 2004-2005 seasons and the peak of the leatherback 2001-2002 nesting season cannot be fitted. So, these parameters have not been fitted and the average of the other estimated nesting season dates have been used. Dates for the leatherback nesting season have been fitted for each year and are shown in Figures 4. Leatherback nesting season is spread over 7 months and occurs mainly from the last week of September to the first week of May with a peak in the beginning of November. On average, 34,568 leatherback nests per year are likely to be laid on Gabonese studied beaches (95%CI: 10,905- 76,378), 933 on Congolese studied beaches (95% CI: 614-1270), 43 (95% CI: 15-177) in Cameroon, and 78 (95% CI: 54-146) in São Tome and Principe.
Lepidochelys olivacea: Field patrols were only carried out during the beginning and the peak of the Lepidochelys olivacea 2003-2004 and 2004-2005 seasons. Thus, the average of the fitted values for beginning and peak dates of these two seasons have been used for all nesting seasons with a gap for this data. Dates of Olive Ridley nesting season have been fitted for each year and are shown in Figures 4a. Olive Ridley nesting season is spread over 4 months and occurs mainly from the last week of July to the last week of February with a peak in the end of October. On average, approximately 3,118 (95% CI: 293-11,071) olive ridley nests per year are likely to be laid on Gabonese studied beaches, 917 (95% CI: 502-1683) on Congolese studied beaches, 289 (95% CI: 124-428) in Cameroon and 1,015 (95% CI: 700-1356) in São Tome and Principe.
Only during the 2005-2006 nesting season, have field patrols been carried out at the beginning and at the peak of the Chelonia mydas nesting season. Thus, the fitted values of beginning and peak dates of this nesting season have been used for all nesting seasons with gap for this data. Dates of green turtle nesting season for each year have been fitted and are shown in Figure 3/b. Green turtle nesting season is spread over 7 months and occurs mainly from mid August to the last week of March with a peak in the end of December. On average, approximately 57 (95% CI=28-141) green turtle nests per year are likely to be laid on Gabonese studied beaches, 16 (95% CI: 13-22) on Congolese studied beaches, and 649 (95% CI: 366-991) in São Tome and Principe.
Only during the 2005-2006 nesting season, have field patrols been carried out at the beginning and peak of the Eretmochelys imbricata nesting season. Thus, the fitted values of beginning and peak dates of this season have been used to fit 2003-2004 nesting season with gap on this data. Dates of hawksbill nesting season have been fitted for each year and are shown in Figure 3/b. Hawksbill nesting season is spread over 5 months and occurs mainly from the last week of October to the last week of March with a peak in the end of November. Nesting peak appears very early. Actually, it occurs only one month after the beginning of the nesting season. On average, approximately7 (95% CI: 6-53) hawksbill nests per year are likely to be laid on Gabonese studied beaches and 152 (95% CI: 114-206) in São Tome and Principe studied beaches.
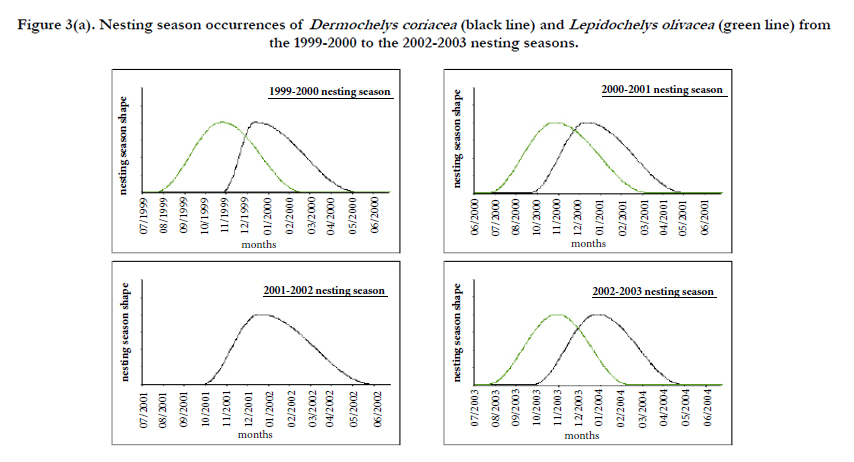
Figure 3(a). Nesting season occurrences of Dermochelys coriacea (black line) and Lepidochelys olivacea (green line) from the 1999-2000 to the 2002-2003 nesting seasons.
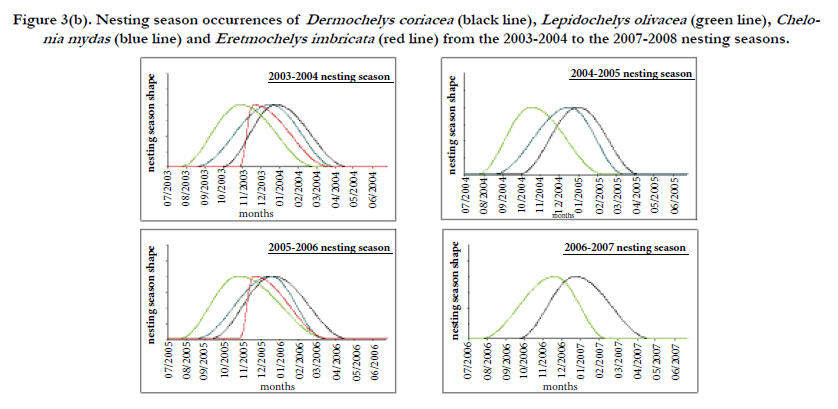
Figure 3(b). Nesting season occurrences of Dermochelys coriacea (black line), Lepidochelys olivacea (green line), Chelonia mydas (blue line) and Eretmochelys imbricata (red line) from the 2003-2004 to the 2007-2008 nesting seasons.
Analysis of leatherback and olive ridley nesting time series has allowed us to define their trend over the 1999-2008 period. However, the database for the hawksbills and greens are not large enough time to perform this analysis.
Growth rate fitted at a regional scale is negative -0.03 but the confidence interval is between -0.10 and +0.04. Given this confidence interval, the Leatherback nesting has been stable in Central Africa over the past 8 years (Figure 4).
The leatherback nesting appears contrasted among Central African countries with a positive growth rate of 0.16 (95% confidence interval between 0.12 and 0.19) in the Republic of Congo in concordance to our precedent conclusion (22) and a negative growth rate in Gabon of -0.21 (95% confidence interval between -0.19 and -0.23). The growth rate of Leatherback nesting in Principe cannot be estimated due to the poor information for this species on this site. Model with the same growth rate fitted for Principe and Gabon populations or for Principe and Congo populations are similar (AIC 677.18 vs. 678.08).
Growth rate fitted at a regional scale is null 0.00 (95% confidence interval between -0.19 and +0.19). The olive ridley nesting has then been stable in Central Africa over the past 8 years (Figure 4).
The olive ridley nesting could also be contrasted among Central African countries with a negative growth rate in the Republic of Congo (-0.12) in concordance to our precedent conclusion (22) and positive growth rate in Gabon (0.04) and Cameroon (0.45). However, in all these cases the 95% confidence intervals for growth rate encompass 0 and therefore stability cannot be rejected (95% confidence interval for Congo between -0.40 and 0.14, for Gabon between -0.17 and 0.25 and Cameroon between -0.69 and 1.60).
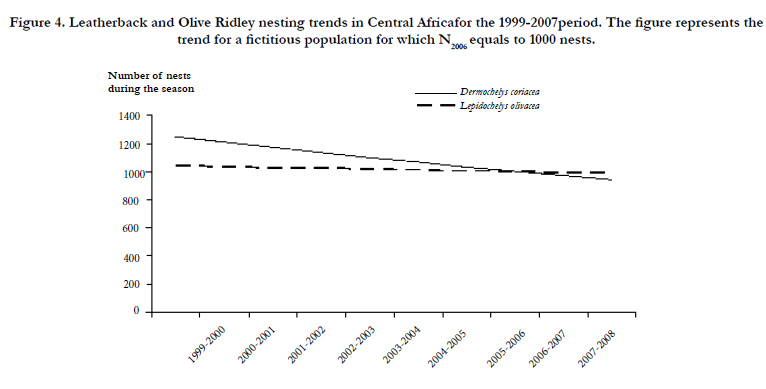
Figure 4. Leatherback and Olive Ridley nesting trends in Central Africafor the 1999-2007period. The figure represents the trend for a fictitious population for which N2006 equals to 1000 nests.
A comparison of the leatherback and olive ridley nesting activities along the Atlantic coast of Central Africa was made using the N2006 value derived from the trend analysis (Figure 5). The use of N2006 values rather than actual counts permits to have a comparable index of nesting activity among beaches with different level of surveys. Quantitative importance of leatherback and olive ridley nesting activities is reported as annual nest number per km in maps of Figures 2. A qualitative comparison of green and hawksbill nesting activities along the Atlantic coast of Central Africa has been done and is also reported in Figures 2.
The leatherback nesting activity in the Gulf of Guinea appears to be the most important in comparison with the other species. Its nest is concentrated along Gabonese nesting sites. Nest level estimations confirm Gabon as one of the worlds’ largest leatherback rookeries [41]. The leatherback nesting hotspots are mainly situated on Mayumba beaches [mean number of tracks per year=27,621 (95% CI: 4,488-70,243)] followed by the Pongara national park [mean number of tracks per year=6,983 (95% CI: 6,525-7,440)] and the Gamba Complex [mean number of tracks per year=775 (95% CI: 14-1,650)] (Figure 2). These estimates are concordant with a complete aerial survey of Gabonese coast which yields between 36,185 and 126,480 nests per year according to the nesting season [41].
The olive ridley nesting activity is spread over the whole Central African coast with a preference for Gamba, Northern São Tome, Congo-Gabon and Congo-Angola border beaches (Figure 2).
The largest Central African green turtle rookeries seem to be situated on São Tome and Principe. Small nesting populations are registered on Gabonese (Pongara, Mayumba) and Congolese (Conkouati-Douli national park) beaches (Figure 2).
The hawksbill nesting activity occurs mostly on São Tome and Principe, with the most important nesting populations registered on the Eastern São Tome beaches. An occasional nesting population is noted in Pongara and Gamba sites (95% confidence interval: 4-11.8 nests per year) (Figure 2).
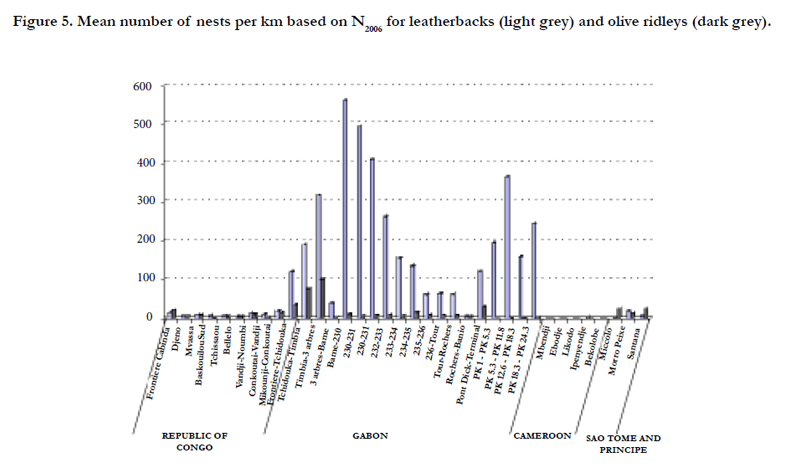
Figure 5. Mean number of nests per km based on N2006 for leatherbacks (light grey) and olive ridleys (dark grey).
Discussion
Sea turtle nesting activity in the Gulf of Guinea has been quantified and its distribution identified. Leatherback nests appear centred on Gabonese nesting beaches such as Gamba, Pongara and mostly Mayumba. Olive ridley nests are more dispersed along Central Africa, spreading throughout Gabon, Congo, São Tome and Cameroon with an important Congo-Gabon border concentration. São Tome and Principe appear as the largest hawksbill and green turtle rookeries of the Central African coast. Due to information shortage on these last two species, analysis of their nesting activity spatial distribution can’t be precisely performed.
Marine turtle population surveys are still recent in Central Africa and the knowledge on the population reproductive parameters such as remigration interval and clutch frequency has to be expanded. A reliable female population size estimation based on annual nest numbers is thus not yet possible. Nevertheless, we estimate that around 35,000 annual nests of leatherback are deposited along the studied Central African sites. The olive ridley nesting activity along the Atlantic coast of Central Africa is mainly estimated to 5,000 annual nests. Both green turtle and hawksbill nesting activity seem inferior to 1,000 annual nests.
According to the mathematical adjustment of the last 8 nesting seasons, nesting season occurrence appears year-dependent and a weak geographic-dependence, at least at a country scale, is also observed. Moreover, a leatherback nesting activity synchrony has been shown in geographically distant sites as demonstrated with common low 2003-2004 and 2004-2005 nesting activities. This large scale phenomenon also known as the Moran effect [25, 34] has been observed along a major part of Central Africa nesting sites. Female exchanges across Central African nesting sites have been observed [42]. The above states 3 key observations: the weak country effect, the Moran effect and the inter-country female exchanges clearly imply that the spatial scale for any marine turtle study is at least the Central Africa scale. Thus, having defined the most appropriate work scale to be used from now forth, conservation actions should be set up globally for the region.
Central African leatherback and olive ridley nesting populations have been identified as stable over the past 8 years. Nevertheless their trends appear contrasted among the diverse countries included in the study at least for leatherbacks. The highest aggregation is observed in Gabonese coast and it shows the highest rate of decline. A contratio, Congolese nests are increasing but their modest level compared to Gabonese ones does not plaid for a change of nesting site of leatherbacks. Heterogeneous threat levels and/or conservation programs effectiveness along their different habitats can thus be assumed. Marine turtles migrate widely across international waters and transatlantic migrations by nesting female leatherbacks are now known [7]. Feeding areas of the Central African nesting populations have to be identified to ensure an integral population protection strategy [37].
Some major threats affect sea turtles along the Atlantic coast of Africa. They consist of direct exploitation, such as intentional and incidental capture, as well as indirect threats like habitatdestruction by human activities. In conjunction with current conservation activities, research on Central African population dynamics and threat factors is necessary in order to identify conservation priorities and set up new key actions.
Due to important marine resources offered by the region, a large part of incidental turtle catches done by international commercial fisheries occurs in the Gulf of Guinea waters. The major threat comes from East Asian fisheries which are particularly active in the region between Ghana and Gabon [12]. This leads to a large number of sea turtle captures with an important impact on Southern Gabon and Northern Congo Olive Ridley and Leatherback populations [33]. It appears important to quantify marine turtle by catch by efficient methods such as the presence of on-board observers on the fisheries [24]. Today more than 50 different observer programs are operating in the world oceans with a new one recently started in Ghana by NOAA scientists (4). This information will allow for the identification of areas with high fishery pressure.
The Gulf of Guinea is the focus of extensive and rapidly increasing oil exploitation in areas that also hosts important sea turtle habitats (Corisco Bay, São Tome). This activity is associated with pollution and habitat destruction which has not been characterized [12]. Nesting female disorientation by artificial lighting is also a source of threats [8]. Moreover, forest exploitation represents one of the main sources of income in the region but timber lost at sea, and later washed onshore occurs frequently. This phenomenon has been reported on the Gamba Complex beaches and is presumed to be the most important in the Northern Gabon and on the Equatorial Guinea coasts [30]. It could causes injuries or death by dehydration to nesting females but exact quantification of this threat is still missing. Future research should better characterize oil and timber impact on marine turtles populations and their habitats and determinate action priorities if necessary.
Central African green and hawksbill population stocks and status are still unknown. Nesting beach monitoring has to continue to provide valuable information on the status of all marine turtle species in the region. It is recommended to plan beach surveys covering the whole nesting seasons of the four species, from August to May. An annual strategy represents an opportunity to generate a sustainable local collaboration. Moreover, it can be coupled with an annual dissuasion and education work in order to reduce poaching. Despite the establishment of full or partial sea turtle legal protections, local use of marine turtle meat and eggs are still widespread. Two kinds of poaching can be differentiated. One represents a way to procure a primary source of protein [5,38, 40] and the other is dedicated to commercial activity. Large towns have proved to create high pressure hunting areas [3].
This last decade, a large panel of sea turtle conservation initiatives has been established in Africa [12]. Due to their political stability, some Central African countries (São Tome and Principe, Gabon) attempt to develop ecotourism activities [39]. Furthermore, a public awareness campaign conducted for foreigner tourists have led to a reduction of the shell trade in São Tome and Principe. Another successful example is the communication operation conducted to fishermen from some villages in the Republic of Congo. Unfortunately, financial support represents often a major constrain restricting the set-up and continuity of some efficient initiatives. It remains essential to develop and support successful conservation initiatives taking into account local economic and socio-cultural contexts.
We have to remind that all threatening factors encountered in the Gulf of Guinea have a great impact on the survival of marine turtle populations sharing feeding areas in the Gulf of Guinea. Leatherback and olive ridley trends appear promising but have to be taken with caution considering the uncertainty on Central African marine turtle populations. Indeed, the duration of each time series affects the precision of the estimated trend and so surveys have to be prolonged to get most accurate and reliable assessments. Although it is possible to derive total seasonal nesting effort from parsimonious counts at ground monitoring locations [26, 27, 36] or even from aerial survey [41], it is important to recall that field patrols by local teams are also a way to finance local communities. Using few aerial surveys during a nesting season and mathematical modeling, it is possible to get a precise estimate of the nesting activity. But the financial input to the local communities will end and they could turn again to exploit marine turtles. Furthermore, the power to detect change in seasonality is low when less than 10 aerial surveys are done per year as proposed by Witt at al. (2009) [41]. It will leave us without a thorough knowledge of the inter-annual change in spatial distribution of nesting and its temporal variability. In the context of global change, this picture could be missing to understand change of spatial distribution for nesting marine turtles. Such a situation has been the reason of the erroneous claim of declining in French Guianan leatherbacks in the 90’s [19].
We are facing a key point for marine turtle conservation along the Central African Atlantic coast. We have now first estimates of stock levels for marine turtles. Measures have to be considered to maintain the hereby-detected stock stability. Local initiatives must then focalize on threats prioritized by their quantified impact. However such quantification is still missing for marine turtles in Central Africa. Conservation must be based on precise objectives defined after scientific analyses rather than on longstanding practice.
Acknowledgements
We would like to thank the members of local associations and international organizations for the marine turtle surveys and for the general work done on conservation activities. Financial support comes from the European community and the RAPAC organization. This paper has benefited by a closer reading and English correction from Damian Delev and Anna Han. The manuscript has also greatly benefited from the comments of Mariana Fuentes and Mark Hamann.
References
- Abt M, Welch WJ (1998) Fisher information and maximum-likelihood estimation of covariance parameters in Gaussian stochastic processes. Can J Stat-Rev Can Stat 26(1): 127-137.
- Akaike H (1974) A new look at the statistical model identification. IEEE Trans Autom Control 19(6): 716-723.
- Angoué C, Assoko Ndong A, Binot A, Carette S (2003) Les peuples desfôrets tropicales aujourd'hui. In: Programme Avenir des Peuples des Forêts Tropicales. Bruxelles, Belgium. 301-354.
- Anonymous (2008) News and Legal briefs. NOAA scientists train fishing observers in Ghana. Marine Turtle Newsletter 120: 22-25.
- Apaza L, Wilkie D, Byron E, Huanca T, William Leonard, et al., (2002) Meat prices influence the consumption of wildlife by the Tsimane’ Amerindians of Bolivia. Oryx 36(4): 382-388.
- Dakar workshop (2002) Regional Action Plan for the conservation of marine in West Africa (2003-2007).
- Billes A, Fretey J, Verhage B, Huijbregts B, Bruno Giffoni, Laura Prosdocimi, et al., (2006) First evidence of leatherback movement from Africa to South America. Marine Turtle Newsletter 111: 13-14.
- Bourgeois S, Gilot-Fromont E, Viallefont A, Boussamba F, Sharon L. Deemd (2009) Influence of artificial lights, logs and erosion on leatherback sea turtle hatchling orientation at Pongara National Park, Gabon. Biol Conserv142(1): 85-93.
- Burnham KP, Anderson DR (1998) Model selection and inference. A practical information-theoretic approach. (2nd edn), Springer-Verlag, New York, US.
- Dutton DL, Dutton PH, Chaloupka M, Boulon RH (2005) Increase of a Caribbean leatherback turtle Dermochelys coriacea nesting population linked to long-term nest protection. Biol Conserv 126(2): 186-194.
- Edwards AWF (1972) Likelihood. Cambridge University Press, Cambridge, England
- Formia A, Tiwari M, Fretey J, Billes A (2003) Sea turtle conservation along the Atlantic coast of Africa. Marine Turtle Newsletter 100: 33-37.
- Frazier J (2003) Prehistoric and ancient historic interactions between humans and marine turtles. In: Lutz PL, Musick JA, Wineken J (eds) The Biology of Sea Turtles. CRC Marine Biology Series, Boca Raton. 1-38.
- Fretey J (2001) Biogeography and conservation of marine turtles of the Atlantic coast of Africa. UNEP/CMS Secretariat, Bonn, Germany. 429.
- Fretey J, Girardin N (1988) La nidification de la tortue luth, Dermochelys coriacea (Vandelli, 1761) (Chelonii, Dermochelyidae) sur les côtes du Gabon. Revue Zool afr - J Afr Zool 102(2): 125-132.
- Gerrodette T, Taylor BL (1999) Estimating population size. Research and management techniques for the conservation of sea turtles. IUCN/SSC Marine Turtle Specialist Group Publication, Washington, DC. 4: 67-71.
- Girondot M (2010) Estimating density of animals during migratory waves: application to marine turtles at nesting site. Endangered Species Research 12: 95-105.
- Girondot M (2016) Phenology: Tools to Manage a Parametric Function that Describes Phenology. In: The Comprehensive R Archive Network. 1-59.
- Girondot M, Godfrey MH, Ponge L, Rivalan P (2007) Modeling approaches to quantify leatherback nesting trends in French Guiana and Suriname. Chelonian Conserv Biol 6(1): 37-46.
- Girondot M, Rivalan P, Wongsopawiro R, Briane J-P (2006) Phenology of marine turtle nesting revealed by a statistical model of the nesting season. BMC Ecology 6: 11.
- Girondot M, Rizzo A (2015) Bayesian framework to integrate traditional ecological knowledge into ecological modeling: A case study. J Ethnobiol 35(2): 337-353.
- Godgenger M-C, Bréheret N, Bal G, N’Damité K, Marc Girondot, et al.,(2009) Nesting estimation and analysis of threats for Critically Endangered leatherback Dermochelys coriacea and Endangered olive ridley Lepidochelys olivacea marine turtles nesting in Congo. Oryx 43(04): 556-563.
- Graff D (1996) Sea turtle nesting and utilization survey in São Tomé. Marine Turtle Newsletter 75: 8-12.
- Hall MA, Alverson DL, Metuzals KI (2000) By-catch: Problems and solutions. Mar Pollut Bull 41(1): 204-219.
- Hudson PJ, Cattadori IM (1999) The Moran effect: a cause of population synchrony. Trends Ecol Evol 14: 1-2.
- Jackson AL, Broderick AC, Fuller WJ, Glen F, Graeme D. Ruxton, Brendan J. Godley (2008) Sampling design and its effect on population monitoring: How much monitoring do turtles really need? Biol Conserv 141(12):2932-2941.
- Kerr R, Richardson JI, Richardson TH (1999) Estimating the annual size of hawksbill (Eretmochelys imbricata) nesting populations from mark-recapture studies: the use for long-term data to provide statistics for optimizing survey effort. Chelonian Conserv Biol 3(2): 251-256.
- Lasdon LS, Waren AD (1981) GRG2 - An all FORTRAN general purpose nonlinear optimizer. ACM Sigplan Bulletin 30(30): 10-11.
- Lasdon LS, Waren AD, Jain A, Ratner M (1978) Design and testing of a Generalized Reduced Gradient code for nonlinear programming. ACM Trans Math Softw 4(1): 34-50.
- Laurance WF, Fay JM, Parnell RJ, Sounguet G-P (2008) Does rainforest logging threaten marine turtles? Oryx 42(2): 246-251.
- Lebigre J-M (1983) The coastal Gabon : geomorphological and biogeographical . National Pedagogical Institute, Libreville, Gabon. 58.
- Lloyd-Smith JO (2007) Maximum likelihood estimation of the negative binomial dispersion parameter for highly overdispersed data, with applications to infectious diseases. PLoS One 2: e180.
- Parnell R, Verhage B, Deem SL, Leeuwe HV, Tomoaki Nishihara, Clement Moukoula (2007) Marine turtle mortality in Southern Gabon and Northern Congo. Marine Turtle Newsletter 116: 12-14.
- Ranta E, Kaitala V, Lindström J, Helle E (1997) The Moran effect and synchrony in population dynamics. Oikos 78(1): 136-142.
- BAL G, BREHERET N (2005) Progress report of the program of study and protection of marine turtles in Congo. 2004/2005. Rénatura Kudu Programme,Congo.30.
- Sims M, Bjorkland R, Mason P, Crowder LB (2008) Statistical power and sea turtle nesting beach surveys: How long and when? Biol Conserv 141(12): 2921-2931.
- Tiwari M (2002) An evaluation of the perceived effectiveness of international instruments for sea turtle conservation. Journal of International Wildlife Law and Policy 5(1-2): 145-156.
- Trefon T, de Maret P (2000) Snack nature dans les villes d’Afrique centrale. In: Bahuchet S, Bley D, Pagezy H, Vernazza-Licht N (eds) L'homme et la forêt tropicale. Editions de Bergier, Châteauneuf de Grasse, France. 559-572.
- Verhage B, Moundjim EB, Livingstone SR (2006) Four years of monitoring sea turtles in the complex of protected areas Gamba , Gabon. 1-77.
- Wilkie DS, Starkey M, Abernethy K, Effa EN and others (2005) Role of prices and wealth in consumer demand for bushmeat in Gabon, Central Africa. Conserv Biol 19(1): 268-274.
- Witt MJ, Baert B, Broderick AC, Formia A, Jacques Fretey, Alain Gibudi (2009) Aerial surveying of the world’s largest leatherback turtle rookery: A more effective methodology for large-scale monitoring. Biol Conserv 142(8): 1719-1727.
- Witt MJ, Broderick AC, Coyne MS, Formia A (2008) Satellite tracking highlights difficulties in the design of effective protected areas for Critically Endangered leatherback turtles Dermochelys coriacea during the inter-nesting period. Oryx 42(2): 296-300.


