New Features to Increase the Thermopower in Magnetic Semiconductors
LI Koroleva1*, AS Morozov1, IK Batashev1, AM Balbashov2
1 Moscow State University, Moscow, Russia.
2 Moscow Power Institute, Moscow, Russia.
*Corresponding Author
LI Koroleva,
Moscow State University, Moscow, Russia, 119991.
E-mail: koroleva@phys.msu.ru
Received: June 29, 2016; Accepted: August 03, 2016; Published: August 06, 2016
Citation: LI Koroleva, AS Morozov, IK Batashev, AM Balbashov (2016) New Features to Increase the Thermopower in Magnetic Semiconductors. Int J Magn Nucl Sci. 2(2), 11-15. doi: dx.doi.org/10.19070/2577-4387-160003
Copyright: LI Koroleva© 2016. This is an open-access article distributed under the terms of the Creative Commons Attribution License, which permits unrestricted use, distribution and reproduction in any medium, provided the original author and source are credited.
Abstract
In this paper thermopowerS, magnetothermopower ΔS/S were studied in single-crystal Sm(1-x)SrxMnO3(0.15≤x≤0.3). It is known that these compounds consist of ferron-type ferromagnetic clusters in A-type antiferromagnetic matrix. A sharp increase of S and module of negative ΔS/S were discovered near Curie temperature TC, where they achieve giant values. So| ΔS/S|=94.5% in magnetic field 13.23 kOe. This means that thermopower is caused by presence of ferrons, as the value of the thermopower slumps with ferrons’ destruction caused by magnetic field or heating over TC. Therefore thermopower in doped magnetic semiconductors is determined by level of doping and volume of the sample. So after dividing the sample in two parts thermopower of each part decreased proportionally the volume of the sample. Thus, in doped magnetic semiconductors the value of thermopower can be considerably increased by enlarging the volume of sample, the level of dopingand can be controlled by magnetic field.
2.Materials and methods
3.Results and Discussion
4.References
Introduction
Today a practical application of thermoelectricity is considerably constrained because of a low efficiency that depends on S2:
Z=S2/ρk, ------ (1)
S is thermopower, ρ – electrical resistivity, k – coefficient of thermal conductivity. In present time there are lots of papers about increasing of Z but unfortunately there is no progress in this field. Increased value of S that was about hundreds of mV was observed in some manganite near Curie temperature [1-3]. Authors explain this value of S by presence of polarons of small radius at Curie temperature. It is known, that polarons of small radius are observed in nonmagnetic semiconductors. Authors of [1-3] do not explain appearance of polarons only at Curie temperature in magnetic semiconductors.
As is well known, interest in magnetic semiconductors was caused by giant magnetoresistance and volume magnetostriction that were observed near Curie temperature [4-6]. Nowadays most of researches explain these effects by presence of special magnetic impurity conditions called ferrons. Theory of ferrons was developed in [7-10]. A donor electron is localized near it because of the gain in s-d exchange energy and creates around impurity a ferromagnetic region. A crystal lattice is compressed in ferrons [10]. In ferromagnetic semiconductors ferrons exist in Curie temperature region, where long-range ferromagnetic order is partially or completely destroyed and with further heating ferrons are destroyed very rapidly. In antiferromagnetic semiconductors the electron density near impurities is increased, so crystal is antiferromagnetic matrix, deprived of charge carriers, in which symmetrically located ferromagnetic spheres. These spheres are collective ferrons in which the electron density is increased. It must be emphasized that here the notion of Curie temperature is very arbitrarily. It is the temperature of the disruption of ferromagnetic order in the clusters of ferrons type.
Materials and methods
In this paper thermopower S and magnetothermopower ΔS/S were studied in Sm (1-x) SrxMnO3 (x= 0.15, 0.2, 0.25, 0.3). The samples are A-type antiferromagnetic SmMnO3 doped by Sr. Single-crystalline samples were grown using crucibleless floating zone melting. A temperature gradient of 5 K across the sample for the thermopower and magnetothermopower measurements was created using the electrical furnace on one end of the sample. Three copper-constantan thermocouples were used: to measure temperature difference between hot and cold ends of the sample and temperature at the middle of the sample. Measurements of thermopower were carried out by analog-to-digital converter NI- 9211 allowing to measure small value of voltage with the relative measurement error 0.05% and input resistance 20MOhm. The electric resistivity and magnetoresistance were also studied on this complex.
The magnetization of the sample was measured with SQUID magnetometer. By studying data of neutron and electron diffraction in [11-15] it was found that compounds with x<0.33 consist of ferron-type ferromagnetic clusters, arranged in A-type antiferromagnetic matrix.
Results and Discussion
Figure 1 shows the temperature dependence of the magnetization M(T) in different magnetic fields of composition with x = 0.3. It's seen that the transition from ferromagnetic to paramagnetic state is heavily blurred. It follows that it is a magnetically heterogeneous sample. The Curie temperature of this sample TC = 87 K is defined as the temperature of minimum on dM(T)/dT curve, measured in magnetic field 0.1 kOe. It should be noted that the concept of the Curie temperature here is very conditional: it is the Curie temperature of the ferromagnetic clusters (ferrons). Similar magnetization measurements were carried out on samples with x = 0.15, 0.2, 0.25. M(T) curves of these samplesare very similar to observed one in the composition with x = 0.3. Their Curie temperatures are close to TC = 87 K of the composition with x = 0.3. They are presented in table and almost coincide with data given in [14].
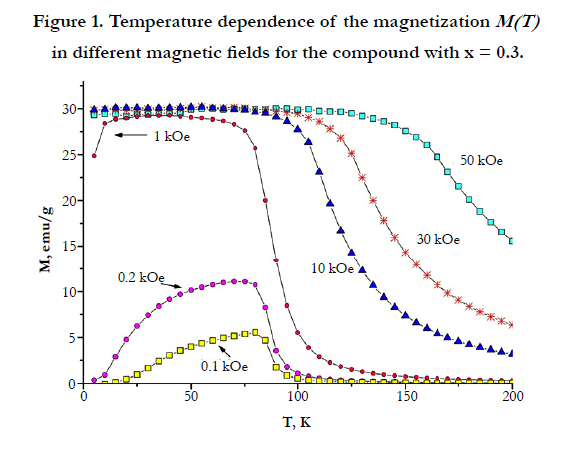
Figure 1. Temperature dependence of the magnetization М(T) in different magnetic fields for the compound with х = 0.3.
Figure 2 shows the temperature dependence of thermopower S(T) in different magnetic fields in the sample with x = 0.3 and geometric dimensions 11 mm x 2.5 mm x 3 mm. This figure shows that the thermopower reaches a giant value of 18 mV/K in the area of TC = 87 K, and decreases rapidly above this temperature. Figure 3 shows the temperature dependence of magneto thermopower { ΔS/S}(T) for this sample in different magnetic fields. It's clear that magneto thermopower is negative and its absolute value near TC reaches a giant value of 94.5% in a magnetic field 13.23 kOe. A similar behavior of the thermopower and magneto thermopower was observed in compositions with x = 0.15, 0.2, 0.25. Maximum values of S and | ΔS/S| were observed near TC and presented in Table 1, which shows that in all studied samples quantities of maxima reach giant values. Figure 5 and Figure 6 show the temperature dependences of resistivity ρ and magneto resistance Δρ/ρ of sample with x = 0.3 which are typical of samples with x = 0.15, 0.2, 0.25. All of compositions near the Curie temperature have a giant increase of the resistivity ρ and the absolute value of negative magneto resistance Δρ/ρ, typical for doped magnetic semiconductors, which most of the researchers explain by the existence of impurity ferrons. Maximum values of ρ and Δρ/ρ in all studied samples are shown in Table 1. It should be noted that curves ρ(T) and S(T) and Δρ/ρ(T) and ΔS/S{T} have similar behavior. This indicates that they are caused by the same reason - the existence of ferrons.
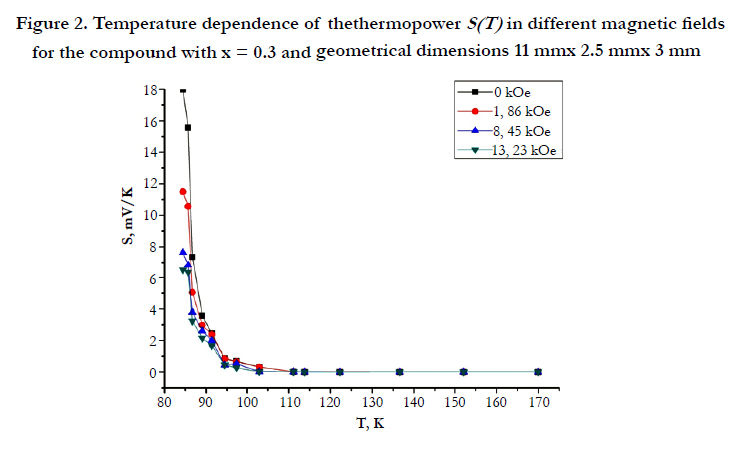
Figure 2. Temperature dependence of thethermopower S(T) in different magnetic fields for the compound with х = 0.3 and geometrical dimensions 11 mmх 2.5 mmх 3 mm
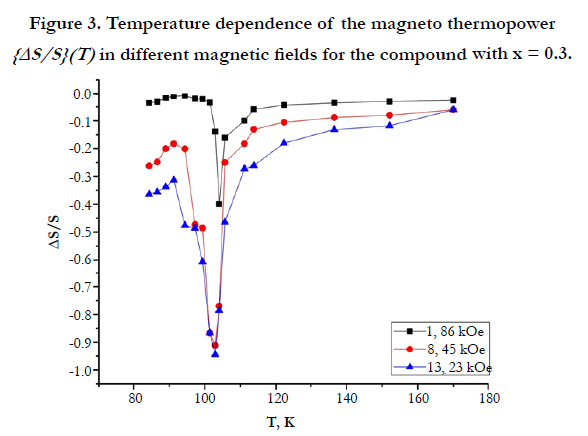
Figure 3. Temperature dependence of the magnetothermopower {ΔS/S}(T) in different magnetic fields for the compound with х = 0.3.
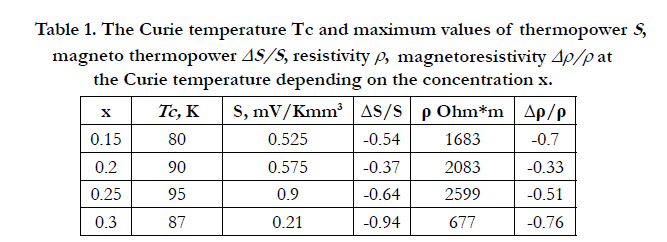

Table 1. The Curie temperature Тс and maximum values of thermopower S , magnetothermopower ΔS/S , resistivity ρ , magnetoresistivity Δρ/ρ at the Curie temperature depending on the concentration x.
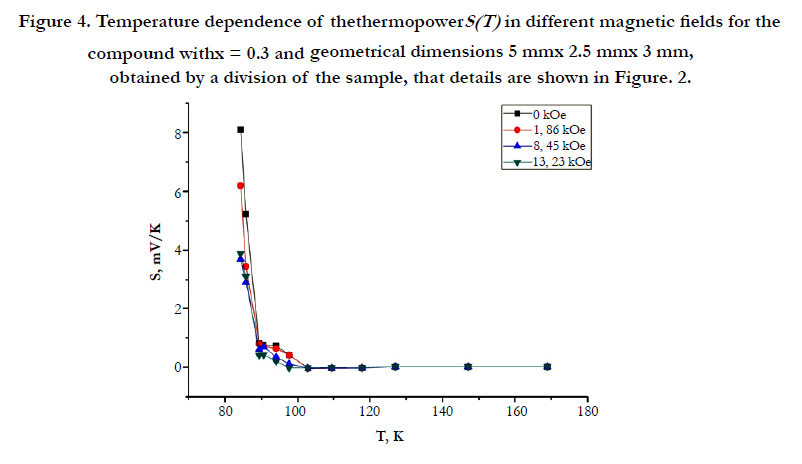

Figure 4. Temperature dependence of the thermopower S(T) in different magnetic fields for the compound with х = 0.3 and geometrical dimensions 5 mmх 2.5 mmх 3 mm, obtained by a division of the sample, that details are shown in Figure. 2.
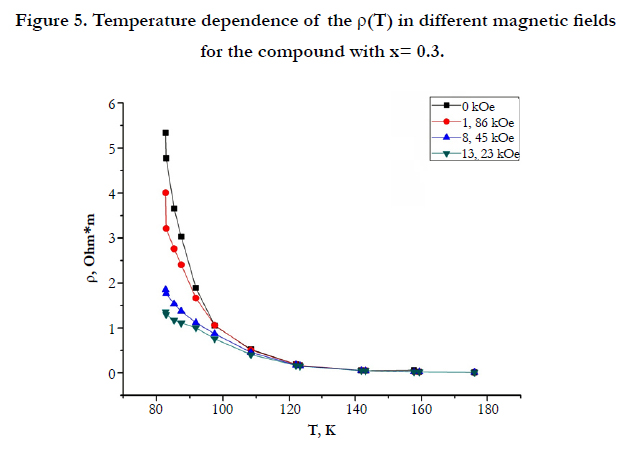
Figure 5. Temperature dependence of the ρ(T) in different magnetic fields for the compound with х= 0.3.
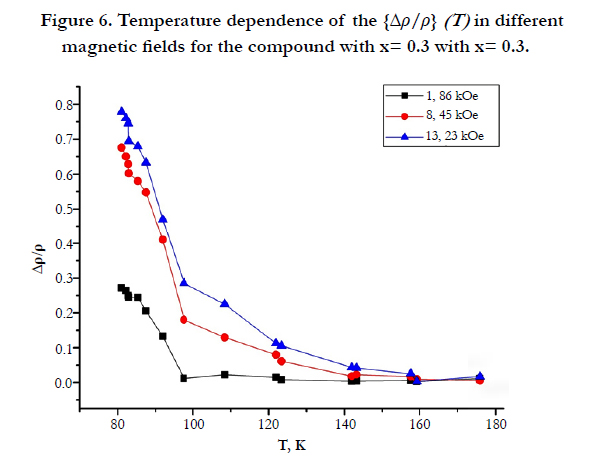
Figure 6. Temperature dependence of the {Δρ/ρ} (T) in different magnetic fields for the compound with х= 0.3 with х= 0.3.
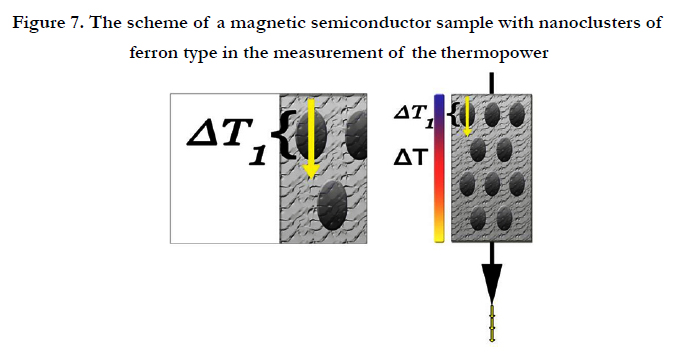
Figure 7. The scheme of a magnetic semiconductor sample with nanoclusters of ferron type in the measurement of the thermopower.
The presence of giant thermopower and negative magnetothermopower detected in the manganite compounds means that thermoelectric power in it is mainly caused by ferrons, as thermopower sharply decreases with the thermal destruction of ferrons or destruction of its by a magnetic field. This is confirmed by the following experience. Figure 4 shows the temperature dependence of the thermopower in different magnetic fields for 5 mm x 2.5 mm x 3 mm sample with x = 0.3, obtained after cutting the sample which data was shown on Figure 2. It is seen that a decrease of volume in 2.2 times cases reduction of the thermopower in 2.2 times from 18 mV/K to 8.1 mV/ K. This means that the thermopower must be specified per unit volume to compare the thermopower in different compounds, i.e., indicate the specific thermopower Maximum values of S and |ΔS/S| were observed near TC and presented in Table 1, which shows that in all studied samples quantities of maxima reach giant values. However, as can be seen from Table1, the value of the specific thermoelectric power increases with the impurity concentration up to x = 0.3 at which it decreases, but still remains a very large. Apparently in the composition with x =.0.3 begin to appear antiferromagnetic clusters with CE-type antiferromagnetic ordering, in which there is a charge-orbital ordering These new clusters to partially displace ferrons and lower thermopower sample. It is known that in compounds with 0.4≤ x≤ 0.5 these clusters occupy a large part of the sample [11, 12]. Thus, the magnitude of the thermoelectric power can be greatly increased by enlarging of the volume of the sample. As known, in nonmagnetic semiconductors thermopower does not depend on the sample’s volume.As is shown in Figure 7, thermopower S1 appears on every single ferron under the influence of local temperature gradient ΔT1, made from total temperature gradient ΔT. Each of these microregions makes a contribution (S1 - S2) in the thermopower of the whole sample, here S2 – thermopower of antiferromagnetic matrix in the absence of ferrons. So, ferrons’ contribution affect the efficient value S of the whole sample. Hence, it follows that the thermopower in doped magnetic semiconductor is determined by of the doping concentration and the volume of the sample. Due to the implementation of the law of conservation of energy, we can assume that the gradients ΔT1 on ferrons created by lowering the coefficient of thermal conductivity.It is well known that phonons become more anharmonic with the increase of weight of atoms or atomic groups that form the crystal. This increased anhormonicity leads to lower coefficient of thermal conductivity. Ferrons are one of such groups because in ferrons lattice is compressed. Thus, the presence of impurity ferrons in the magnetic semiconductor causes a sharp increase of the thermopower in it and reduces the coefficient of thermal conductivity, which, according to equation (1), leads to increasing of efficiency. Thus, the magnitude of the thermoelectric power can be greatly increased by enlarging of the volume of the sample. As known, in nonmagnetic semiconductors thermopower does not depend on the sample’s volume.
Thus, in doped magnetic semiconductors, which include manganites, the value of thermopower can be significantly increased,in comparison with undoped one, by increasing the concentration of impurities and the volume of the sample. In addition the value of thermopower can be controlled by the magnetic field.
References
- A Hassen, P Magdal. (2007) Correlation between structural, transport, and magnetic properties in Sm1−xAxMnO3 (A=Sr,Ca). Journal of Applied Physics 101: 113917.
- Joy Lija K, S Shanmukharao Samatham, Senoy Thomas, V Ganesan, Salim Al-Harthi, et al., (2014) Colossal thermoelectric power in charge ordered lanthanum calcium manganites (La0.5Ca0.5MnO3). J App Phy. 116:213701.
- Sagar S, Ganesan V, Joy (2010) P.A.Colossal thermoelectric power in Gd-Sr manganites. Europhysics Letters 91:17008.
- Abramovich AI, Koroleva LI, Michurin AV (2002) Peculiarities of the magnetic, galvanomagnetic, elastic, and magneto elastic properties of Sm1−xSrxMnO3 manganites. JETP 95: 917.
- Koroleva LI (2003) Magnetic semiconductors, MSU Physics Department publishing house, Moscow, 312.
- Shiffer P, Ramirez A, Bao W, Cheong SW (1995) Low temperature magneto resistance and the magnetic phase diagram of La1−xCaxMnO3.Physical Review Letters 75: 3336.
- Nagaev EL (1968) Ferromagnetic Domains in a Semiconducting Antiferromagnet. JETP 27: 122.
- Nagaev, EL Colossal (2001) Magnetoresistance Materials: manganites and conventional ferromagnetic semiconductors. Phys. Rep. 346: 387-531.
- Kаsuya Т, Yanase A (1968) Anomalous transport phenomena in Eu-chalcogenide alloys. Rev. Mod. Phys. 40: 684.
- Dagotto E, Hotta T, Moreo A (2001) Colossal magnetoresistantmaterials: the key role of phase separation. Phys. Rep 344: 1-153.
- Runov V.V. (2000) Mesoscopic magnetic inhomogeneities in the low-temperature phase and structure of Sm1−xSrxMnO3 (x < 0.5) perovskite.JETP 91: 1174.
- Runov VV (1999) Spin correlations and magnetonuclear cross-correlation in Sm(Sr)-Mn-O perovskites in the low-temperature phase. JETP Letters 69: 353-360.
- Runov VV (2000) Small-angle polarized neutron scattering in Sm1−xSrxMnO3 (x<0.5) perovskite. Physica B 795: 276-278.
- Martin C, Maignan A, Hervieu M, Raveau B (1999) Magnetic phase diagrams of La1−xCaxMnO3 manganites (L=Pr, Sm; A=Ca, Sr). Phys. Rev.B 60: 12191.
- Koroleva LI, Morozov AS, Jakhina ES, Balbashov AM (2015) Connection of thermopower and giant magnetot hermopower with magnetic and structural heterogeneity in Sm0.55Sr0.45MnO3 manganite. JMMM 396: 146.


