Commuting Maps and Commuters Behavior in the Moscow Region: GIS Approach
Shitova Y1,2*, Shitov Y2
1 Department of Economics, The "Dubna" International University for Nature, Society and Man, Dubna, Russia.
2 Department of Economics, Management and Law, Russian State University for the Humanities, Moscow, Russia.
*Corresponding Author
Dr. Yulia Shitova
Department of Economics,
The "Dubna" International University for Nature,
Society and Man, Dubna, Russia.
E-mail: yu_shitova@mail.ru
Received: September 07, 2017; Accepted: October 11, 2017; Published: October 12, 2017
Citation: Shitova Y, Shitov Y. Commuting Maps and Commuters Behavior in the Moscow Region: GIS Approach. Int J Mechatron Autom Res. 2017;1(1):1-7.
Copyright: Shitova Y© 2017. This is an open-access article distributed under the terms of the Creative Commons Attribution License, which permits unrestricted use, distribution and reproduction in any medium, provided the original author and source are credited.
Abstract
Labor mobility is one of the key factors which affect the quality of regional economic development. This work has been devoted to the study of commuting patterns in Moscow region (MR) using unique self-produced micro data set, which includes 0.8 million workers (60 percent of working-age population of MR). Statistical and GIS-methods have been used to visualize commuting patterns in MR as well as study individual behavior of commuters in relation to gender, age and income. It was found that women travel to smaller distances than men. Wage discriminations by gender and age were confirmed and estimated quantitatively. It has been found that the farthest and longest trips are made by commuters who are 22 to 30 years old, after which mobility decreases steadily with age. Highly skilled commuters with high wages commute farther and longer than low skilled and low paid workers, as it is expected in most commuting models. Finally, perspectives of the proposed techniques of investigation of commuting patterns are discussed.
2.Labor Mobility and Commuting
3.GIS Technologies in the Analysis of Commuting
3.1 Spatial Approach
3.2 Analytical Approach
3.3 Analysis of GIS Maps
3.4 GIS analysis of GPS Data
4.Method of GIS Processing
5.Visualized Patterns of Commuting
5.1 Home and Work Location Maps
5.2 Commuters’ Transportation Map
6.Individual Characteristics of Commuters
6.1 Gender
6.2 The effect of Public transport
6.3 Age
6.4 Income
7.Acknowledgement
8.References
Keywords
Commuting; GIS; Spatial Pattern; Gender; Age; Income; Regional Economy
Labor Mobility and Commuting
The timeliness of commuting research is closely related to the necessity of monitoring and controlling of commuter routes. Qualitative management and control of labor mobility is a key factor in efficient economic development at any level (a company, a region, and a state) since implementation of any project is highly dependent on the presence and quality of the available human capital. It is uncontroversial that range and intensity of commuting in large modern agglomerations demonstrates a significant macro influence on the socioeconomic situation in the region, as had been demonstrated in a set of our earlier research [12-17]. But on the other side there is a huge lack of experimental data related to developing countries in this field. The main problem is prohibitively high costs of any studies aimed to collect commuting data in conditions of limited funding. As a result, contrary to intensive research on commuting in the cities worldwide, there are no empirical studies of commuting in Russian cities.
The present study is aimed to fill this gap analyzing working behavior of almost 60% of working age population of Moscow region using unique self-produced micro data set, which has been reconstructed from a set of Russian database data leaked to Internet. Living and working locations linked with personal data (age, gender, and income) are available for each person in the database. The present paper develops a new approach to the analysis of commuting that involves implementation of GIS (Geographic Information System) processing technologies on the geospatial data-living and working locations of commuters in MR. This elevates commuting studies to a new qualitative level in order to address a number of empirical and theoretical problems. Next section gives a short review of implementation of GIS-approach to commuting studies, and the visualized patterns of commuting are presented in the third section. The fourth section is aimed to describe the GIS-method which was used, while statistical results obtained by it are discussed in fifth section. Final section concludes the results.
GIS Technologies in the Analysis of Commuting
GIS technologies are usually used in two following approaches of commuting studies.
Visualization of commuter home-workplace routes enables the creation of a spatial pattern of population labor mobility (direction, length and intensity), identification of districts of labor attraction and outflow, analysis of the disproportion between supply (place of residence) and demand (place of work), and estimation of the traffic intensity on transport routes.
An analytical approach is possible if GIS information is linked to the individual characteristics of commuters (gender, age, income, etc.) and/or their employers (industry, form of ownership, enterprise size, etc.) at the micro level. In this case, it is possible to analyze the social structure of the commuters and the impact of individual factors on labor mobility as well as characteristics of the businesses attracting commuters.
However, desperate shortage of data remains the main problem of application of GIS analysis techniques. Therefore, despite generally high interest in the analysis of commuting (about one hundred research articles per year) GIS technologies are only used in a tiny number of them. Furthermore, in most of these papers GIS is applied for aggregation of spatial variables, such as comparative weight of districts according to area, average time estimation, route lengths over the region, etc. The calculated variables were then used in multiple regression analyses. As examples one can mention the research of the spatial interaction of housing and labor markets in North West England [5] and intra-urban variation of commuting time and distance in Columbus Ohio, USA [18]. However, in these studies GIS was used as a subsidiary tool.
A direct spatial approach was applied to map commuting transport routes in New York and Amsterdam using the full power of GIS technologies [1]. A good example of an analytical approach is the research of the interregional migration of British students, where the geography of school-university-first job shifts was estimated using GIS platform [3]. One of the most extensive studies is an analysis of ecological influence (carbon dioxide emission) on the environment depending on commuter journeys and alternative transport movement models and scenarios based on GIS data (residential and working addresses of 1829 people surveyed) from a special transport survey made by the Vodafone company [20]. It is also worth mentioning the GIS analysis of commuter flows using intraday bicycle commuting data [16].
GIS-based studies related to the topic of the present research mostly focus on the following two directions.
Analysis of GIS maps via graphical identification of natural and artificial landscape objects on the maps with the purpose of reconstructing nature or human activity patterns and analyzing them further. Examples include comparative analysis of structure and economic force of the regions of China as a whole and the development of agricultural districts in the province of Guangxi in particular [18, 19]; research (simulations) of Madrid agglomeration growth scenarios [9]; comparative analysis of economic development of the administrative districts of Romania [7]; analysis of land use for ecotourism planning in Thailand [2].
GIS analysis of GPS data, gathered from moving objects under study (cars, public transport, etc.), for example analysis of the interaction of participants with the transport network in Minnesota [6, 11, 21]. However, such surveys are more related to transport assessment and modeling than commuting and are aimed to study driver behavior.
The research method developed in this paper combines microanalysis with GIS technologies to provide an innovative and unique approach to fine details of the commuting process that still remains an open question. Combining analysis of commuting patterns in Moscow region with individual behavior of commuters is the key to the power of the method proposed and discussed further.
Method of GIS Processing
The basis of this research is a unique micro dataset for the year 2001 covering 60 per cent of working-age population of Moscow region. The original data were from databases (DB) of the Tax inspectorate of the Russian Federation (RF), the Pension Fund of the RF and the State Register of Russian Enterprises. These confidential data have leaked to internet due to illegal actions of unknown persons. With these data in the public domain, and our methods of statistical analysis preventing disclosure of personal information, it has been decided worth to use this unique information (unavailable by any other means) for scientific purposes. The primary data from different DBs have been merged using key field-employee’s TIN (Tax Identification Number) present in all DBs. It was used to link the places of residence (PR) and work (WP) with employee personal data (PD: annual income, age and gender) and employer characteristics (EC: activity status, form of ownership, capital, etc.). As a result, a secondary DB has been created, which contains almost one million records of employees in the following format:
Employee (WP, PR, PD, EC)-----(1)
At the next stage GIS technologies are used to reconstruct the house-workplace route of each commuter. A special web application for Yandex maps platform (http://api.yandex.ru/maps) had been created for this purpose. For each commuter this program reconstructs a path on the regional transport network between the commuter’s PR and WP determined by postal addresses in the DB (1). In fact, the program solves the navigation task in the same way as a usual (car or hand) navigator does. The principal difference is that developed application is working in semi-batch mode processing large scale datasets and returning quantitative data on reconstructed routes for thousands of records. In comparison, a typical navigator works in a single interactive mode with manual input and graphical output. Examples of the results obtained by our program are shown in Figure 1. After GIS-processing the data have been obtained in the following format:
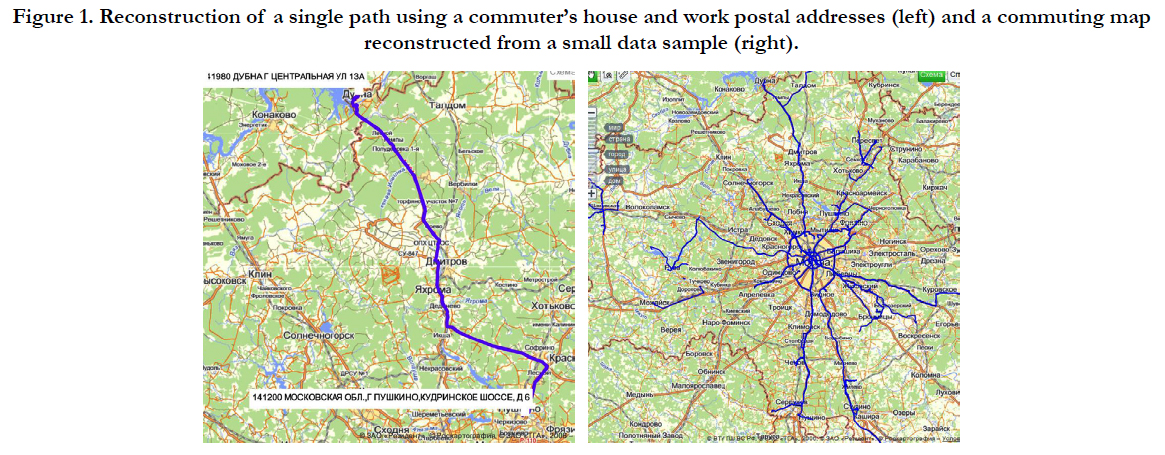
Figure 1. Tumorcheloid - Like Scar in Right Axillary Region.Figure 1. Reconstruction of a single path using a commuter’s house and work postal addresses (left) and a commuting map reconstructed from a small data sample (right).
ROUTE (X1=PR, X2, ..., XI, …, XN=WP) = GIS(PR,WP)---(2)
Where XI are parameters of the commuting path (time, distance, and geo-coordinates) reconstructed as a polyline consisting of N route segments between commuter’s PR and WP. The total commuting distance and time are the most obvious and easily calculated GIS parameters which have been used for a basic analysis of commuter behavior. Finally routes for ~0.8 million commuter shave been reconstructed (~80% reconstruction efficiency of the GIS-program) in order to obtain the final DB of the following structure:
Employee (PD, EC, ROUTE(X1,X2,...XN))-----(3)
The DB (3) contains unique information on the majority of commuters in Moscow region. The results of analysis of DB (3) in both geospatial (commuter patterns) and analytical (analysis of commuter individual characteristics) approaches will be demonstrated further on.
Visualized Patterns of Commuting
In order to visualize geospatial commuting patterns in the Moscow region contour maps of commuters’ places of residence and work have been plotted (see Figure 2) using corresponding first and last geo points of the reconstructed commuter routes. From a comparison of these maps it becomes clear that commuters of the whole region come to work mainly to the Moscow central area with weaker flux directed to the regional cities of the second order in close vicinity to the center.
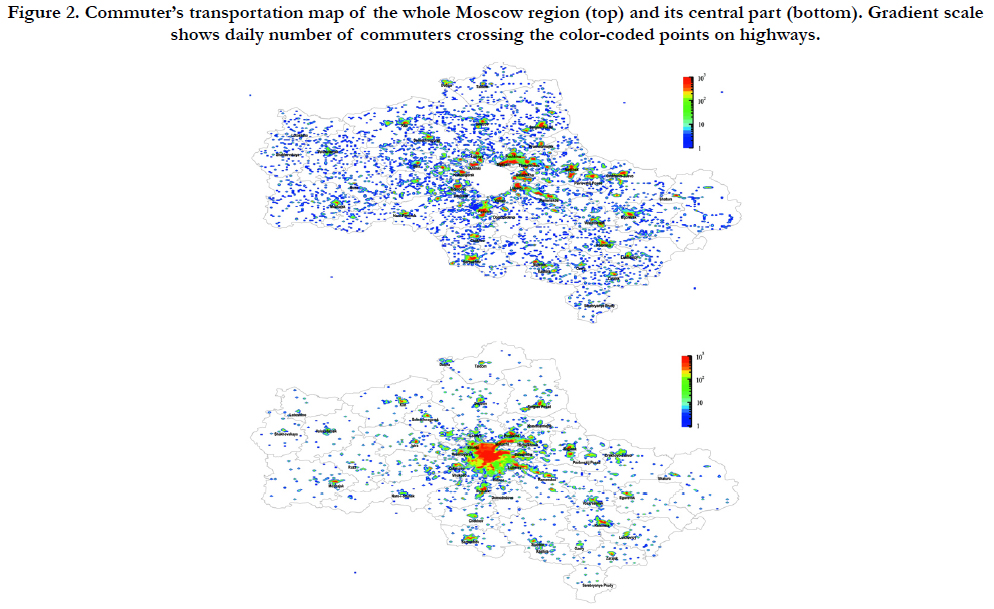
Figure 2. Commuter’s transportation map of the whole Moscow region (top) and its central part (bottom). Gradient scale shows daily number of commuters crossing the color-coded points on highways.
Note the dual function of these cities (Kolomna, Voskresensk, Podolsk, Serpukhov, Mozhaisk et al.). On one hand, they deliver commuters mainly in Moscow and its suburbs. On the other hand, they attract commuters from surrounding areas, which are far from the center which is unreachable to those commuters due to high commuting time and cost. So, the cities of second order are the centers of inter district commuting, which involves citizens who live and work in different districts of the Moscow region. It is a second order effect in comparison with the mainstream center-to-suburbs flux (~5 times smaller), but it is also a subject of particular interest.
Using reconstructed home-work routes (2) one can count the amount of commuters who crossed each particular geo coordinate on the roads in Moscow region. This commuters’ loading map of highways is shown in Figure 3. Radial structure of commuter fluxes is clearly visible on this map.
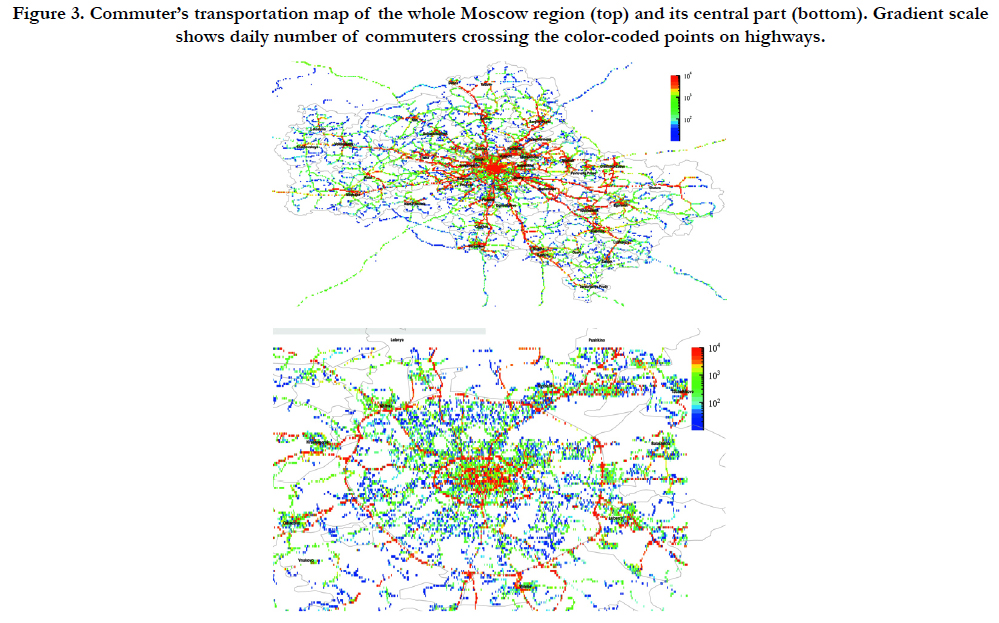
Figure 3. Commuter’s transportation map of the whole Moscow region (top) and its central part (bottom). Gradient scale shows daily number of commuters crossing the color-coded points on highways.
Let us proceed, moving from qualitative visual geospatial GIS analysis to quantitative assessment of the individual characteristics of commuters.
Individual Characteristics of Commuters
Analysis of the individual characteristics gives an insight into factors and mechanisms underlying the phenomenon of commuting. The individual behavior of commuters is a subject of intensive study, a detailed review of which had been presented in our previous review [15]. The use of DB (3) data makes it possible to perform a detailed analysis of the individual characteristics of commuters.
Figure 4 demonstrates the distributions of distance and journey times for commuters of Moscow region according to gender.
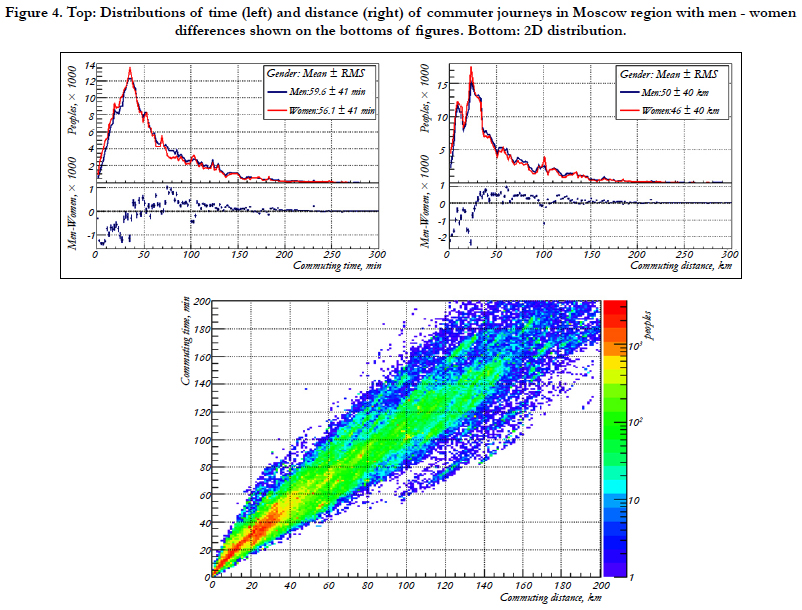
Figure 4. Top: Distributions of time (left) and distance (right) of commuter journeys in Moscow region with men - women differences shown on the bottoms of figures. Bottom: 2D distribution.
It should be pointed out that the average time spent by commuters for a single trip is one hour, while the average distance travelled is 50 km. One can see though that the majority of commuters spend around 35 minutes for a distance of 30 km (the main peaks of top plots on Figure 4). At first sight the distributions of commuting distance and duration for women and men are almost identical. The differences in average values (Mean) are essentially less than their variance (RMS). However, a more detailed analysis shows that the discrepancy between men and women distributions is essentially asymmetric (see men-women difference curves under main distributions shown on top plots on Figure 4). They show that women dominate on short trips less than 40 minutes or 30 km (the points lie below zero), while men prevail on the rest longer trips. Thus, it can be emphasized that the data of this study is in favor of a lower commuting mobility of women compared with men. This hypothesis is supported by most of commuting theories. This is a perfect example, when the aggregate evaluation of the effect is too rough and does not provide an opportunity to see the fine effect, the detection of which was only able thanks to unique data used for analysis.
In this approach, all commuters are considered motorists. In fact, about 30% of commuters use public transport and this can introduce a systematic error in the calculation of the transport map, as well as commuting time distributions (Figures 2-4). We cannot estimate this effect precisely and this is a lack of methodology. However, we believe that this effect is small. First, the self-driving commuters dominate and contribute main part in the transport patterns. Secondly, travel times between public and personal transport do not differ essentially due to serious traffic jams on the roads of the region during rush hours. As a result commuting time distributions should not be violated dramatically due to this effect.
The age distribution of commuters as well as average time of home-workplace routes in relation to age are shown in Figure 5. It should be noted that the age distributions of commuting men and women are almost the same and this once again confirms the gender equality in relation to participation in commuting. At the same time the age distribution of all citizens differs from that of the commuters. Comparing the two, it is evident that individuals of the “golden working age”, 20-50 years, dominate the group of commuters with a corresponding lack of older workers (>55 years). It is also clear that the youngest commuters (20-30 years old) are making the longest commuting journeys (see Figure 5, right). Hereafter the commuting time steadily decreases with age.
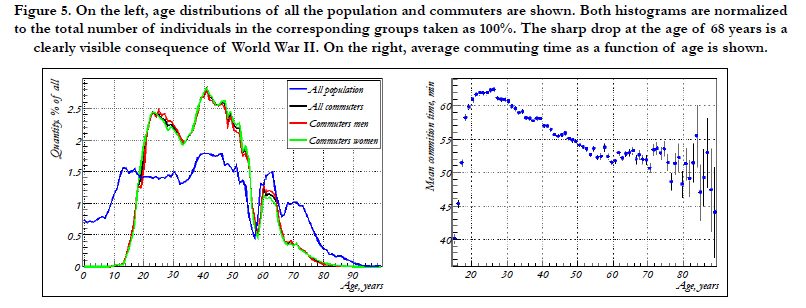
Figure 5. On the left, age distributions of all the population and commuters are shown. Both histograms are normalized to the total number of individuals in the corresponding groups taken as 100%. The sharp drop at the age of 68 years is a clearly visible consequence of World War II. On the right, average commuting time as a function of age is shown.
The income of commuters declared to the Pension Fund of the Russian Federation (PFRF) is a decreasing exponential curve, as is shown in Figure 6, left. Whereas it should be noted that there is an anomalously large number of low declared incomes below the living wage of 1581 RUB (average value in the Moscow region in 2001). This indicates an enormous amount of cash-in-hand wages. It is most probable that this group includes workers with shadow wages as, based on common sense, it is hardly possible to assume that 50-60% of commuters work for a wage that is below the poverty line.

Figure 6. Distribution of commuter incomes with shaded under-living-wage region (left) and average distance of commuter trips as a function of commuter income (right).
In addition, it was found that the average income of women was 2111 RUB which is 18.6 percent less than that of men whose average income is 2503 RUB. Thereby on the scale of Moscow region there are signs of gender discrimination according to the level of income.
The distribution of the average length of commuting journeys depending on commuter income is shown in Figure 6, right. The first data point on the graph includes commuters with cash-inhand wages and hence with unknown actual income. Therefore the obvious conclusion from this data point is that it confirms the fact that a cash-in-hand wage is a global phenomenon happening at all working places and, as a result, does not depend on commuting length. Due to the nature of the data the last binis also spoiled by essential amount of commuters with unknown wages, but high income from non-wage assets (shares, property, dividends, etc). After exclusion of these two problematic boundary points the average length of commuting journeys grows with increasing income. It means that high-skilled workers (HSW) commute farther and longer than low-skilled workers (LSW), which is in line with most theories of commuting. There are various explanations of this hypothesis. The mathematical approach [4] shows that the inclusion of travel times in the utility function of the Standard Urban Model (SUM) [8] of individual choice leads to an increase in the length of trips for HSW. In the theory of job search [10], the situation is explained by the spatial factor (coverage effect) of job search efficiency. Spatial spread of HSW work locations is higher, therefore HSW are forced to scan bigger areas in job searches. In addition, the benefits of higher wages at a new place of work are higher for HSW, wherefore they are ready to cover longer distances.
Figure 7 shows the distribution of average incomes of commuters depending on their age. The maximum income is earned by workers of 25-55 years old. Inside this group a peak is observed at 27-28 years, and a slight increasing slope between 30 and 50 years. The steep slope on the left of the figure corresponds to the careers of youngsters starting paid jobs, while the slope on the right might correspond to wage discrimination of aged workers forced to take less well paid positions. It is interesting that the shape of the curves is the same for both men and women, while the difference in amplitudes undoubtedly demonstrates the aforementioned gender discrimination.
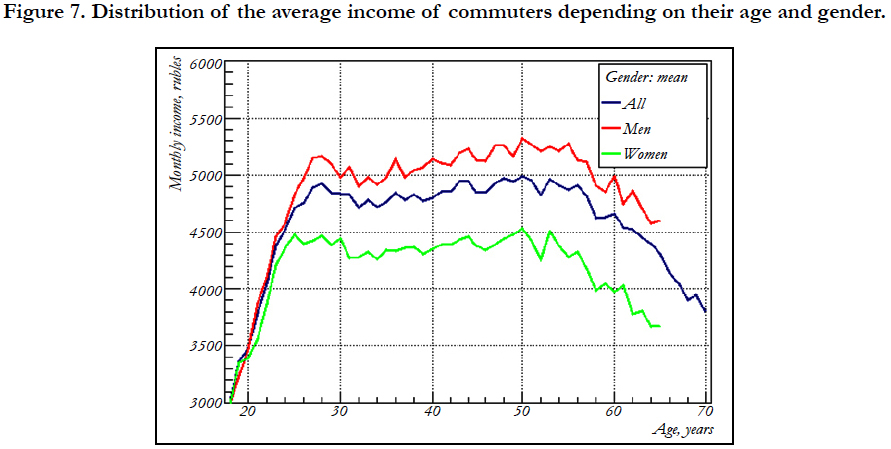
Figure 7. Distribution of the average income of commuters depending on their age and gender.
The present work demonstrates application of GIS technologies to the analysis of commuting in Moscow region. The use of such an approach became possible due to the ability to reconstruct the commuting journeys of 0.8 million workers using GIS analysis.
The geospatial patterns of home and work locations of commuters, as well as their transportation maps, have been visualized. Reconstructed GIS information in combination with micro data have been used to analyze commuting from a point of view of the individual characteristics of workers: gender, age and income. On average, commuters cover 50 km between home and work, spending one hour one way. It was found that women travel to smaller distances than men. At the same time, women’s wages are 20 percent lower than those of men. The farthest and the longest trips are made by commuters of 22-30 years old, after which mobility decreases steadily with age. Finally, highly skilled commuters with high wages commute farther and longer than low skilled and low paid workers.
The approach proposed in this work has great potential for further development. The next phase will be a more detailed quantitative analysis of the geospatial patterns of commuting, modeling, and forecasting of commuter behavior. These data and information are highly demanded by both the theory and practice of regional management. Further inspiring development of this approach could be a search of synergy of this data with urban planning, social work class diversity, and other contemporary events. The combined GIS-micro data approach proposed for the analysis of commuting in this work is a pioneering one and it has been applied for the first time in world practice on a dataset of such a scale.
Acknowledgement
This work was supported by the Russian Foundation for Basic Research (RFBR, http://www.rfbr.ru) [11-06-00323-а, 14-06- 00249-a].
References
- Arribas-Bel D, Gerritse M. Featured graphic Monocentricity? Commuting flows visually. Environment and Planning А. 2012;44(9):2041-2042. doi:10.1068/a44561.
- Bunruamkaew K, Murayama Y. Land use and natural resources planning for sustainable ecotourism using GIS in Surat Thani, Thailand. Sustainability. 2012 March 12;4(3):412-429. doi:10.3390/su4030412.
- Faggian A, McCann P. Human capital flows and regional knowledge assets: a simultaneous equation approach. Oxf Econ Pap. 2006 Jul;58(3): 475-500. doi: 10.1093/oep/gpl010.
- Heckman JS. Income, labor supply, and urban residence. Am Econ Rev. 1980 Sep;70(4):805-811.
- Hincks S, Wong C. The spatial interaction of housing and labour markets: commuting flow analysis of North West England. Urban Stud. 2009 Dec 7;47(3): 620-649. doi:10.1177/0042098009349777.
- Huang A, Levinson DM (University of Minnesota, Intelligent Transportation Systems Institute, Center for Transportation Studies). Accessibility, network structure, and consumers’ destination choice: A GIS analysis of GPS travel data and the CLUSTER simulation module for retail location choice. Report no. CTS 12-14.
- Manole S, Petrisor A, Tache A, Pȃrvu E. GIS assessment of development gaps among Romanian administrative units. Theoretical and Empirical Res Urban Manag. 2011 Nov;6(4):5-19.
- Mills ES. Studies in the Structure of the Urban Economy. Baltimore: Johns Hopkins University Press; 1972. 151.
- Plata-Rocha W, Gomez-Delgadoo M, Bosque-Sendra J. Simulating urban growth scenarios using GIS and multicriteria analysis techniques: a case study of the Madrid region, Spain. Environ Plan B. 2011 Jan;38(6):1012-1031. doi:10.1068/b37061.
- Rouwendal Jan. Search Theory and Commuting Behavior. Growth and Change. 2004 Jul 29;35(3):391-418. doi: 10.1111/j.1468-2257.2004.00254.x.
- Scharenbroich M, Iacono M, Levinson DM. How local is travel? SSRN Elect J. doi:10.2139/ssrn.1736090.
- Shitova YY. Commuting in Moscow region: methodical and applied analysis. HSE Economic J. 2008;1-21.
- Shitova, Yu. Yu. Pendulum labor migration in the Moscow region: methodical and applied analysis. Economic HSE Economic J. 2006;10:63-79.
- Shitova YY, Shitov, YA. Analysis and forecast of labor commuting in the Moscow region, the case of Dubna. Stud Russ Econ Develop. 2008a;19(4):405- 412. doi:10.1134/S1075700708040102.
- Shitova YY, Shitov YA. Status of studies of individual behavior of pendulum labor migrants. Socionet paper.
- Smith MS, Kauermann G. Bicycle commuting in Melbourne during the 2000s energy crisis: A semiparametric analysis of intraday volumes. Transport Res B. 2011;45(10):1846-1862. doi:10.1016/j.trb.2011.07.003.
- Wang F. Explaining intraurban variations of commuting by job proximity and workers' characteristics. Environ Plan B. 2001 Apr 1;28(2):169-182. doi:10.1068/b2710.
- Wei-hu L. ESDA-GIS analysis of spatial-temporal disparity in rural economic development of Guangxi. Asian Agri Res. 2011;3(2):20-23.
- Wen-bo G, Qing W. Industrial structure and competitive strength of 31 provincial districts --A GIS-based dynamic shift-share analysis. Asian Agri Res. 2011;3(1):127-129.
- Wood G. Modelling the ecological footprint of green travel plans using GIS and network analysis: from metaphor to management tool? Environ Plan B. 2003 Aug 1;30(4):523-540. doi:10.1068/b12995.
- Zhu S, Levinson DM. Do people use the shortest path? An empirical test of Wardrop's first principle. Plos One. doi:10.1371/journal.pone.0134322. PubMed PMID: 26267756.


