Analysis Of Service Quality, Image Institution, and The Price towards Student Satisfaction Jakarta LP3I Polytechnic
Nika Sintesa1*, Adi Nurmahdi2
1 Student, Universitas Mercu Buana, Indonesia.
2 Lecturer, Universitas Mercu Buana, Indonesia.
*Corresponding Author
Nika Sintesa,
Student, Universitas Mercu Buana, Indonesia.
E-mail: nikasintesa@gmail.com
Received: May 03, 2019; Accepted: December 12, 2019; Published: December 13, 2019
Citation:Nika Sintesa, Adi Nurmahdi. Analysis Of Service Quality, Image Institution, and The Price towards Student Satisfaction Jakarta LP3I Polytechnic. Int J Life Sci Res Dev. 2019;1(1):1-6.
Copyright: Nika Sintesa©2019. This is an open-access article distributed under the terms of the Creative Commons Attribution License, which permits unrestricted use, distribution and reproduction in any medium, provided the original author and source are credited.
Abstract
This study aims to determine and analyze partially and simultaneously the influence of service quality, image institution, and price toward student satisfaction of LP3I Jakarta Polytechnic. The type of research is quantitative approach, with data processing done using SPSS version 24. The object of this research student, with samples 132 students from levels I, II, and III. The analytical method used in this study is to use multiple linear regression analysis. The results showed that service quality, institutional image and price simultaneously and partially and simultaneously have positive and significant influence toward student satisfaction.
2.Introduction
3.Theoritical Review
4.Framework
5.Research Methods
6.Data Analysis Method
7.Results And Discussion
8.Conclusion
9.References
Keywords
Service Quality; Image Institution; Student Prices and Satisfaction.
Introduction
Higher education as one of most important parts in our
livelihood is partially responsible for efforts to educate citizens
of the nation. Competition in Higher Education is marked by
a very intense competition whereby universities try to capture
as many new students as possible. Various efforts were made
through promotion both in terms of offering educational
programs accordance with the demands and developments
of unique propositions including: timelines of studying time,
satisfying educational services, affordable tuition fees,supporting
facilities with outstanding infrastructure, competent lecturers,
and various offers to make it more convenience and to increase
satisfaction level for others. According to the Minister for
Research, Technology & Higher Education Mohamad Nasir said
too many numbers of institutions have the potential to harm
the community, because the academic quality and services did
notmatch the standards. About 14% of private universities find it
difficult to fulfil campus operational costs. The number of State
and Private Universities is around 4,500 campuses and it turns out
that there are many problems in small private universities.
Students are the main customers of Higher Education; higher
education services should be oriented towards students.
According to Tjiptono (2011:59) service quality is the expected
level of excellence and control over the level of excellence to
meet student desires. In addition, as a result of the evaluation
related to the decreasing trend of graduates' GPA, they felt the
need to evaluate student satisfaction related to education services,
so that it could be a reference for further improvements. The
level of student satisfaction with serviceis an important factor
developing a service delivery system that is responsive to the needs
of students, so that from year to year the number of students
increases, if the number of students decreases from year to year
there may be several things that need to be improved, especially in
terms of service quality.
According to Lupiyoadi (2009) service marketing is any action
offered by one party to another party which is intangible in
principle and does not cause any transfer of ownership. The
success of a company in achieving its stated goals depends on
the composition of the marketing strategy. Every company
uses a number of tools to get consumer responses to marketing
activities carried out by the company. One of the tools used by companies in compiling a marketing strategy is marketing mix.
According to Fandy Tjiptono (2011: 39) service marketing mix is
a set of tools that marketers can use to shape the characteristics
of services offered to customers.
According to Parasuraman et al., (2014) service quality is how far
the difference between reality and expectations for the service
the customers receive. Meanwhile, according to Kotler (2008)
service quality is any action or activity that can be offered by one
party to another party, basically intangible and does not result in
any transfer of ownership. Thus service quality is the ability of
a company/institution to satisfy customer expectations in the
form of services, in this case student satisfaction. Service quality
can be known to consumers after getting service. If the services
obtained or felt are in accordance with the expected, the quality
of service is perceived as good and satisfying. Conversely, if the
service obtained or felt is not as expected, the quality of service is
perceived as bad or not in line with expectations.
Imagery cannot be embedded the human mind or propagated
through mass media, according to Kotler and Keller (2012:
274) is an image is a set of beliefs, ideas and impressions a
person has towards an object. Image is a public perception of
the company regarding its services, the quality of products or
services, corporate culture, corporate behavior, or the behavior
of individuals in the company and others. According to Lupiyoadi
and Hamdani (2014) the price compares the costs and benefits
obtained, where at a certain price level, if the benefits are felt
consumers increase, the value will increase as well, and vice versa.
If the price compares the costs and benefits obtained is high,
consumers usually expect high quality, and the actual perception
will be affected by this expectation. Conversely, if the price is low,
students can doubt the ability and the image of the organization in terms of service quality.
Student satisfaction according to Kotler et al., (2012) is the level of
one's feelings after comparing the performance (or results) that he
perceives compared to his expectations. According to Park (2011)
student satisfaction is a feeling as a response to the products of
goods or services that have been consumed. Student satisfaction
is a positive attitude of students towards the services of higher
education institutions because of the compatibility between
expectations of service compared to the reality they receive
(Sopiatin, 2010). In general satisfaction can be interpreted as a
comparison between services or results received by consumers
with the expectations of consumers, services or results received at
least must be the same as consumer expectations, or even exceed,
student satisfaction in this case includes the difference between
expectations and performance or perceived results.
Frameworkw
The underlying framework is formed in this research is the
relationship between service quality, institutional image and price
with student satisfaction, with independent variable consists
of variables X1, X2, X3, and the dependent is Y variable. The
hypotheses of the study in this study is as follows:
• H1: Service quality has a significant and positive effect toward
student satisfaction.
• H2: Institutional image has a significant and positive effect
toward student satisfaction.
• H3: Price has a significant and positive effect toward student
satisfaction.
• H4: Service quality, institutional image, and price have
simultaneously significant and positive effects toward student
satisfaction.
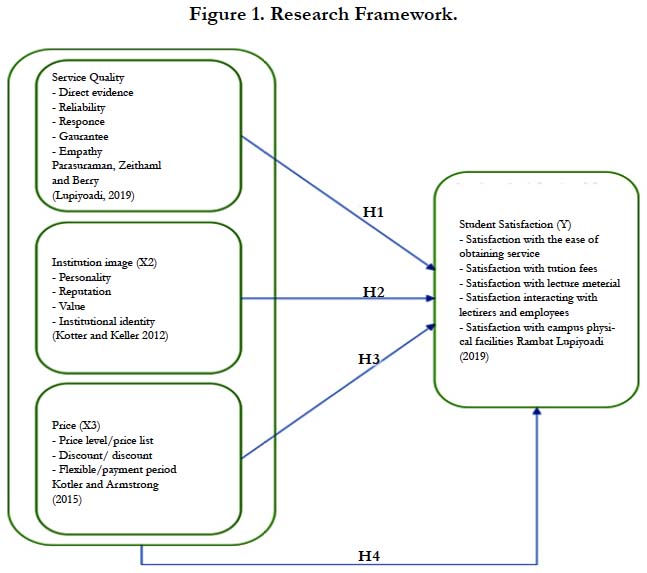
Figure 1. Research Framework.
Research Methods
The method used in this study is a descriptive method of analysis
with a quantitative approach, there is a significant relationship
between the variables examined, so as to produce conclusion
that will clarify the picture of the object under study. The
research design used questionnaires using Likert scale based on
respondents' who are students perceptions, with Jakarta LP3I
Polytechnic as the main site, data was analyzed using SPSS version
24.0.
In this study, the population was 197 college student. The number
of samples is determined using the Slovin approach with result
132 was completed. Method of collecting data including primary
data using questionnaire and interviews, as well as secondary data
collection.
The instrument used is declared reliable if it is obtained that the
value of Cronbach's Alpha is greater than 0.6 or even closer to the
value of 1.0. Reliability test can be seen that each variable Quality
of Service with a value of 0.872, Institutional Image with a value
of 0, 705, Price with a value of 0.677 and Student Satisfaction
with a value of 0.894 then the value of Cronbach Alpha ≥ 0.60.
Thus, the reliability test results for all variables are reliable.
Validity testing is used to measure the validity or invalidity of a
questionnaire. The basis of decision making used is to carry out a
significance test by comparing the value of r count with r critical
with a value of 0.3.
Data normality test can be done using Kolmogorov Smirnov's
One Sample, which is if the significant value is above 0.05 then
the data is normally distributed. Whereas if the One Sample
Kolmogorov Smirnov results show a significant value below 0.05
then the data is not normally distributed.
To find the presence or absence of multicollinearity in the
regression model can be seen from the tolerance value and the
value of the variance inflation factor (VIF). Tolerance measures
the variability of selected independent variables that cannot be
explained by other independent variables. So the low tolerance
value is the same as the high VIF value (because of VIF=1/
tolerance) and shows a high collinearity. The commonly used cutoff
value is the tolerance value of 0.10 or the same as the VIF
value above 10.
This test aims to test whether in a regression model variance
discomforts occur from residuals, one observation to another observation. If the variant is different, it is called heteroscedasticity.
One way to find out whether there is heteroscedasticity in a
multiple linear regression model is to look at the scatterplot graph
or predictive value of the dependent variable, namely SRESID
with the residual error, ZPRED. If there is no particular pattern
and does not spread above and below the zero on the y axis,
heteroscedasticity does not occur. A good model is that there is
no heteroscedasticity.
This equation derived from the analysis:
Y = 21,052 + 0.808 X1 + 0.696 X2 - 0.617 X3
Regression value of 0.808, meaning that every increase in 1 unit
of service quality, it will increase student satisfaction by 0.808
units, along with increasing service quality it will increase student
satisfaction. The regression value is 0.696, meaning that every
increase in 1 unit of institutional image, it will increase student
satisfaction by 0.696 units, that along with the increasing image of
the institution it will increase student satisfaction. The regression
value is -0.617, meaning that every increase in 1 unit of price, it
will reduce student satisfaction by -0.617 units, that along with
the increase in prices it will reduce student satisfaction. Partially
this study shows that there is an influence of service quality,
institutional image and a significant price on student satisfaction.
The results obtained from the calculation of the F test obtained
F count value of 2.55. While the F table value is 1.655 (from
the calculation of dk1 = 3, alpha = 0.05 and dk = 132 - 3 - 1 =
128 obtained by F table 1.655). This means that F count (2.55)>
F table (1,655) thus Ho is rejected and Ha is accepted, meaning
that service quality, institutional image and price simultaneously
influence toward student satisfaction. While the significance value
of the 3 independent variables is 0.029 <0.05. Then it can be
stated partially there is a significant effect between service quality,
institutional image and price toward student satisfaction.
Correlation coefficient value between Service Quality, Institution
Image and Price together (simultaneously) significantly influence
Student Satisfaction. This is indicated by the r value of 0.831,
which means the relationship between the two is very strong.
The value of the determination coefficient is 0.691 or equal to
69.1%, which means that the contribution of Service Quality
variables, Institutional Image and Price together contribute or can
explain Student Satisfaction at 69.1%, while the remaining 30.9%
influenced by other factors.
The calculation results obtained by t value calculated service
quality is greater than the value of t table that is equal to 0.989>
0.650 (t count > t table), so Ho is rejected and Ha is accepted.
While the significance value of the variable service quality is 0.004
<0.05. Then it can be stated partially there is a significant influence
between the quality of service toward student satisfaction.
The coefficient of determination R2 basically measures how far the model's ability to explain the dependent variables, in
this research the coefficient obtain is 0,691. the determination
coefficient value is 0.691 or equal to 69.1%, which means that
the contribution of Service Quality variables, Institutional Image
and Price together contribute or can explain Student Satisfaction
by 69.1%, while the remaining 30.9% is influenced other factors.
The coefficient of determination is zero and one. The small
R2 value means the reliability of the independent variables in
explaining the variation of the dependent variable is very limited.
Values close to one mean that the independent variables provide
almost all the information needed to predict variations in the
dependent variable.
Dimension analysis is used to determine the relationship of
dimensions between independent variables and the dimensions
of the dependent variable, for this reason it is necessary to
analyze dimensional correlations between variables. The symbol
of the correlation magnitude is r which is called the correlation
coefficient while the symbol parameter is β.
Results And Discussion
The respondent is the person interviewed who provides
information or data to the interviewer. Respondents are required
to provide correct information as a requirement for data that
will be tested. The main characteristic or characteristic of the
respondent is clearly describing what is information that is
certainly closely related tothe data being collected.
Service Quality has a positive effect on student satisfaction, this
is indicated by the regression coefficient of 0.808 means that if
Service Quality is getting better, then Student Satisfaction will
increase. This is in accordance with the concepts and theories
that support those proposed by Wyckof cited by Tjiptono (2014),
namely service quality is the expected level of excellence and
control over the level of excellence to meet customer desires. If
the service or service received or perceived (perceived service)
is as expected, then the quality of service or service is perceived
as good and satisfying. As we all know that the main concern in
Higher Education Institutions is how to create Student Satisfaction
to stay awake. If Student Satisfaction is high or good, it will give
a good impact for the University to continue to exist, advance
and develop. It is very important for universities to continue to
maintain and even improve service quality, because service quality
is one of the keys to student satisfaction. Many students are not
satisfied with college, one of which is caused by low service
quality. As a result, they were lazy to go to college, complained a
lot, complained, non-active in college and even dropped out and
moved to other universities.
The results of previous studies conducted by Abdullah Taman,
Sukirno, et al., (2013) Analysis of Service Quality for Students
at the Faculty of Economics, Yogyakarta State University,
concluded that there was a positive and significant effect on
reliability (quality of service) on student satisfaction. as well as
the opinion on journal of Nismawati (2012) states that there is a significant influence between the quality of service to Student
Satisfaction. Djumarno, Dian Adi Perdana, Adi Nurmahdi, Hapzi
Ali on journal Customer and Satisfaction Models of Customers:
Analysis of BTN Co-Cretion, Communal Activation and Caring
(Case Study on Students of UIN Walisongo Semarang) showed
that the better the quality of the products offered, the higher
the Bank BTN brand in the eyes of customers. This will be a
determining factor for customer satisfaction.
Institutional image has a positive effect on student satisfaction,
this is indicated by the regression coefficient value of 0.696
which can also be seen based on the answers of respondents with
the majority giving neutral answers and agreeing. Partially this
study shows that there is an influence of institutional image on
student satisfaction. This is also in accordance with the results
of the t test obtained, so it can be concluded that the image of
the institution will affect student satisfaction. The results of this
study are supported by previous research conducted by Sukmasari
Pitaloka (2016) about the relationship of institutional image and
satisfaction which concluded that institutional image has a positive
and significant effect on student satisfaction. Faizin, Moh (2015)
Effect of Service Quality, Perceived Price in customer satisfaction
Service quality, price perception & brand image simultaneously
have a positive & simultaneous effect on customer satisfaction..
Brand Image and company image has a positive and significant
effect on customer satisfaction trough purchase decision (17).
Institutional Image, where it is also one of the factors that also
determines student satisfaction. The better the institution's
image, the higher the student's satisfaction. Institutional image
is a benchmark that the quality of a university is a reflection.
The better the image of the institution, the better the student's
assessment of the quality of his education will be, so that it will
have an impact on increasing student satisfaction. Competition in
the business world in the world of education today is very tight.
Colleges compete to become market leaders.One way that can be
used to capture market share is to give satisfaction to students
so that he will be at home and stay in college, it might even be
recommended to other prospective students to study in his place.
Brand Image and company image has a positive and significant
effect on purchase decision Adi Nurmahdi, 2018.
Other factors that also influence student satisfaction are the price
or tuition fees. The tuition fees are very important for them as
a determining factor in determining their college choices. If
they consider the tuition fees to be too expensive and not worth
the benefits, they will certainly be disappointed and dissatisfied.
Conversely, if they assess the tuition fees they pay even though
they are expensive, the results are worth the benefits, of course
they will be satisfied. Thus the price or tuition clearly must be
the concern of the institution or institution of Higher Education,
if he wants his students to feel satisfied. Determining the right
price or tuition fee is the best choice for all, both institutions
and students. Anuwichanon, Jirawat (2011) The Impact of Price
Perception on Customer Loyalty. The effect of perceived prices
significantly influences customer loyalty.
Service quality, Institutional Image and Price turned out to have a
significant effect on Student Satisfaction. This means that the three
independent variables need serious attention from the educational
institutions in this case the leadership and management of the
LP3I Jakarta Polytechnic, Cilodong Campus, to be maintained,
and even improved so that student satisfaction can be maintained
and even increased. If student satisfaction is built well, then
they will feel comfortable, feel at home to stay in college, may
even become external marketing to provide recommendations to
other prospective new students to enroll in college at the local
campus. This means that the positive impact is not only beneficial
for students, but also beneficial for institutions and the wider
community in this case new prospective students.
Student satisfaction according to Kotler et al., (2012) is the level
of one's feelings after comparing the performance (or results)
that he perceives compared to his expectations. According to
Park in Hasan, 2009: 57, student satisfaction is a feeling as a
response to the products of goods or services that have been
consumed. Student satisfaction is a positive attitude of students
towards the services of higher education institutions because of
the compatibility between expectations of service compared to
the reality they receive Sopiatin, 2010: 33.
It can be concluded that in general satisfaction can be interpreted
as a comparison between services or results received by consumers
with the expectations of consumers, services or results received at
least must be the same as consumer expectations, or even exceed,
student satisfaction in this case includes the difference between
expectations and performance or perceived results. If the quality
of service, Institutional Image and Price continues to be well
developed, then it will have a major impact on the educational
institution itself, in this case the LP3I Jakarta Polytechnic to exist,
advance and develop, can even make it superior in the era of
global competition.
Conclusion
The results of hypothesis testing proved that service quality,
institutional image and price both individually and jointly had a
positive effect on the satisfaction of LP3I Jakarta Polytechnic
students, with the following description:
1. Service Quality Variables significantly influence Student
Satisfaction. This means that it is very important for universities
to continue to maintain and even improve service quality, because
service quality is one of the keys to student satisfaction. Many
students are not satisfied with college, one of which is caused by
inappropriate service quality. As a result, many trade students are
lazy to go to college, complaining a lot, complaining, non-active
/ college leave even going out of college and moving to other
universities. Because it is so important, the quality of service is
the main thing for universities to continuously maintain and even
improve it as much as possible
2. Institutional Image Variables significantly influence Student
Satisfaction. This means that Institutional Image is one of the
factors that also determine student satisfaction. The better the
image, the higher the student satisfaction. The institutional image
is a measure of the quality of higher education as a reflection.
The better the image of the institution the better the student's
assessment of quality, so that it has an impact on increasing
student satisfaction.
3. Price Variables significantly influence Student Satisfaction.
That is, the price in this case the tuition fee as a determining
factor in determining the choice of college. If students rate it
too expensive and not worth the benefits, they will certainly be
disappointed and dissatisfied. Conversely, if they judge the price
they pay, although it is expensive, the results are worth for paying
they will be satisfied. Thus the price or tuition clearly must be
the concern of a higher education institution or institution, if he
wants his students to be satisfied. Determining the right price or
tuition fee is the best choice for all, both institutions and students.
4. Service Quality Variables, Institutional Image and Price together
(simultaneous) significantly influence student satisfaction. This
means that the three institutions need to get serious attention
from the educational institutions in this case the leadership and
management of the LP3I Jakarta Polytechnic in Cilodong Campus
to be guarded, maintained and even improved so that student
satisfaction can be maintained and even increased. If student
satisfaction is built well, then they will feel comfortable, feel at
home to stay in college, may even become external marketing to
provide recommendations to other prospective new students to
enroll in college at the local campus. This means that the positive
impact is not only beneficial for students, it is also beneficial for
institutions and the wider community in this case new prospective
students.
References
- Hamdani, Rambut Lupiyoadi. Marketing Services Management. Salemba Empat Jakarta.2009.
- Arikunto S. Educational Research Procedures. Jakarta PT Rineka Cipta. 2010.
- Ali, Hapzi., Febriani, Nurfitriah., Permana, Dudi., andNurmahdi, Adi. Decision Model for a Visit at The Museum Bahari in Jakarta: People, Place, Promotion, and Physical Evidence. International Journal: Scholars Bulletin. 2018.
- Bachtiar DI. Analisa Faktor-Faktor Yang Mempengaruhi Kepuasan Mahasiswa Dalam Memilih Politeknik Sawunggalih Aji Purworejo. Dinamika Sosial Ekonomi. 2012 Feb 8.
- Chiu KH, Hsu CL. Research on the connections between corporate social responsibility and corporate image in the risk society: Take the mobile telecommunication industry as an example. International Journal of Electronic Business Management. 2010: 8(3).
- Daryanto SI. Consumers and Excellent Service. Matter I. Yogyakarta Gava Media. 2014.
- Djumarno , Dian Adi Perdana , Adi Nurmahdi , Hapzi Ali. Customer and Satisfaction Models of Customers: Analysis of BTN Co-Cretion, Communal Activation and Caring (Case Study on Students of UIN Walisongo Semarang). Saudi J Bus Manag Stud. 3(8): 889-908.
- Fandy T. Pemasaran Jasa: Prinsip, Penerapan, Penelitian. 2014.
- Tjiptono F, Chandra G. Service, Quality & Satisfaction Edisi 3. Yogyakarta: Andi. 2011.
- Ghozali I. Aplikasi analisis multivariate dengan program SPSS. Badan Penerbit Universitas Diponegoro; 2006.
- Gregory RJ, Wiechman JG. Pemasaran Ritel, Edisi Kesebelas. Jakarta: Gelora Aksara. 2011.
- HASAN, Ali. Marketing edisi baru. Yogyakarta: Media Pressindo, 2009.
- Keller Kevin Lane. Marketing Management. Pearson Education, Harlow, Nitisusastro, Mulyadi. 2010.
- P Kotler, G Armstrong. Principle of Marketing.6th ed. Pearson Education, Boston;2010. p. 1-18.
- Kotler P, Armstrong G. Principles of Marketing. Jakarta: Erlangga. 2013.
- Scorita KB, Nurmahdi A. Service Quality And Brand Image Affect Customer Satisfaction And Impact On Loyalty. Journal of Office Administration. 2018 Dec 21;6(2):153-62.
- Laksyudha Prasetyo, Adi Nurmahdi . Analysis of Brand Image. Company Image and Promotions towards Purchasing Decisions and Its Implications on Consumer Satisfaction in the Veterinary Medicine Industry PT XYZ. Saudi J. Bus. Manag. Stud.2018;3(11): 1252-1260.
- L Rambat, A Hamdani. Marketing Management Services. 2nd ed. Jakarta: PT. Salemba Empat.2006
- Lupiyoadi R. Competency Based Service Marketing Management. Jakarta: PT. Salemba Empat.2013.
- Lupiyoadi R. Marketing Management Services. Salemba Empat Jakarta.2009
- Parasuram. Perfect Customer Service, Kunci Ilmu, Yogyakarta, 2004.
- Tjiptono F. Service Management. Issue III, Andi Yogyakarta Publisher. 2004.
- Parasuraman A, Zeithaml VA, Berry LL. Servqual: A multiple-item scale for measuring consumer perc. Journal of retailing. 1988 Apr 1; 64(1): 12-37.
- Kotler P. Management Pemsaran. 11th ed. Jakarta, Index. 2005; 2.
- Rambat L, Hamdani A. Services Marketing Management. 2nd ed, Salemba Empat, Jakarta .2011.
- Rambat L, Hamdani A. Marketing Management Services. Salemba Empat, Jakarta. 2009.
- Silaen S. Social research methodology for thesis writing and thesis. Bogor (ID): IN Media. 2014.
- Sugiyono. “Mixed Research Methods, "Alfabeta, Bandung, 2013. _______," Business Research Methods (Quantitative, Qualitative, and R&D Approaches) ". Alfabeta, Bandung, 2010.
- Gregorius C, Tjiptono F. Pemasaran Strategik. Andi, Yogyakarta. 2012.
- Sugiyono. Quantitative, Qualitative and R&D Research Methods, Bandung Alfabeta.2009.
- Sugiyono PDPopulation and sample. Quantitative, Qualitative, and R&D Research Methods.. 2014;291:292.
- Sugiyono .Qualitative Quantitative Research Methods, and Combinations (Mixed Methods). Bandung: Alfabeta. 2013.
- Herlambang S. Basic Marketing (Basic Marketing) Easy Ways to Understand Marketing Science. Yogyakarta: Gosyen Publishing. 2014;53-55.
- Sutisna PT. Consumer Behavior and Marketing Communication. Bandung: Teen Rosdakarya 2001.
- Tjiptono F, Chandra G. Service, Quality & Satisfaction Edisi 3. Yogyakarta: Andi. 2011.
- Sujarweni VW.Nursing research methodology. Yogyakarta: Gava Media. 2014.
- Zeithaml VA, Bitner MJ, dan Gremler DD. Service Marketing – integrating customer focus across the firm .5th ed. New York: McGraw-Hill; 2002.


