Ten-Year Trends in Children’s Caloric-Beverage Consumption and Behavioral Intent
Carnot MJ1, Sutliffe JT2*, Palmer. SE3, Elliott E4
1 Associate Professor, Counseling, Psychology & Social Work, Chadron State College, USA.
2 Associate Clinical Professor, Health Sciences, Northern Arizona University, USA.
3 Associate Dean, College of Health & Human Services, Northern Arizona University, USA.
4 Ware Distinguished Professor, College of Physical Activity and Sport Sciences, West Virginia University, USA.
*Corresponding Author
Jay T. Sutliffe PhD, RD,
Associate Clinical Professor, Health Sciences,
Northern Arizona University,
PO Box 15095, Flagstaff, AZ 86011-5095, USA.
Tel: ((928)523-7450
Fax: (928)523-0148
E-mail: jay.sutliffe@nau.edu
Article Type: Review Article
Received: June 30, 2015; Accepted: July 17, 2015; Published: July 20, 2015
Citation: Carnot MJ, Sutliffe JT, Palmer SE, Elliott E (2015) Ten-Year Trends in Children’s Caloric-Beverage Consumption and Behavioral Intent. Int J Food Sci Nutr Diet. S3:002, 8-15. doi: dx.doi.org/10.19070/2326-3350-SI03002
Copyright: Sutliffe JT© 2015. This is an open-access article distributed under the terms of the Creative Commons Attribution License, which permits unrestricted use, distribution and reproduction in any medium,provided the original author and source are credited.
Abstract
This is a report of ten-year trends in US fifth-grade student knowledge of fruit and vegetable (FV) recommendations, behavioral intent, consumption, and relationships between FV knowledge, behavioral intent and behavior. The study was conducted from 2001-2011 through the Healthy Hearts for Kids (HH4K) online instructional program. A total of 17,559 students from 1,048 schools in 49 US states participated. ANOVA and Pearson product-moment correlations were calculated for all variables. Significant changes over the 10-years were found for knowledge of FV recommendations, fruit consumption, intention to consume FV immediately and in one year, and to choose fruits rather than candy tomorrow and in one year. Effect size was small for all variables. No significant changes in vegetable consumption were found. Generally, data revealed significant correlations between behavior and intent items, but not knowledge. Despite ongoing efforts to inform children about FV consumption, there has been minimal change in fifth-grade children’s overall FV knowledge, behavior and intent, revealing a need for more than just knowledge based education and interventions. It is critical that effectiveness, sustainability and scalability be considered with future interventions.
2.Introduction
3.Materials and Methods
3.1 Study Population
3.2 Measures
3.3 Data Analysis
4.Results
4.1 Change in Health Behaviors: Caloric Beverage Consumption (Behavior)
4.2 Changes in Behavioral Intent
5.Discussion
5.1 CB Consumption Trends
5.2 Behavioral Intent
5.3 Implications for Research and Practice
5.4 Limitations
6.Acknowledgement and Declarations
7.References
Keywords
Children; Caloric-Beverages; Sugar-Sweetened Beverages; Soft Drinks; Fruit Juice; Milk; Beverage Consumption; Behavioral Intent.
Introduction
In recent years, attention has focused on improving the quality of dietary intake for elementary-aged school children in the United States (U.S.). Dietary quality and caloric density in relation to energy balance are major factors related to children being overweight and/or obese as are the compounding issues of an increased risk for several cardiometabolic diseases, even in young children [1, 2]. The consumption of caloric-beverages (CB) has become a food/ beverage category of focus in health campaigns as reduction in consumption of CB will improve dietary quality and reduce caloric intake.
Wolf, Bray & Popkin [3] reported that the widespread regular consumption of CB is a relatively recent phenomenon. For most of recorded human history, the primary beverages consumed were water and breast milk. Since breastfeeding is discontinued in early childhood, humans have traditionally transitioned to water as a dominant source of fluid when weaned. Overtime, various CB such as animal milks, fermented beverages, tea, coffee and fruit and vegetable juices were added to the human diet. By the mid- 18th century carbonated beverages began to appear with the motivation of making healthier water free of pathogens [4]. By the early to mid-19th century the term “pop” became associated with soft drink (SD) water flavored with syrups made from fruit and served in glass bottles that made a popping noise when opened and the carbonated gases were released [5]. By the beginning of the 20th century, the SD industry was well-established with over 2500 plants bottling SD water in the U.S [5].
SD consumption has continued to increase, showing a fivefold increase since 1950 [6], and SD have been implicated as a primary contributing factor to the increase in childhood obesity.
Ludwig, Peterson, & Gortmaker [7] reported parallel growth in CB consumption and overweight/obesity patterns in children. Several studies have shown that liquid calories do not adequately elicit dietary compensation or the suppression of other foods or calories, due to the low satiety value of beverages, as compared with semisolid or solid food items [8-10]. As the popularity of SD consumption increased in the latter 20th century, SD serving sizes grew by 46% from 1977-2001 [11].
Consumption patterns have shown that over half (57%) of the 6-12 year olds in the US commonly consume 100% fruit juice (FJ) [12]. FJ has been commonly promoted as a healthy alternative to SD and other CB, despite their caloric density being similar to SD and being associated with an increased risk for weight gain and obesity [13, 14]. However, better dietary quality and improved nutrient intake have also been associated with FJ consumption in both children and adults [12]. In addition, FJ consumption does not seem to be associated with an increased risk for children becoming overweight or obese [15]. These conflicting reports demonstrate the complexity of assessing overall dietary intake, as well as ethnic, genetic, and sociological factors.
Milk contributes to overall caloric intake and is also widely recognized as a healthier beverage choice than SD. Generalized patterns show milk consumption decreases as SD consumption increases as children move from elementary to middle and into high school [16]. Regardless of the source of beverage, SD, milk and FJ (liquid calories) provide “add-on” calories [6]. In contrast, semisolid or solid foods tend to elicit dietary compensation [8, 10].
Although SD are still the most commonly consumed CB and source of added sugars in the 6-11 years old age group, there has been a consistent downward trend in overall consumption that coincides with a reduction in availability in U.S. public elementary schools dating back to 2006-2007 [17]. Consumption levels are still above desirable levels and SD are consumed largely away from the school setting [18].
Despite positive trends, the disconcerting aspect of SD consumption is that early patterns of even modest amounts can have significant long-term repercussions and debilitating effects. Fiorito, Marini, Mitchell, Smiciklas-Wright, & Birch [19] found SD consumption patterns in five-year-old girls had predicted future SD consumption and dietary quality up to ten-years later. Also, the nationwide tendency to increase the frequency and quantity of CB elevates as children transition into adolescents and young adulthood [20]. In addition, Aeberli et al. [21] found that moderate consumption of sugar-sweetened beverages can have potentially harmful effects on healthy young men in as little as three weeks.
Health education interventions are needed to assist in continuing the positive momentum seen in the CB consumption downward trends. Web-based health literacy programs are one of many types of interventions designed to promote a healthy lifestyle among youths [22, 23]. The U.S. Department of Health and Human Services [24] defines health literacy as “the degree to which individuals have the capacity to obtain, process, and understand basic health information and services needed to make appropriate health decisions” (Page1). Many resources have been directed to increasing fruit and vegetable (FV) consumption in the past tenyears, but the impact on dietary health literacy is unclear.
One such resource, Healthy Hearts for Kids (HH4K) was developed in 2001 as one of the first web-based instructional modules for schools to increase health knowledge and improve health attitudes and behaviors. HH4K has been used by approximately 17,500 fifth-grade children from 49 US states between 2001 and 2011. HH4K includes a survey of CB consumption (behavior) and behavioral intent prior to students completing online lessons. These data can be used to investigate trends in health literacy and knowledge application. In this study, we report 10-year trends in fifth-grade student CB consumption (behavior) and CB behavioral intent. We also report the relationships between CB consumption (behavior) and behavioral intent.
Materials and Methods
This study presents an analysis of secondary data collected through HH4K. Teachers registered to use HH4K and entered student information for all years except 2001, 2006, 2008 and 2009. Participants were from 1048 schools in 49 states. The gender, ethnicity and age of student participants for years in which data were available are provided in Table 1. Data on ethnicity and age were not collected in 2010. Student participants completed surveys as part of the instructional practices of the web-based educational module. Youth survey data were available for all years 2001 – 2011 with the exception of 2006 when data were lost due to a corrupt data file. Student data included responses from 17,559 children.
As use of HH4K expanded to more US states and more schools registered to use the instructional module with their students, the schools continued to be predominately rural, with over half classified as rural, an average of about 30% designated urban, and less than 10% were inner-city schools. Table 2 provides a snapshot of school demographics over three years during data collection. The Institutional Review Board (IRB) at Northern Arizona University approved this analysis of secondary data.
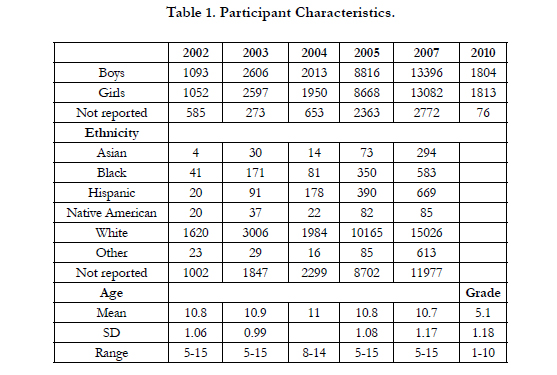

Table 1. Participant Characteristics.
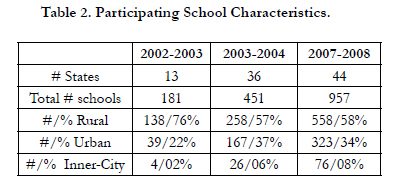
Table 2. Participating School Characteristics.
When students first logged on to HH4K, they were asked to complete a 23-item survey that included questions addressing behavior, behavioral intent and knowledge for nutrition, tobacco and physical activity. The survey was derived from the Youth Risk Behavior Surveillance System (YRBSS) [25, 26], and validated instruments used in the Sport, Play and Active Recreation for Kids (SPARK) [27]. Three items required subjects to indicate their behavior in the last seven days regarding consumption of SD, FJ and milk. For example, one item read “During the past 7 days, how many times did you drink SD such as Pepsi, Coke, Sprite, Mountain Dew?” Answer choices included ―I did not during the past 7 days, 1-3 times, 4-6 times, and 1, 2, 3 or 4 or more times per day. These responses were assigned numerical values from 1 – 7. Additionally, subjects were asked how likely they would drink two or more SD tomorrow and one year from now. Answer choices were based on a five-point Likert-type scale (I definitely will not, probably will not, about a 50/50 chance, probably will and definitely will). Higher scores indicate a greater intention for that particular behavior.
The statistical package SYSTAT 13.0 (Systat Software, Inc. San Jose, CA USA) was used to perform all data analysis. A minimum alpha level of .05 was used for all statistical tests. The primary goal was to compare all beverage consumption variables across years (2001 – 2011 with the exception of 2006 due to data file corruption). The Anderson-Darling Test for Normality indicated that all variables violated the normality assumption of ANOVA, making the ANOVA a less powerful test than if the assumption of normality was met. Recent research has indicated that ANOVA is very robust under application of non-normal data [28]. Thus, one-way ANOVAs with year as the factor (9 levels) were used to examine changes across time in behavioral intent (SD consumption) and behavior regarding SD and other beverage consumption. Bonferroni post hoc procedures with an alpha level of .01 were used to identify significant pairwise differences. The nonparametric equivalent test Kruskal-Wallis was used to address potential lower power of the ANOVA in determining if there are differences across years. Dwass-Steel-Chritchlow-Fligner pairwise comparisons were utilized to examine pairwise differences.
The Pearson product-moment correlation was used to examine the relationship between intended consumption of SD and actual behavior. Although the Pearson product-moment correlation assumes bivariate normality of distributions, recently Puth, Neuhäuser and Ruxton [29] suggested that for large enough samples,the Pearson product moment correlation is unbiased and efficient. Spearman rank correlations are provided for comparison.
Results
There were significant changes in SD consumption in the past seven days over the ten year period (F (8, 17550)) = 21.165, p < .001), MSE = 3.535). Effect size was small (Eta squared = .009). Means are reported in Table 3, and pairwise mean differences and Bonferroni comparisons are reported in Table 3a. A Kruskal- Wallis Test statistic indicated significant differences in SD consumption in the ten year time period (Chi-square = 182.598, df = 8, p < .001). The Dwass-Steel-Chritchlow-Fligner Test for All Pairwise Comparisons indicated that all years were different from each other with the exception of 2004-2005 and 2008-2009. Both the parametric approach (ANOVA) and the non-parametric approach (Kruskal-Wallis) indicated a significant change in SD consumption over time. The parametric post hoc tests (Bonferroni) show a more complex pattern of differences than the nonparametric post hoc tests.
There were no changes across the ten year time frame in reported FJ consumption in the past week (F (8, 17550) = 1.125, p = .342, MSE = 3.759) or milk consumption in the past week (F (8,17550) = 1.339, p = .219, MSE = 3.766. Examination of FJ consumption using nonparametric Kruskal-Wallis test indicated no difference in FJ consumption (Chi-square = 11.425, df = 8, p < .001), or in milk consumption across the ten year time period (Chi square = 9.086, df = 8, p < .001). Descriptive statistics are reported in Table 3.
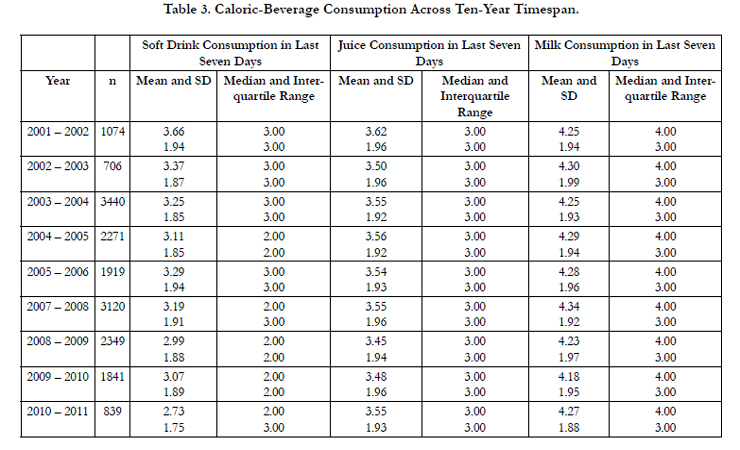
Table 3. Caloric-Beverage Consumption Across Ten-Year Timespan.
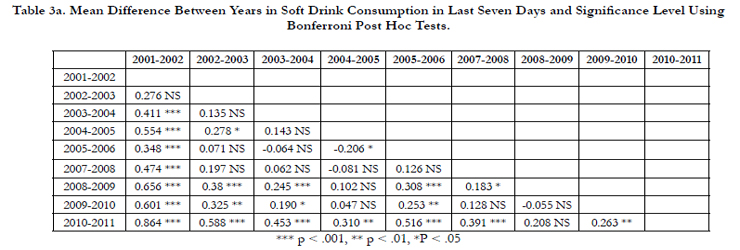
Table 3a. Mean Difference Between Years in Soft Drink Consumption in Last Seven Days and Significance Level Using Bonferroni Post Hoc Tests.
There were significant changes in the likelihood of drinking two or more SD tomorrow (F (8,17550) = 16.862, p < .001, MSE = 1.893) and one year from now (F (8,17550) = 15.485, p < .001, MSE = 1.718) although the effect size was small (Eta squared = .008 and .007 respectively). Descriptive statistics are presented in Table 4. Bonferroni mean differences and significance are reported in Tables 4a and 4b.
Kruskal-Wallis tests confirmed significant differences across the ten year timespan for likelihood of drinking two or more SD tomorrow (Chi-square = 134.96, df = 8, p < .001) and one year from now (Chi square = 122.198, df = 8, P < .001). The Dwass - Steel-Chritchlow-Fligner Test for All Pairwise Comparisons indicated that all but two pairs of years were different from each other in likelihood of drinking SD tomorrow (2004-2005 and 2008-2009, 2005–2006 and 2009-2010 were not significantly different). In terms of likelihood of drinking SD one year from now, all but one pair of years was significantly different from each of the others (2004-2005 was not different from 2008-2009).
Both the parametric (ANOVA) and nonparametric (Kruskal-Wallis) tests indicated significant changes across the ten-year timespan. Post hoc tests on both variables show a more complex pattern for the Bonferroni test, with nearly all pairwise comparisons significant for the Dwass-Steel-Chritchlow-Fligner Test.
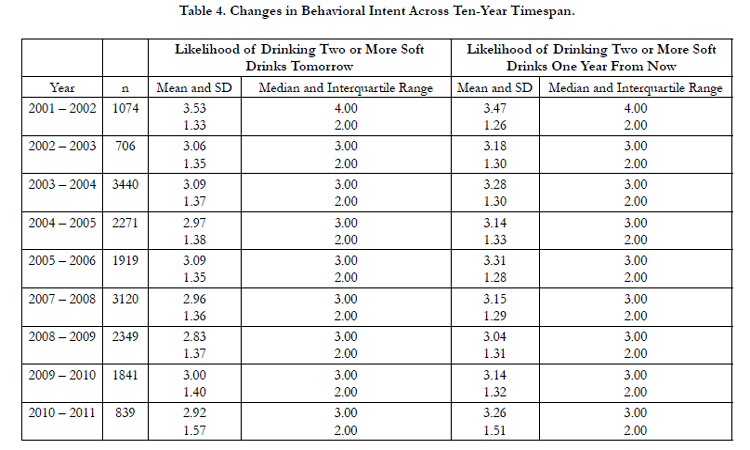
Table 4. Changes in Behavioral Intent Across Ten-Year Timespan.
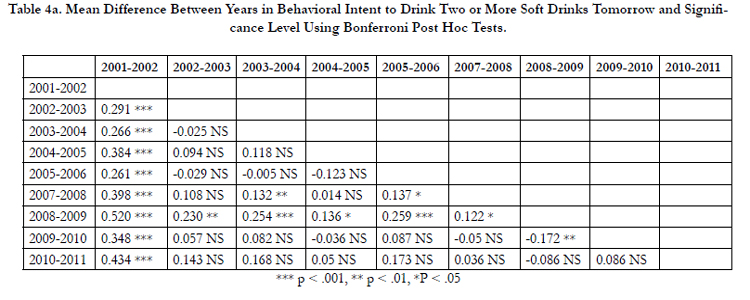
Table 4a. Mean Difference Between Years in Behavioral Intent to Drink Two or More Soft Drinks Tomorrow and Significance Level Using Bonferroni Post Hoc Tests.
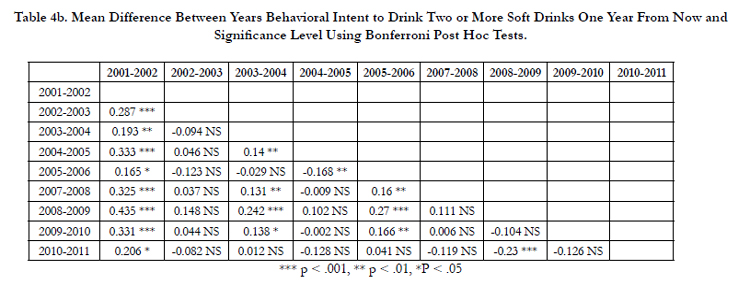
Table 4b. Mean Difference Between Years Behavioral Intent to Drink Two or More Soft Drinks One Year From Now and Significance Level Using Bonferroni Post Hoc Tests.
Both Pearson product moment correlations (Table 5) and Spearman rank correlations (Table 5a) were used to examine the relationship between variables. Juice consumption in the past week was positively correlated with SD consumption in the past week (Pearson’s r = .032, p < .001, n = 11678) and with milk consumption (Pearson’s r = .257, p < .001, n = 11678). In addition, SD consumption was positively correlated with milk consumption (Pearson’s r = .033, P < .001, n = 11678). Spearman correlations show a slightly different pattern, with milk consumption significantly correlated with both juice consumption and SD consumption, but no significant correlation between juice and SD consumption (Tables 5 and 5a).
The intent to drink two or more SD tomorrow was significantly related to SD consumption in the last week (Pearson’s r = .029, p = .001, n = 11678) and to intended SD consumption a year from now (Pearson’s r = .593, p < .001, n = 11678). The intent to drink two or more SD one year from now was not related to reported SD consumption in the last week (Pearson’s r = .009, p = .337, n = 11678). This pattern was the same in the Spearman correlation data (Tables 5 and 5a).
The intent to drink two or more SD tomorrow was not correlated with juice or with milk consumption in the past week (Pearson’s r = .013, p = .148, n = 11678, and Pearson’s r = -.014, p = .122, n = 11678 respectively). Similarly, the intent to drink two or more SD per day one year from now was not significantly related to juice or to milk consumption in the last week (Pearson’s r = .015, p = .110, n = 11678, and Pearson’s r = .002, p = .854, n = 111678, respectively). A similar pattern was found in the Spearman correlations (Tables 4 and 4a).
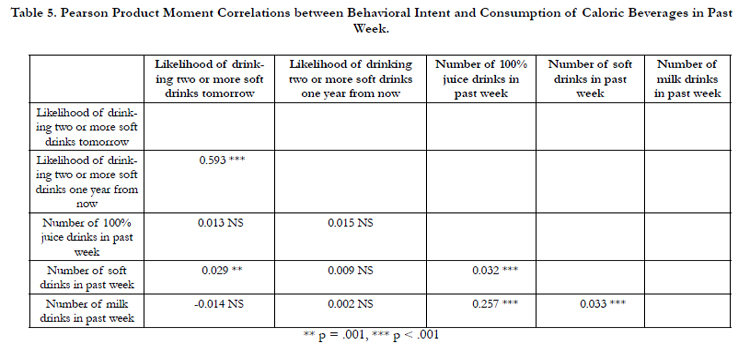
Table 5. Pearson Product Moment Correlations between Behavioral Intent and Consumption of Caloric Beverages in Past Week.
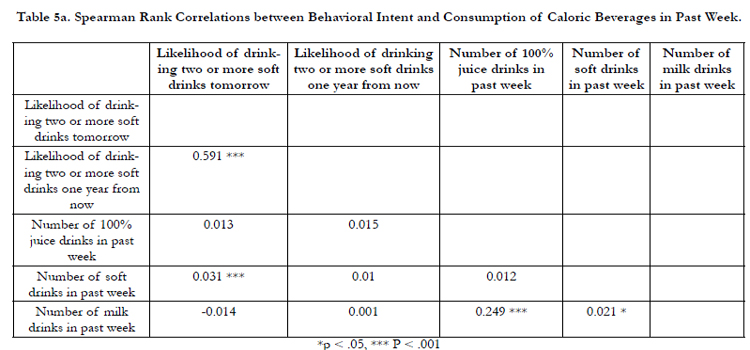
Table 5a. Spearman Rank Correlations between Behavioral Intent and Consumption of Caloric Beverages in Past Week.
Discussion
The purpose of this study was to report trends in CB consumption and behavioral intent from 2001 to 2011. Data revealed significant reductions in how often SD were consumed beginning in 2007- 2008. This trend appears to coincide with the Child Nutrition and WIC Reauthorization Act of 2004 that required education agencies that participate in the Federal School Lunch Program to establish policies and guidelines for competitive foods [30]. However, direct influence cannot be determined from this study, and the Child Nutrition and WIC Reauthorization Act of 2004 may have simply served as a catalyst to reduce home consumption of SD where the majority of these beverages are consumed [16]. This downward trend in SD consumption is also consistent with Han & Powell [31] who found declines in SD consumption from 1999-2008 in adolescents.
FJ and milk consumption remained consistent and showed no significant changes over the ten years. This is contrary with Lasater, Piernas & Popkin [32], who found a 28% reduction in overall milk consumption from 1989 to 2005-2008. Striegel-Moore et al. [33] also found milk consumption of black adolescent females to be lower than that of white adolescent females. Our FJ findings were contrary to the findings of Slining, Mathias & Popkin [34], who found a downward trend in FJ consumption in children and adolescents from 2003-2010. Future research with HH4K data should explore differences by demographic variables. Data also revealed significant, yet minimal correlations between SD consumption in the past week with FJ and milk consumption. Similarly, a significant yet moderate correlation was also found between FJ and milk consumption. These findings seem to support the CB construct and suggest further inquiry is necessary to determine whether water consumption is inversely correlated with CB.
Items examining behavioral intent indicate reduced intention to consume SD over ten years. These findings mirror the downward trend of SD consumption found in this study as well as those reported by Han and Powell [31]. It is interesting to note, however that only a small correlation was observed between reported SD consumption and intention to drink SD tomorrow, and no correlation was found between consumption and intention to consume SD in one year. In marketing, it is widely recognizedthat self-reported purchase intentions do not necessarily predict purchasing behavior [35]. These findings are inconsistent with the majority of health behavioral intent and consumption research [36, 37] suggesting further investigation is necessary to explain this finding.
In this study, SD did not appear to displace either milk or FJ. SD consumption declined across a ten-year period, and milk and FJ consumption remained constant. This is inconsistent with Striegel-Moore et al. [33], who reported that milk consumption decreased in relation to the increased SD consumption. Since SD tend to be the least nutrient-dense and most commonly consumed CB of the three categories represented in this study, this is beneficial and could have long-term benefits in total calorie consumption and subsequent weight management efforts. Consequently, there have been national trends showing a subsequent leveling off in BMI over this period as well [38]. Perhaps the patterns of reduced SD consumption have contributed to this positive indicator.
Since CB often provide calorie contributions as meal accompaniments, as between meal snacks, and as meal substitutes they tend to provide add-on calories [6] and may result in weight gain. Several researchers have reported an association of CB intake and body weight measures [32, 39]. If we viewed fluids as primarily a hydration agent, perhaps there would be a greater dependence on water as in earlier humans [3], and a reduction in overall caloric intake [40]. Water represents a calorie-free essential nutrient vital for cellular homeostasis, the regulation of body temperature, and the subsequent function of all bodily systems [41]. Inadequate water intake can be very debilitating and in its absence, life threatening within days [42].
Although CB can make a measurable contribution to overall nutrient needs, solid foods provide greater satiety, can be more nutrient- dense when chosen wisely, and invoke a caloric compensation response to calorie intake [8]. These factors can be instrumental for overall health and weight management especially in childhood. Children have been shown to simultaneously increase successive CB upon initial consumption of a CB [43]. In other words, CB need to be assessed within the context of overall dietary intake and balanced with the entire food and beverage intake.
Despite reduction in SD consumption in recent years, there has been an increase in non-traditional CB such as sports/energy drinks [31]. However, the overall CB intake is declining. Other CB such as fruit drinks (less than 100% FJ), energy drinks, and coffee with added flavorings tend to also be low nutrient dense beverages. Again, these beverages tend to contribute add-on calories and should be viewed as occasional beverages with some contribution to overall hydration needs. It is necessary to conduct further investigation into the extent to which CB’s displace water consumption.
The limitations of this study include the possibility of inaccurate reporting of dietary intake by the participants (self-reported data). Since these participants were students of teachers who voluntarily participated in HH4K, the results may not be indicative of national norms.
For future investigations with this population we suggest assessing the contribution of all beverages, calorie and non-calorie containing, to have a more comprehensive view of current consumption patterns. Since the commencement of this survey the contribution of sport and energy drinks, drinks with artificial sweeteners, and other non-traditional drinks have either entered the retail market or have substantially increased in popularity. Perhaps it would be wise to include all beverages consumed in future Youth Risk Behavior Surveillance studies (YRBSS) and other beverage survey research. Because we did not include all beverages in our investigation, we are unable to determine if the reduction in SD was displaced by other non-traditional beverages, such as energy drinks, or water as seen elsewhere [44].
In addition to CB consumption frequency and behavioral intent, a method for assessing serving size accuracy should be considered. The individual understanding and ability to accurately assess a serving size has been found to be highly variable [45]. One more aspect that may be beneficial in future investigations is the behavioral intent to consume FJ or milk in the future. These data would provide additional insights for future education and intervention models.
Acknowledgement and Declarations
None of the authors have a conflict of interest. No outside funding was provided for this project.
References
- Sun SS, Liang R, Huang TT, Daniels SR, Arslanian S, et al. (2008) Childhood obesity predicts adult metabolic syndrome: The Fels Longitudinal Study. J Pediatr 152(2): 191-200.
- Kosova EC, Auinger P, Bremer AA (2013) The relationships between sugar sweetened beverage intake and cardiometabolic markers in young children. J Acad Nutr Diet 113(2): 219-227.
- Wolf A, Bray GA, Popkin BM (2008) A short history of beverages and how our body treats them. Obes Rev 9(2): 151-164.
- Hamlin C (2000) The Cambridge World History of Food. Cambridge University Press, New York. http://www.cambridge.org/us/books/kiple/water.htm
- Riley JJ (1972) A History of the American Soft Drink Industry: bottled carbonated beverages, 1807-1957. Arno Press, New York.
- Bray GA, Popkin BM (2013) Calorie-sweetened beverages and fructose: what have we learned 10 years later. Pediatr Obes 8(4): 242-248.
- Ludwig DS, Peterson KE, Gortmaker SL (2001) Relation between consumption of sugar-sweetened drinks and childhood obesity: a prospective,observational analysis. Lancet 357(9255): 505-508.
- DiMeglio DP, Mattes RD (2000) Liquid versus solid carbohydrate: effects on food intake and body weight. Int J Obes Relat Metab Disord 24(6): 794-800.
- Mattes R (2006) Fluid calories and energy balance: The good, the bad, and the uncertain. Physiol Behav 89(1): 66-70.
- Cassady BA, Considine RV, Mattes RD (2012) Beverage consumption, appetite, and energy intake: what did you expect? Am J Clin Nutr 95(3): 587-593.
- Nielsen SJ, Popkin BM (2004) Changes in beverage intake between 1977 and 2001. Am J Prev Med 27(3): 205-210.
- O’Neil CE, Nicklas TA, Rampersaud GC, Fulgoni VL 3rd (2012) 100% Orange juice consumption is associated with better diet quality, improved nutrient adequacy, decreased risk for obesity, and improved biomarkers of health in adults: National Health and Nutrition Examination Survey, 2003- 2006.Nutr J 11:107.
- Dennison BA, Rockwell HL, Baker SL (1997) Excess fruit juice consumption by preschool-aged children is associated with short stature and obesity. Pediatrics 99(1): 15-22.
- Faith MS, Dennison BA, Edmunds LS, Stratton HH (2006) Fruit juice intake predicts increased adiposity gain in children from low-income families: weight status-by-environment interaction. Pediatrics 118(5): 2066-2075.
- O’Neil CE, Nicklas TA, Zanovec M, Fulgoni VL 3rd (2011) Diet quality is positively associated with 100% fruit juice consumption in children and adults in the United States: NHANES 2003-2006. Nutr J 10:17.
- Wang YC, Bleich SN, Gortmaker SL (2008) Increasing caloric contribution from sugar-sweetened beverages and 100% fruit juices among US children and adolescents, 1988 -2004. Pediatrics 121(6): e1604-1614.
- Turner L, Chaloupka FJ (2012) Encouraging trends in student access to competitive beverages in US public elementary schools, 2006-2007 to 2010- 2011. Arch Pediatr Adolesc Med 166(7): 673-675.
- Briefel RR, Wilson A, Gleason PM (2009) Consumption of low-nutrient, energy-dense foods and beverages at school, home, and other locations among school lunch participants and nonparticipants. J Am Diet Assoc 109(2): S79-S90.
- Fiorito LM, Marini M, Mitchell DC, Smiciklas-Wright H, Birch LL (2010) Girls’ early sweetened carbonated beverage intake predicts different patterns of beverage and nutrient intake across childhood and adolescence. J Am Diet Assoc 110(4): 543-550.
- Troiano RP, Briefel RR, Carroll MD, Bialostosky K (2000) Energy and fat intakes of children and adolescents in the United States: data from the National Health and Nutrition Examination Surveys. Am J Clin Nutr 72(5):1343S-1353S.
- Aeberli I, Gerber PA, Hochuli M, Kohler S, Haile SR et al. (2011) Low to moderate sugar-sweetened beverage consumption impairs glucose and lipid metabolism and promotes inflammation in healthy young men: a randomized controlled trial. Am J Clin Nutr 94(2): 479-485.
- ChanLin LJ, Huang RFS, Chan KC (2003) Web-based instruction in learning nutrition. J Instr Psychol 30(1): 12-21.
- Palmer S, Graham G, Elliott E (2005) Effects of a web-based health program on fifth grade children’s physical activity knowledge, attitudes and behavior. Am J Health Educ 36(2): 86-92. Online link: http://eric.ed.gov/?id=EJ792809
- U.S. Department of Health and Human Services (n.d.). Health Resources and Services Administration. About health literacy. Web site. http://www.hrsa.gov/publichealth/healthliteracy/healthlitabout.html
- Centers for Disease Control and Prevention. (2010) Youth Risk Behavior Surveillance – US, 2009, Surveillance Summaries. MMWR Morbidity and Mortality Weekly Report, 59(No. SS-5).Web link: http://www.cdc.gov/mmwr/pdf/ss/ss5905.pdf
- Centers for Disease Control and Prevention. (2014) Adolescent and school health.Website.http://www.cdc.gov/HealthyYouth/yrbs/index.htm?s_cid=tw_cdc16
- Sallis JF, McKenzie TL, Alcaraz, JE, Kolody B, Faucette N, et al. (1997) The effects of a 2-year physical education program (SPARK) on physical activity and fitness in elementary school students. Sports, Play and Active Recreation for Kids. Am J Public Health 87(8): 1328-1334.
- Smider E, Ziegler M, Danay E, Beyer L, and Bühner M (2010) Is it really robust? Reinvestigating the robustness of ANOVA against violations of the normality assumption. Methodology 6(4): 147-151.
- Puth M, Neuhäuser M, and Ruxton G (2014) Effective use of Pearson’s product moment correlation coefficient. Anim Behav 93: 183-189.
- U.S. Government (2004) Child Nutrition and WIC Reauthorization Act of 2004, Publ L No. 108-265, Section 204. Retrieved from: http://www.gpo.gov/fdsys/pkg/PLAW-108publ265/pdf/PLAW-108publ265.pdf
- Han E, Powell LM (2013) Consumption patterns of sugar-sweetened beverages in the United States. J Acad Nutr Diet 113(1): 43-53.
- Lasater G, Piernas C, Popkin BM (2011) Beverage patterns and trends among school-aged children in the US, 1989-2008. Nutr J 10: 103.
- Striegel-Moore RH, Thompson D, Affenito SG, Franko DL, Obarzanek E, et al. (2006) Correlates of beverage intake in adolescent girls: the National Heart, Lung, and Blood Institute growth and health study. J Pediatrics 148(2): 183-187.
- Slining MM, Mathias KC, Popkin BM (2013) Trends in food and beverage sources among US children and adolescents: 1989-2010. J Acad Nutr Diet 113(12): 1683-1694.
- Chandon P, Morwitz VG, Reinartz, W J (2005) Do Intentions Really Predict Behavior? Self-Generated Validity Effects in Survey Research. J Marketing 69(2): 1-14. Online link: http://faculty.insead.edu/pierre-chandon/documents/JP_Chandon%20do%20intentions%20predict%20behavior%20JM%202005.pdf
- Armitage CJ, Conner M (2001) Efficacy of the Theory of Planned Behaviour: A meta-analytic review. Br J Soc Psychol 40(Pt 4): 471-499.
- Kassem NO, Lee JW, Modeste NN, Johnston PK (2003) Understanding soft drink consumption among female adolescents using the Theory of Planned Behavior. Health Educ Res 18(3): 278-291.
- Ogden CL, Carroll MD, Kit BK, Flegal KM (2014) Prevalence of childhood and adult obesity in the United States, 2011-2012. JAMA 311(8):806-814.
- Hu FB (2013) Resolved: there is sufficient scientific evidence that decreasing sugar-sweetened beverage consumption will reduce the prevalence of obesity and obesity-related diseases. Obes Rev 14(8): 606-619.
- Stookey JD, Constant F, Gardner CD, Popkin BM (2007) Replacing sweetened caloric beverages with drinking water is associated with lower energy intake. Obesity 15(12): 3013-3022.
- Jéquier E, Constant F (2010) Water as an essential nutrient: the physiological basis of hydration. Eur J Clin Nutr 64(2): 115-123.
- Popkin BM, D’Anci KE, Rosenberg IH (2010) Water, hydration and health. Nutr Rev 68(8): 439-458.
- Oza-Frank R, Zavodny M, Cunningham SA (2012) Beverage displacement between elementary and middle school, 2004-2007. J Acad Nutr Diet 112(9): 1390-1396.
- Piernas C, Ng SW, Popkin B (2013) Trends in purchases and intake of foods and beverages containing caloric and low-calorie sweeteners over the last decade in the United States. Pediatr Obes 8(4): 294-306.
- Pettigrew S, Pescud M, Donovan RJ (2009) Is children’s knowledge of fruit and vegetable recommendations related to their intakes? Int Rev Pub Nonprof Market 6(2): 109-118.


