Changes in Plasma Phospholipid Fatty Acid Patterns and their Impact on Plasma Triglyceride Levels Following Fish Oil Supplementation
Cormier H1, Rudkowska I2,3, Lemieux S1, Couture P1, Julien P2, Vohl MC1,2*
1 Institute of Nutrition and Functional Foods (INAF), Laval University, Quebec City, Canada.
2 Endocrinology and Nephrology, CHU de Québec Research Center, Quebec City, Canada.
3 Department of Kinesiology, Laval University, Quebec City, Canada.
*Corresponding Author
Marie-Claude Vohl Ph.D.,
Institute of Nutrition and Functional Foods (INAF), Laval University,
2440 Hochelaga Blvd Québec, Québec, Canada, G1V 0A6.
Tel: (418) 656-2131, Extn. 4676
E-mail: marie-claude.vohl@fsaa.ulaval.ca
Received: May 20, 2015; Accepted: May 27, 2015; Published: May 29, 2015
Citation: Vohl MC et al., (2015) Changes in Plasma Phospholipid Fatty Acid Patterns and their Impact on Plasma Triglyceride Levels Following Fish Oil Supplementation. Int J Food Sci Nutr Diet. S2:001 1-10. doi: dx.doi.org/10.19070/2326-3350-SI02001
Copyright: Vohl MC© 2015. This is an open-access article distributed under the terms of the Creative Commons Attribution License, which permits unrestricted use, distribution and reproduction in any medium, provided the original author and source are credited.
Abstract
The objective of the present study was to test for associations between changes in fatty acids (FAs) and changes in plasma triglyceride (TG) levels after an n-3 FAs supplementation and to test whether SNPs from the FADS gene cluster were associated with plasma FA levels or with specific FA patterns. A total of 210 subjects completed a 2-wk run-in period followed by 6-wk supplementation with 5g/d of fish oil. FA profiles of plasma phospholipids (PPLs) were obtained and 19 SNPs from the FADS gene cluster were genotyped. Principal component analysis was conducted and scores were calculated. There was an increase in EPA, DPA and DHA levels in PPLs as well as a decrease in ALA and all n-6 FA levels after the supplementation. Factor analysis suggested 4 post-n-3 FA supplementation patterns. Changes in AA, ALA, DGLA, as well as changes in total n-3 and omega-6 FAs in absolute quantities of FAs were all associated with a change in TG levels whereas the correlation remained significant only for AA and DGLA when FAs were expressed as percentage of total FAs. Several SNPs from the FADS gene cluster were associated with post-supplementation FA levels. These results suggest that FAs alone or regrouped in factors could play a role in modulating plasma TG levels after fish oil supplementation. SNPs from the FADS gene cluster interact with both FAs and/or factors to modulate TG levels.
2.Introduction
3.Methods
3.1 Study Population
3.2 Study Design and Diets
3.3 SNPs Selection and Genotyping
3.4 Biochemical Parameters measurements
3.5 Measurement of FA Composition in Plasma Phospholipids
3.6 Principal Component Analysis (PCA)
3.7 Statistical Analysis
4.Results
4.1 Changes in plasma phospholipid FAs following an n-3 FA supplementation
5.Discussion
6.Strengths and Limitations
7.Conclusion
8.Acknowledgments
9.References
Keywords
Omega-3; Omega-6; EPA; DHA; Principal Component Analysis; Plasma Phospholipids; FADS; Genotype; Polymorphisms.
Introduction
Low levels of long-chain (LC) omega-3 (n-3) fatty acids (FA) in tissues are a marker of increased risk for coronary heart disease [1]. Though, results from a recent meta-analysis of the role of n-3 FA supplementation on major cardiovascular outcomes did not support a causal link between n-3 FA intakes and low risk of all-cause mortality, cardiac death, sudden death, myocardial infarction, or stroke based on relative and absolute measures of association [2]. Results from this meta-analysis remain controversial, as the mean doses of n-3 FAs used in several randomized clinical trials included in the analysis were lower than the doses of 2-4 grams/day of n-3 FAs recommended by the American Heart Association for patients with hypertriglyceridemia [3].
Incorporation of n-3 FAs into transport, functional and storage pools occur in a dose- and time-dependent manner [4]. Eicosapentaenoic acid (EPA) and docosahexaenoic acid (DHA) influence the physical nature of cell membranes, thus directly impacting on membrane protein-mediated responses, lipid mediators, cell signalling, and gene expression [5]. Moreover, an increased intake of polyunsaturated FAs of the n-3 series, in particular EPA and DHA, may have a favourable effect on serum lipids. These n-3 FAs act both directly by substituting arachidonic acid (AA) in cell membranes and by inhibiting AA metabolism [6]. The inhibition of AA metabolism favours the incorporation of n-3 FAs into cell membranes.
Any modifications in dietary fat intake affect the composition of cell membranes. Thus, principal component analysis (PCA) may be useful to show which variables are correlated with one another, possibly measuring the same construct. PCA allows reducing the number of observed variables, in the present study plasma phospholipid (PPL) FAs, into a smaller number of components that will account for most of the variance in comparison to one measured by FA itself. In the present study, PCA were made prior to- and after the n-3 FA supplementation to see if the supplementation itself may affect correlations between FAs.
Recent studies suggested that plasma n−6 and n−3 FA levels are associated with several common single nucleotide polymorphisms (SNPs) of the fatty acid desaturase (FADS) gene cluster [7-9].Genome- wide association studies (GWAS) have shown that SNPs of genes encoding enzymes involved in LC polyunsaturated FA metabolism affect plasma FA levels [10-12]. Genetic susceptibility may lead to a defect in the activity of specific enzymes named desaturases and elongases, and could possibly lead to the development of low-grade inflammation, insulin resistance, type 2 diabetes mellitus, metabolic syndrome, hypertension, atherosclerosis and ischemic heart disease [13].
We have previously reported that SNPs within the FADS gene cluster are associated with plasma desaturase activities after n-3 FA supplementation [14]. FADS1 and FADS2 genes encode respectively for two desaturases: δ-5 desaturase (D5D) and δ-6 desaturase (D6D) [7]. The D5D and D6D, responsible for double bonds formation in the n-3 FA pathways, have been associated with differences in FA composition of plasma [15], erythrocyte membranes [9] and adipose tissue [15].
The objectives of the present study was to test for associations between changes in percentage of FAs alone or regrouped as factors with changes in plasma triglyceride (TG) levels after the n-3 FAs supplementation and to test whether SNPs from the FADS gene cluster were associated with plasma FA levels or with specific FA patterns derived from PCA after the supplementation.
Methods
A total of 254 subjects from the greater Quebec City metropolitan area were recruited between September 2009 and December 2011 through advertisements in local newspapers as well as by electronic messages sent to university students/employees. Subjects had to be aged between 18 and 50 years old with a body mass index (BMI) between 25 and 40 kg/m². They had to be nonsmokers and free of any thyroid or metabolic disorders requiring treatment. Participants were excluded if they had taken n-3 FA supplements for at least 6 months prior to the beginning of the study. However, only 210 subjects completed the intervention protocol and blood lipid profile pre-and/or post-supplementation are missing for two participants. Statistical analyses were then performed on 208 individuals. The ethics committees of Laval University Hospital Research Center and Laval University approved the experimental protocol. This trial was registered at clinicaltrials.gov as NCT01343342.
The complete study design has been previously reported [16]. Briefly, subjects followed a run-in period of two weeks where a trained registered dietitian gave individual dietary instructions. Recommendations were drawn from the Canada’s Food Guide to Healthy Eating [17]. After a 2-week run-in period, each participant received a bottle containing capsules of n-3 FAs (Ocean Nutrition, Nova Scotia, Canada) covering the following six-week period. They had to take 5 capsules per day, which gave them a total of 3-3.3g of n-3 FAs (1.9-2.2g EPA and 1.1g DHA) per day. Subjects had to report any deviations that may have occurred during the protocol. They also had to write their alcohol and fish consumption on a log sheet. Before each phase of the study, subjects received written and oral dietary instructions by a registered dietitian.
SNPs in FADS1, FADS2, and FADS3 were identified using the International Hap Map Project SNP database, based on the National Center for Biotechnology Information (NCBI) B36 assembly Data Rel 28. phase II + III, build 126. The FADS gene cluster is made of three genes that are located very close to each other on chromosome 11. Because of the head-to-head orientation of FADS1 and FADS2 and the tail-to-tail orientation of FADS2 and FADS3, we added 500 kilo-base pairs (kbp) downstream of FADS1 and 2500 kbp upstream of FADS3 to cover promoter regions. Intergenic areas were also covered. Gene Tagger procedure in Haploview V4.2 was used to determine tag SNPs (tSNPs) using a minor allele frequency (MAF) ≥ 3% and pairwise tagging (r2≥0.8). Subsequently, we examined linkage disequilibrium (LD) out of the nineteen SNPs of the FADS gene cluster area using the LD Plot procedure in Haploview V4.2. The SIGMA Gen- Elute Gel Extraction Kit (Sigma-Aldrich Co. St.Louis. Missouri. USA) has been used to extract genomic DNA. Selected SNPs of the FADS gene cluster (rs174456, rs174627, rs482548, rs2072114, rs12807005, rs174448, rs2845573, rs7394871, rs7942717, rs74823126, rs174602, rs498793, rs7935946, rs174546, rs174570, rs174579, rs174611, rs174616 and rs968567) have been genotyped using validated primers and TaqMan probes (Thermo Fisher Scientific, Waltham, MA, USA). DNA was mixed with TaqMan Universal PCR Master Mix (Thermo Fisher Scientific, Waltham, MA, USA), with a gene-specific primer and with probe mixture (predeveloped TaqMan SNP Genotyping Assays; Thermo Fisher Scientific, Waltham, MA, USA)) in a final volume of 10μl. Genotypes were determined using a 7500 RT-PCR System and analyzed using ABI Prism SDS version 2.0.5 (Thermo Fisher Scientific, Waltham, MA, USA).
Fasting insulin concentrations were measured by radioimmunoassay with polyethylene glycol separation [18]. Fasting glucose concentrations were enzymatically measured [19]. Plasma C-reactive protein (CRP) was measured by nephelometry (Prospec equipment Behring) using a sensitive assay, as described previously [20]. Plasma total cholesterol and TG concentrations were measured using enzymatic assays [21]. The high-density lipoprotein cholesterol fraction was obtained after precipitation of very low-density lipoprotein and low-density lipoprotein particles in the infranatant with heparin manganese chloride [22]. Low-density lipoprotein cholesterol was calculated with the Friedewald formula [23].
Blood samples were collected from an antecubital vein into vacutainer tubes containing EDTA after 12 hours overnight fast and 48 hours alcohol abstinence. Plasma was separated by centrifugation at 500 g for 6 min and stored at –80°C for subsequent analyses. Plasma lipids were extracted with chloroform:methanol (2:1,by volume) according to a modified Folch method [24]. FA composition of PPLs was determined by gas chromatography. Total phospholipids were isolated with isopropyl ether:acetic acid (96:4) by thin layer chromatography [25]. Isolated PPLs were then methylated [26]. FA profiles were obtained after methylation in methanol/ benzene 4:1 (v/v) [26] and capillary gas chromatography using a temperature gradient on a HP5890 gas chromatograph (Hewlett Packard, Toronto, Canada) equipped with a HP-88 capillary column (100m x 0.25 mm i.d. x 0.20μm film thickness; Agilent Technologies, Palo Atto, CA) coupled with a flame ionization detector (FID). Helium was used as carrier gas (split ratio 1:80). FA were identified according to their retention time, using the following standard mixtures as a basis for comparison: the FAME 37 mix (Supelco Inc., Bellefonte, PA) and the GLC-411 FA mix (NuChek Prep Inc, Elysian, MN), as well as the following methylated FAs C22:5n-6 (Larodan AB, Malmö, Sweden) and C22:5n-3 (Supelco Inc., Bellefonte, PA).
Variables with abnormal distribution where logarithmically transformed before further analyses. Principal factor analysis was conducted in SAS v9.3 (SAS Institute Inc., Cary, North Carolina, USA) using the FACTOR procedure. Measured FAs (all-cis-8,11,14-eicosatrienoic acid (C20:3n-6, DGLA), docosatetraenoic acid (C22:4n-6), 4,7,10,13,16-docosapentaenoic acid (C22:5n-6), docosanoic acid (C22:0), tetracosanoic acid (C24:0), eicosanoic acid (C20:0), cis-9-octadecenoic acid (C18:1n-9), docosahexaenoic acid (C22:6n-3, DHA), 7,10,13,16,19-docosapentaenoic acid (C22:5n-3), eicosapentaenoic acid (C20:5n-3, EPA), octadecadienoic acid (C18:2n-6, LA), trans-11-octadecenoic acid (C18:1 trans-11), cis-6-octadecenoic acid (C18:1), trans-9-hexadecenoic acid (C16:1 trans-9), hexadecanoic acid (C16:0), hexadecenoic acid (C16:1), octadecanoic acid (C18:0), tetradecanoic acid (C14:0), octadecatrienoic acid (C18:3n-3, ALA), octadecenoic acid (C18:1n-7), all-cis-5, 8, 1, 14-eicosatetraenoic acid (C20:4n-6, AA), cis-11-eicosenoic acid (C20: 1n-9), eicosadienoic acid (C20:2n-6), cis-9-tetradecenoic acid (C14:1), cis-15-tetracosenoic acid (C24:1n-9), trans-9-octadecenoic acid (C18:1 trans-9) and eicosatrienoic acid (C20:3)) pre- and post-supplementation were analysed separately in order to develop components. To determine the number of factors to retain, components with Eigenvalue ≥ 2 at Screen test were considered. FAs with positive loadings contribute to the pattern; FAs with negative loadings are inversely associated with the pattern. In post-supplementation, 4 factors were considered (Figure 1). Looking at the rotated solution (rotation method: Varimax), FAs with absolute factor loadings ≥ 0.5 were regarded as significant contributors to the pattern. Each participant was given a score for the 4 post-supplementation factors. These scores were calculated from the sum of phospholipid FA concentrations multiplied by their matching scoring coefficients. These scores reflect the degree of each participant PPL FAs conforming to a FA pattern.
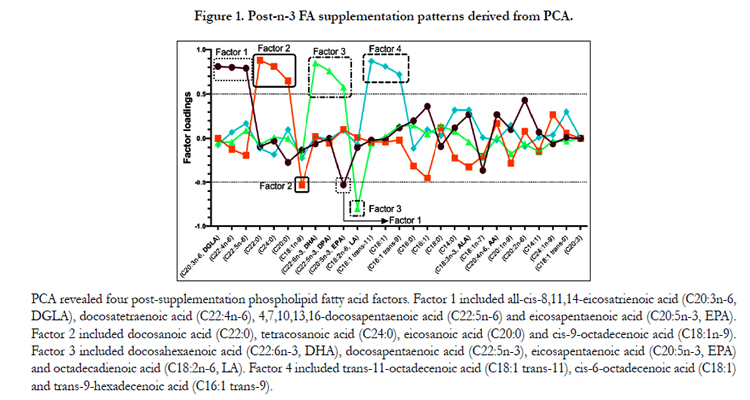
Figure 1. Post-n-3 FA supplementation patterns derived from PCA.
All genotype distributions were tested for any deviation from Hardy-Weinberg equilibrium (HWE) using the ALLELE procedure in S.A.S Genetics v9.3 (S.A.S Institute Inc., Cary, North Carolina, USA). Significance testing for linkage disequilibrium (LD) coefficient D was obtained using a chi-square test, likelihood ratio and Fisher exact test (p≤0.01). All other statistical analyses were carried out using S.A.S statistical software v9.3 (S.A.S Institute Inc., Cary, North Carolina, USA). Normal distribution was evaluated looking at the box-plot as well as skewness and kurtosis ranges for normal distribution. When needed, variables non-normally distributed were log10-transformed. A general linear model (GLM) was used to test for associations between PPL FAs and SNPs from the FADS gene cluster after an n-3 FA supplementation. GLM was adjusted for baseline PPL FAs levels for analyses involving post-supplementation data. For some SNPs, heterozygotes and homozygotes for the minor allele were grouped if the genotype frequency of the homozygotes for the minor allele was under 5%. Statistical significance was defined as p ≤ 0.05.
Results
SNPs within the FADS gene cluster are shown in Table 1. All SNPs were in HWE except rs7935946, located in an intron of FADS2. Thus, this SNP was not considered for further analyses. Daily energy intakes were calculated by a food frequency questionnaire validated for healthy French-Canadians [27] and are presented in Table 2. After the supplementation, carbohydrates, saturated fats, proteins and PUFA intakes were significantly different from the pre n-3 FA period (p=0.0005; p=0.0008; p=0.02; and p=0.003, respectively). Subjects have significantly decreased their fasting plasma TG levels (-11.9%, p<0.0001) and have slightly increased their fasting glucose levels (+2.4%, p=0.02) (Table 2).
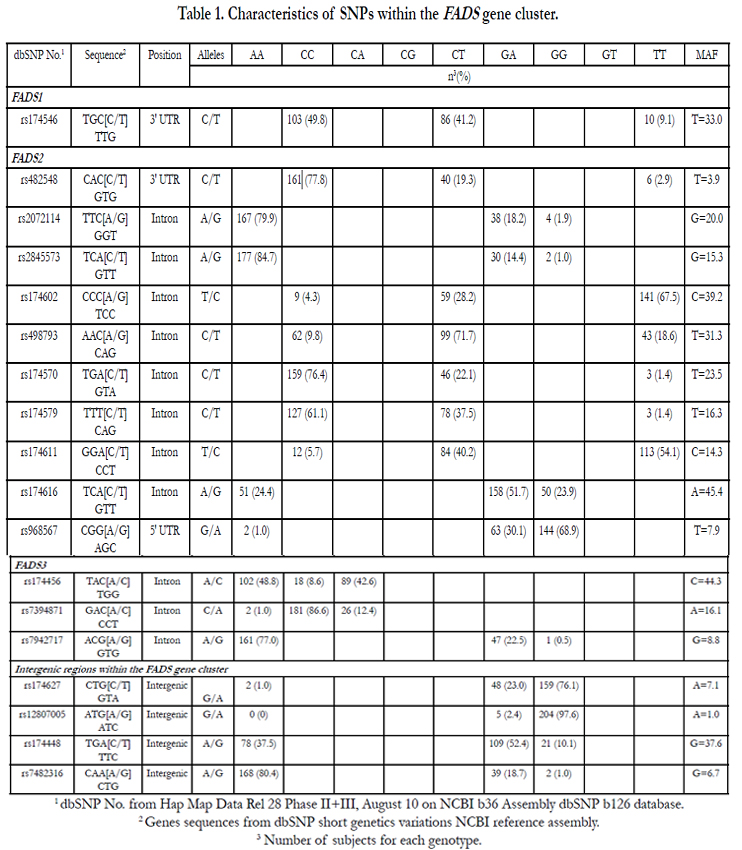

Table 1. Characteristics of SNPs within the FADS gene cluster.
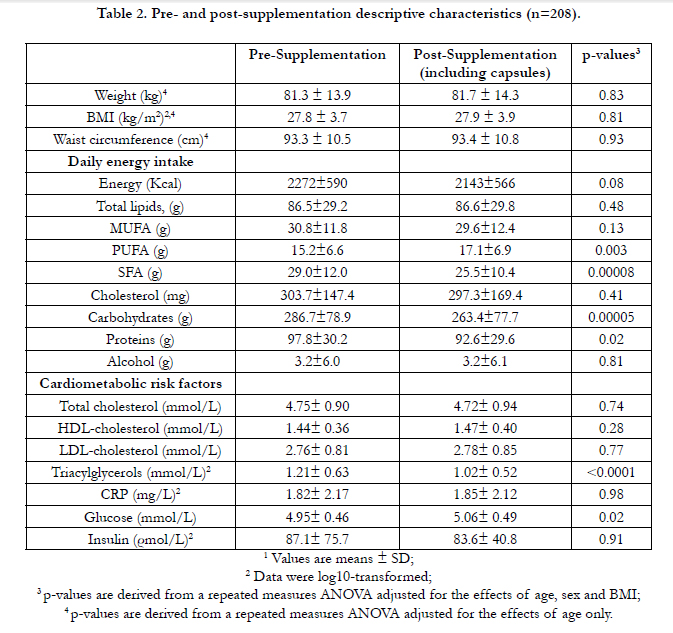
Table 2. Pre- and post-supplementation descriptive characteristics (n=208).
Changes in PPL FAs (in percentage of total FAs) following a 6-week n-3 FA supplementation are reported in Table 3. Briefly, there was an increase in EPA, DPA and DHA levels in PPLs as well as a decrease in ALA and all n-6 FA levels after the supplementation (p≤0.0002, for all). A significant decrease was observed for all MUFA levels in PPLs except for cis-9-tetradecenoic acid (C14: 1) and for cis-15-tetracosenoic acid (C24: 1n-9) for which non-significant increases were observed. For SFA levels, small, but significant increases were observed in PPLs with> 18-carbon atoms FAs (p< 0.007 for all). Factor analysis suggested 4 post-n3 FA supplementation patterns. Figure 1 shows the composition of the 4 main post-supplementation factors. A factor loading ≥ 0.5 indicates a strong positive association with the FAs profile whereas a factor loading ≤ -0.5 indicates a strong inverse association with the FAs profile. Factor 1 included all-cis-8,11,14-eicosatrienoic acid (C20:3n-6, DGLA), docosatetraenoic acid (C22:4n-6), 4, 7, 10, 13, 16-docosapentaenoic acid (C22:5n-6) and eicosapentaenoic acid (C20:5n-3, EPA). Factor 2 included docosanoic acid (C22:0), tetracosanoic acid (C24:0), eicosanoic acid (C20:0) and cis-9-octadecenoic acid (C18:1n-9). Factor 3 included docosahexaenoic acid (C22:6n-3, DHA), 7, 10, 13, 16, 19-docosapentaenoic acid (C22:5n-3), eicosapentaenoic acid (C20:5n-3, EPA) and octadecadienoic acid (C18:2n-6, LA). Factor 4 included trans-11-octadecenoic acid (C18:1trans-11), cis-6-octadecenoic acid (C18:1) and trans-9-hexadecenoic acid (C16:1 trans-9).
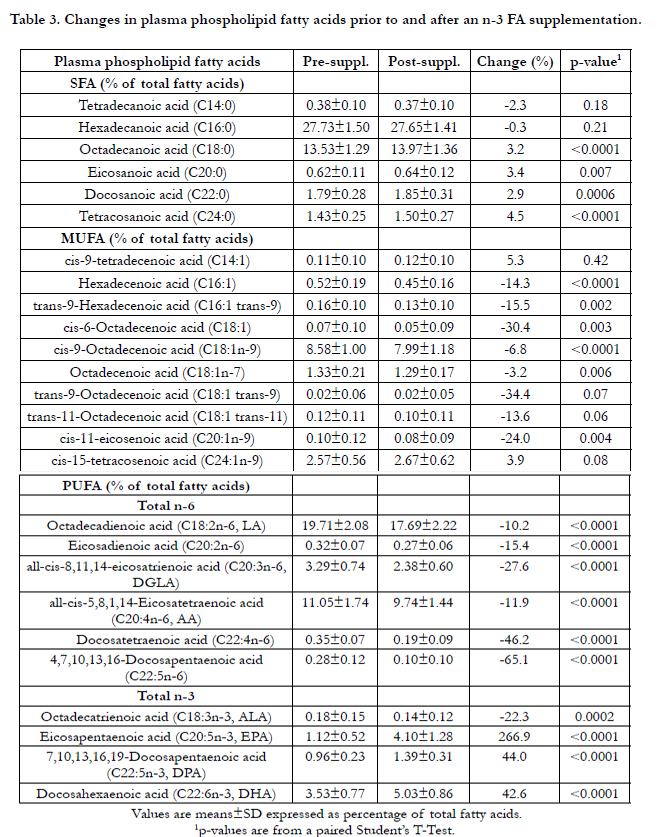
Table 3. Changes in plasma phospholipid fatty acids prior to and after an n-3 FA supplementation.
Table 4 shows the differences in post-supplementation FA pattern scores between positive (delta TG < 0) and negative (delta TG ≥ 0) responders based on their plasma TG levels after a 6-wk fish oil supplementation. Overall, there appears to be a tendency to show FA pattern scores in the opposite direction between positive and negative responders and this difference is significant for factor 2 (p=0.02).
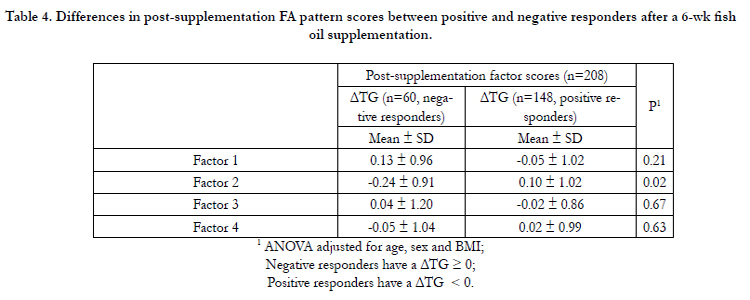
Table 4. Differences in post-supplementation FA pattern scores between positive and negative responders after a 6-wk fish oil supplementation.
Table 5 shows Pearson correlation coefficients between change in TG levels (TG post- minus TG pre-supplementation in mmol/L) and changes in FAs alone or regrouped as factors after the 6-week n-3 FA supplementation. Changes in AA, ALA, DGLA, as well as changes in total n-3 and n-6 FAs in absolute quantities of FAs (model 1) were all associated with a change in TG levels in the total cohort (p<0.04, for all) whereas the correlation remained significant only for AA and DGLA when FAs were expressed as percentage of total FAs (model 2). When subjects are stratified in negative or positive responders on the basis of plasma TG levels, a positive correlation was observed between change in TG levels and the change in DGLA in absolute quantities in both groups (model 1). When changes were expressed as percentage of total FAs, there was a positive and significant correlation observed between the change in TG levels and the change in DGLA only for negative responders (model 2). In positive responders, percent changes in EPA, DHA and in factor 1 were correlated to the change in plasma TG levels (model 2).
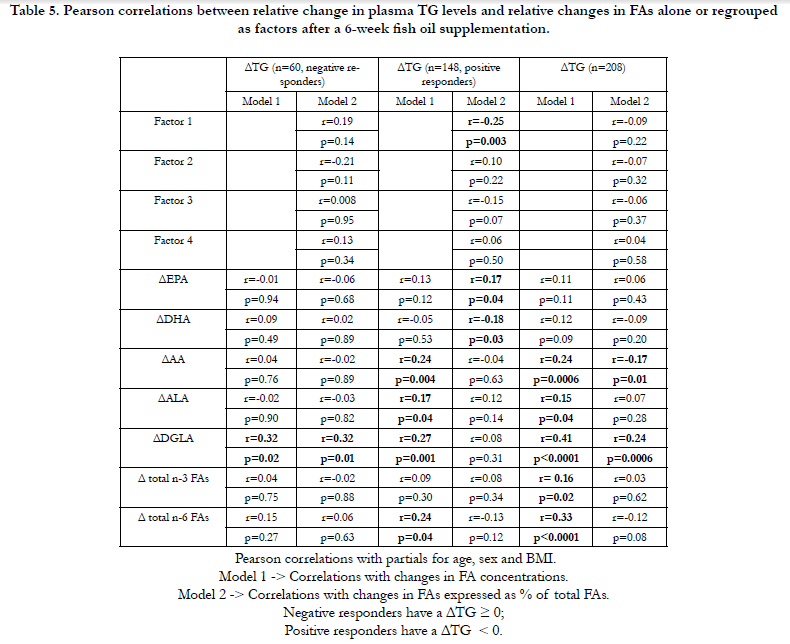
Table 5. Pearson correlations between relative change in plasma TG levels and relative changes in FAs alone or regrouped as factors after a 6-week fish oil supplementation.
In a general linear model adjusted for the effects of age, sex, BMI and baseline FA levels, several SNPs from the FADSgene cluster were associated with post-supplementation FA levels, especially with ALA levels (7 SNPs), AA levels (2 SNPs) and EPA levels (2 SNPs) as shown in Table 6. Associations between SNPs from the FADS gene cluster and post-supplementation factors derived from PCA (1 SNP associated with Factor 1 and 2 SNPs associated with Factors 2, 3 and 4) were also observed using the same statistical model, but with post-supplementation factors as the dependent variable (Table 6).
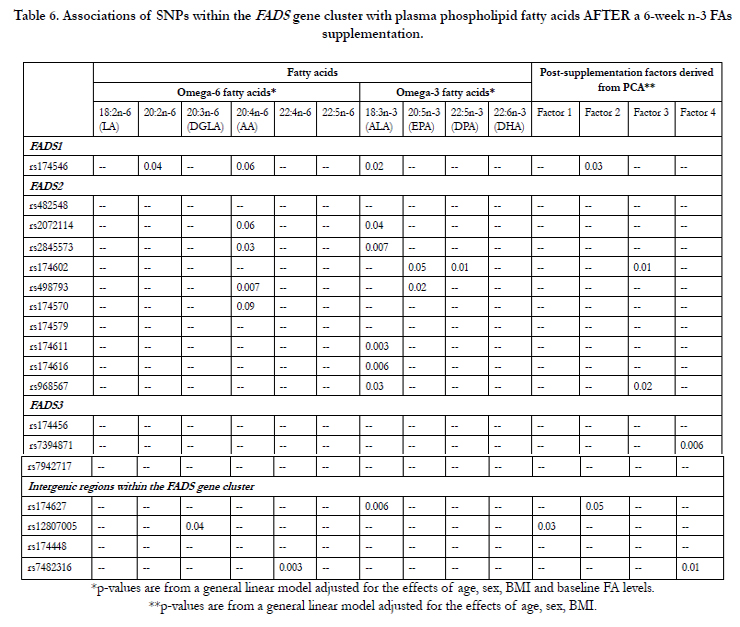
Table 6. Associations of SNPs within the FADS gene cluster with plasma phospholipid fatty acids AFTER a 6-week n-3 FAs supplementation.
Discussion
In this study, we tested whether PPL FAs individually or regrouped as FA patterns were associated with a change in TG levels following an n-3 FA supplementation and whether SNPs from the FADS gene cluster influence changes in PPL FAs and FA patterns. To our knowledge, this is the first study to investigate the effects of FADS SNPs on FA profiles derived from factor analysis after a supplementation with high doses of n-3 FAs.
Despite Rizos et al. (2012) have had difficulty demonstrating the causality link between n-3 FA intakes and lower risk of all-cause mortality, Hartweg et al. have conducted a systematic review including 23 randomized clinical trials and have shown that n-3 FAs exert beneficial effects on CVD risk factors such as plasma TG and VLDL- cholesterol levels with no adverse effects of the intervention [2, 28]. There is a growing body of evidence underlining the importance of the FA composition of membranes in health and disease. For instance, higher plasma levels of DHA are associated with a more favorable CVD risk profile [29] and higher plasma levels of EPA are inversely associated with the risk of major coronary events [30]. A recent review by Kaur et al. (2011) suggested that n-3 DPA may also have potential beneficial properties on metabolic health [31].
FA patterns can be altered by factors known to modulate lipid metabolism such as visceral obesity, insulin resistance and inflammation [32]. In the present study, there were no significant changes in BMI, insulin resistance and inflammation-related traits (data not shown). However, only results with PCA post-supplementation are presented in this paper to better reflect the changes in FA patterns after the intake of n-3 FA supplements, because FA patterns depend largely on dietary fat intake [33, 34]. The lipid profile of individuals undertaking a supplementation with n-3 FAs is altered as shown by variations in individual FA levels after the supplementation (Table 3). This metabolic signature could provide new insights on the role of groups of FAs strongly correlated and their ability to act as better biomarkers than FA levels alone measured in PPLs after a supplementation with high doses of n-3 FAs.
There was a difference in post-supplementation FA pattern scores between positive and negative responders with regard to Factor 2 after a 6-wk fish oil supplementation. Although this difference did not remain significant for the other factors, we observed a trend with scores going in the opposite direction between positive and negative responders, meaning that FA composition of PPLs is probably different among these individuals.The composition of Factor 2 indicates a strong positive correlation between longchain and very long chain saturated FAs in addition to a negative correlation with oleic acid. In our study, there was a small but significant increase of saturated FAs in PPLs (expressed as % of total FAs, Table 3), but not when looking at absolute quantities (data not shown). This change observed in plasma TG levels does not seem to be related to the activation of PPAR-α by saturated FAs because saturated FAs with ≥20 carbon units failed to bind well with any of the PPARs [35]. The mechanism by which Factor 2 may be associated with a decrease in plasma TG levels could rely on the substrate specificity of the lipoprotein lipase (LPL) depending of the FA chain length and the degree of FA saturation. Even if LPL has a lower affinity for monoacylglycerol that contains a saturated acyl group, it has a higher affinity for LC TGs vs. medium-chain TGs [36, 37].
Post-supplementation Factor 1 included long-chain n-6 FAs with positive factor loadings as well as EPA with negative factor loadings. Moreover, Factor 1 correlates significantly with the change in plasma TG levels in positive responders as shown in Table 5 (r=-0.25, p=0.003). According to these correlation patterns, individuals with a high positive score (characterized by ↑DGLA, ↑4,7,10,13,16-Docosapentaenoic acid, ↑docosatetraenoic acid, ↓EPA) are more likely to be characterized by an increase TG concentrations while individuals having a high negative score (characterized by ↓DGLA, ↓4,7,10,13,16-Docosapentaenoic acid, ↓ docosatetraenoic acid, ↑EPA) were more likely to display a decrease in TG after the 6-week n-3 FA supplementation. Factor 1 is similar to the product-to-precursor ratio of EPA to ALA often used as a surrogate measure of desaturase activity [38, 39]. In this study, SNP rs12807005 was associated with post-supplementation Factor 1. We have previously shown that carriers of the minor allele of rs12807005 had significantly higher plasma TG levels after the supplementation [16]. Moreover, we have shown that this SNP could also modulate estimate of D5D activity following fish oil supplementation whereas carriers of the minor allele had a lower D5D activity post-supplementation, often associated with adverse profiles of several metabolic risk factors [14, 40, 41]. Altogether, these results suggests that genetic predispositions may lead to more or less long-chain FAs conversion depending on the genotype and may affect plasma TG response. Interestingly, Lemaitre et al. have shown that minor alleles of SNPs in FADS1 and FADS2 were associated with higher levels of ALA and lower levels of EPA and DPA, which is in accordance with our results showing that SNPs from the FADS gene cluster could also modulate FAs levels regrouped as a unique pattern [12]. A previous GWAS on our study population has highlighted new loci that could possibly explain the difference observed in plasma TG response after an n-3 FA supplementation between positive and negative responders characterized by delta TG levels < 0 or ≥ 0, espectively [42].
Interestingly, factor 3 post-supplementation included DHA (factor loading: 0.85), DPA (factor loading: 0.76), EPA (factor loading: 0.58) and LA (factor loading: -0.80) meaning that the increase of plasma FAs levels of DHA, DPA and EPA after the supplementation is highly correlated to a strong decrease in LA levels as measured in PPLs. However, this factor was not associated with a change in plasma TG levels in this study.
According to Lemaitre et al., it is estimated that SNPs could account for 40 to 70% of the inter-individual variability observed in red blood cell (RBC) FAs and that there are shared genetic effects that could either be positive or negative between several FAs [43]. Thereby, we believed that changes in FA patterns could be partly attributable to genetic factors such as SNPs of the three studied genes. This study shows that SNPs from the FADS gene cluster may affect the FA composition of PPLs after the supplementation. Some SNPs are even associated to a specific FA pattern, herein named Factors 1, 2, 3 or 4. Previous studies from our group have shown that FADS2 gene expression was changed after the 6-week n-3 FA supplementation, possibly leading to alterations in the metabolic pathways of n-6 and n-3 FAs because of the involvement of the D6D [44].
SNPs in FADS1, which catalyzes the biosynthesis of highly unsaturated FAs from precursor essential PUFAs, and two other members of the same gene family, FADS2 and FADS3, have been previously associated with FA levels (measured in PPLs or in RBCs) or with cardiometabolic traits, even at genome-wide significance levels [12, 45, 46]. By directing FAs down this metabolic pathway, increased activity of these enzymes may lower circulating TG concentrations [47]. Moreover, the use of D6D twice in the conversion of ALA to DHA in the n-3 FAs pathway and in the conversion of LA to AA implies that this enzyme may play a key regulatory role in the PUFA metabolism [48]. Previous data from our research group have shown that gene-diet interactions with several SNPs from the FADS gene cluster could potentially modulate the enzyme activities of desaturases and elongases involved in the FA metabolism post-supplementation, possibly leading to different FA levels in PPLs [14]. According to Hong et al., SNPs from the FADS gene cluster can affect age-associated changes in serum phospholipid LC FAs in addition to D5D activity, and oxidative stress in middle-aged non-obese men [49]. A recent GWAS of PUFAs in the InCHIANTI Study have shown that the mutated allele of rs174537 was associated with higher ALA and LA levels and lower AA, EPA, DPA and DHA levels [50]. Results from that GWAS have been replicated in the GOLDN study, where there were significant associations of rs174537 (in high LD with rs174546, r2=0.99) with ALA, LA, AA, EPA and DHA (p<0.001) and marginal association with DPA (p=0.068). In the present study, rs174546 (in high LD with rs174537, r<span class="super">2</span>=0.99), has been associated with ALA, LA, AA, DGLA levels post-supplementation, but not with LC n-3 FAs, as shown by others. However, this SNP was associated with post-supplementation Factor 2 that regroups several saturated FAs as one component.
Strengths and Limitations
This is a well-designed study to look at associations with genetic factors after a 6-week n-3 FA supplementation with sufficient statistical power to show significant associations. High doses of n-3 FAs were given to study participants and the compliance was really high as calculated by the remaining capsules from bottles returning and as shown by increased levels of n-3 FAs into PPLs. Recent evidence suggests that PPL FA pool may be more affected by recent fat consumption and that it would be more effective to look at FAs in RBCs especially in the context of genetic studies [51]. FAs were also measured in RBCs in the present study, but only in 30 individuals. However, the combined levels of EPA and DHA in PPLs correlated with levels from RBCs after the supplementation (r=0.47, p=0.02) [52]. Thus, PCA were done using FAs measured in PPLs.
Conclusion
It is clear that each FA has its own particular effect on lipid metabolism. This study shows that not only polyunsaturated FAs alone could play a role in modulating plasma TG levels in response to a supplementation with n-3 FAs, but also that several FAs strongly correlated and regrouped as factors could be considered. These factors could potentially act as better biomarkers than FA levels alone measured in PPLs. Dissemination of negative or positive responders to the n-3 FA supplementation may be more effective when looking at individuals scoring high to a specific FA pattern rather than looking at FAs alone. Moreover, SNPs from the FADS gene cluster have the ability to interact with both FAs and/ or factors to possibly modulate TG levels.
Acknowledgments
We thank Catherine Raymond, Ann-Marie Paradis, Élisabeth Thifault, Catherine Ouellette, Véronique Garneau, Frédéric Guénard and Annie Bouchard-Mercier who contributed to the success of this study. This work was supported by an operating grant from the Canadian Institutes of Health Research (CIHR) (MOP-110975). Hubert Cormier received a doctoral research award from the CIHR. Iwona Rudkowska is recipient of a Junior 1 scholarship from the Fonds de recherche du Québec - Santé. Marie-Claude Vohl holds a Tier 1 Canada Research Chair in Genomics Applied to Nutrition and Health.
References
- Harris W. S, Poston W.C, Haddock C. K (2007) Tissue n− 3 and n− 6 fatty acids and risk for coronary heart disease events. Atherosclerosis 193(1):1-10.
- Rizos EC, Ntzani EE, Bika E, Kostapanos MS, Elisaf MS (2012) Association Between Omega-3 Fatty Acid Supplementation and Risk of Major Cardiovascular Disease Events A Systematic Review and Meta-analysis. Jama-J Am Med Assoc 308:1024-1033.
- Kris-Etherton PM, Harris WS, Appel LJ, American Heart Association. Nutrition C (2002) Fish consumption, fish oil, omega-3 fatty acids, and cardiovascular disease. Circulation 106:2747-2757.
- Calder, P. C. (2014), Very long chain omega-3 (n-3) fatty acids and human health. Eur. J. Lipid Sci. Technol., 116: 1280–1300
- Calder P. C, Yaqoob P (2009) Understanding omega-3 polyunsaturated fatty acids. Postgraduate medicine 121(6):148-157.
- Calder PC (2006) n-3 polyunsaturated fatty acids, inflammation, and inflammatory diseases. The American journal of clinical nutrition 83:1505S-1519S.
- Malerba G, Schaeffer L, Xumerle L, Klopp N, Trabetti E, et al. (2008) SNPs of the FADS gene cluster are associated with polyunsaturated fatty acids in a cohort of patients with cardiovascular disease. Lipids 43:289-299.
- Schaeffer L, Gohlke H, Muller M, Heid IM, Palmer LJ, et al. (2006) Common genetic variants of the FADS1 FADS2 gene cluster and their reconstructed haplotypes are associated with the fatty acid composition in phospholipids. Human molecular genetics 15:1745-1756.
- Rzehak P, Heinrich J, Klopp N, Schaeffer L, Hoff S, et al. (2009) Evidence for an association between genetic variants of the fatty acid desaturase 1 fatty acid desaturase 2 ( FADS1 FADS2) gene cluster and the fatty acid composition of erythrocyte membranes. The British journal of nutrition 101:20-26.
- Guan W, Steffen BT, Lemaitre RN, Wu JH, Tanaka T, et al. (2014) Genomewide association study of plasma N6 polyunsaturated fatty acids within the cohorts for heart and aging research in genomic epidemiology consortium. Circulation. Cardiovascular genetics 7:321-331.
- Wu JH, Lemaitre RN, Manichaikul A, Guan W, Tanaka T, et al. (2013) Genome-wide association study identifies novel loci associated with concentrations of four plasma phospholipid fatty acids in the de novo lipogenesis pathway: results from the Cohorts for Heart and Aging Research in Genomic Epidemiology (CHARGE) consortium. Circulation. Cardiovascular genetics 6:171-183.
- Lemaitre RN, Tanaka T, Tang W, Manichaikul A, Foy M, et al. (2011) Genetic loci associated with plasma phospholipid n-3 fatty acids: a meta-anal-ysis of genome-wide association studies from the CHARGE Consortium. PLoS genetics 7:e1002193.
- Das UN (2010) A defect in Delta6 and Delta5 desaturases may be a factor in the initiation and progression of insulin resistance, the metabolic syndrome and ischemic heart disease in South Asians. Lipids in health and disease 9:130.
- Cormier H, Rudkowska I, Lemieux S, Couture P, Julien P, et al. (2014) Effects of FADS and ELOVL polymorphisms on indexes of desaturase and elongase activities: results from a pre-post fish oil supplementation. Genes & nutrition 9:437.
- Warensjo E, Rosell M, Hellenius ML, Vessby B, De Faire U, et al. (2009) Associations between estimated fatty acid desaturase activities in serum lipids and adipose tissue in humans: links to obesity and insulin resistance. Lipids in health and disease 8:37.
- Cormier H, Rudkowska I, Paradis AM, Thifault E, Garneau V, et al. (2012) Association between polymorphisms in the fatty acid desaturase gene cluster and the plasma triacylglycerol response to an n-3 PUFA supplementation. Nutrients 4:1026-1041.
- (2007) Eating Well with Canada's Food Guide. In:Health Canada
- Desbuquois B, Aurbach GD (1971) Use of polyethylene glycol to separate free and antibody-bound peptide hormones in radioimmunoassays. The Journal of clinical endocrinology and metabolism 33:732-738.
- Richterich R, Kuffer H, Lorenz E, Colombo JP (1974) [The determination of glucose in plasma and serum (hexokinase-glucose-6-phosphate dehydrogenase method) with the Greiner electronic selective analyzer GSA II (author's transl)]. Zeitschrift fur klinische Chemie und klinische Biochemie 12:5-13.
- Pirro M, Bergeron J, Dagenais GR, Bernard PM, Cantin B, et al. (2001) Age and duration of follow-up as modulators of the risk for ischemic heart disease associated with high plasma C-reactive protein levels in men. Archives of internal medicine 161:2474-2480.
- McNamara JR, Schaefer EJ (1987) Automated enzymatic standardized lipid analyses for plasma and lipoprotein fractions. Clinica chimica acta; international journal of clinical chemistry 166:1-8.
- Albers JJ, Warnick GR, Wiebe D, King P, Steiner P, et al. (1978) Multilaboratory comparison of three heparin-Mn2+ precipitation procedures for estimating cholesterol in high-density lipoprotein. Clinical chemistry 24:853-856.
- Friedewald WT, Levy RI, Fredrickson DS (1972) Estimation of the concentration of low-density lipoprotein cholesterol in plasma, without use of the preparative ultracentrifuge. Clinical chemistry 18:499-502.
- Shaikh NA, Downar E (1981) Time course of changes in porcine myocardial phospholipid levels during ischemia. A reassessment of the lysolipid hypothesis. Circulation research 49:316-325.
- Fozzard HA, Haber E, Jennings RB, Katz AM (1986) The heart and cardiovascular system.
- Lepage G, Roy CC (1986) Direct transesterification of all classes of lipids in a one-step reaction. Journal of lipid research 27:114-120.
- Goulet J, Nadeau G, Lapointe A, Lamarche B, Lemieux S (2004) Validity and reproducibility of an interviewer-administered food frequency questionnaire for healthy French-Canadian men and women. Nutrition journal 3:13.
- Hartweg J, Perera R, Montori V. M, Dinneen S. F, Neil A. H, et al. (2008). Omega‐3 polyunsaturated fatty acids (PUFA) for type 2 diabetes mellitus.The Cochrane Library.
- Garneau V, Rudkowska I, Paradis AM, Godin G, Julien P, et al. (2013) Association between plasma omega-3 fatty acids and cardiovascular disease risk factors. Applied physiology, nutrition, and metabolism = Physiologie appliquee, nutrition et metabolisme 38:243-248.
- Itakura H, Yokoyama M, Matsuzaki M, Saito Y, Origasa H, et al. (2011) Relationships between plasma fatty acid composition and coronary artery disease. Journal of atherosclerosis and thrombosis 18:99-107.
- Kaur G, Cameron-Smith D, Garg M, Sinclair AJ (2011) Docosapentaenoic acid (22:5n-3): a review of its biological effects. Progress in lipid research 50:28-34.
- Kelley DE, Goodpaster B, Wing RR, Simoneau JA (1999) Skeletal muscle fatty acid metabolism in association with insulin resistance, obesity, and weight loss. The American journal of physiology 277:1130-1141.
- Ma J, Folsom AR, Shahar E, Eckfeldt JH (1995) Plasma fatty acid composition as an indicator of habitual dietary fat intake in middle-aged adults. The Atherosclerosis Risk in Communities (ARIC) Study Investigators. The American journal of clinical nutrition 62:564-571.
- King IB, Lemaitre RN, Kestin M (2006) Effect of a low-fat diet on fatty acid composition in red cells, plasma phospholipids, and cholesterol esters: investigation of a biomarker of total fat intake. The American journal of clinical nutrition 83:227-236.
- Xu HE, Lambert MH, Montana VG, Parks DJ, Blanchard SG, et al. (1999) Molecular recognition of fatty acids by peroxisome proliferator-activated receptors. Molecular cell 3:397-403.
- Deckelbaum RJ, Hamilton JA, Moser A, Bengtsson-Olivecrona G, Butbul E, et al. (1990) Medium-chain versus long-chain triacylglycerol emulsion hydrolysis by lipoprotein lipase and hepatic lipase: implications for the mechanisms of lipase action. Biochemistry 29:1136-1142.
- Miller CH, Parce JW, Sisson P, Waite M (1981) Specificity of lipoprotein lipase and hepatic lipase toward monoacylglycerols varying in the acyl composition. Biochimica et biophysica acta 665:385-392.
- Martinelli N, Girelli D, Malerba G, Guarini P, Illig T, et al. (2008) FADS genotypes and desaturase activity estimated by the ratio of arachidonic acid to linoleic acid are associated with inflammation and coronary artery disease. The American journal of clinical nutrition 88:941-949.
- Vessby B, Gustafsson IB, Tengblad S, Boberg M, Andersson A (2002) Desaturation and elongation of Fatty acids and insulin action. Annals of the New York Academy of Sciences 967:183-195.
- Murakami K, Sasaki S, Takahashi Y, Uenishi K, Watanabe T, et al. (2008) Lower estimates of delta-5 desaturase and elongase activity are related to adverse profiles for several metabolic risk factors in young Japanese women. Nutrition research 28:816-824.
- Sethom MM, Fares S, Feki M, Hadj-Taieb S, Elasmi M, et al. (2011) Plasma fatty acids profile and estimated elongase and desaturases activities in Tunisian patients with the metabolic syndrome. Prostaglandins, leukotrienes, and essential fatty acids 85:137-141.
- Rudkowska I, Guenard F, Julien P, Couture P, Lemieux S, et al. (2014) Genome-wide association study of the plasma triglyceride response to an n-3 polyunsaturated fatty acid supplementation. Journal of lipid research 55:1245-1253.
- Lemaitre RN, Siscovick DS, Berry EM, Kark JD, Friedlander Y (2008) Familial aggregation of red blood cell membrane fatty acid composition: the Kibbutzim Family Study. Metabolism: clinical and experimental 57:662- 668.
- Rudkowska I, Paradis AM, Thifault E, Julien P, Barbier O, et al. (2013) Differences in metabolomic and transcriptomic profiles between responders and non-responders to an n-3 polyunsaturated fatty acids (PUFAs) supplementation.Genes & nutrition 8:411-423.
- Tintle NL, Pottala JV, Lacey S, Ramachandran V, Westra J, et al. (2015) A genome-wide association study of saturated, mono- and polyunsaturated red blood cell fatty acids in the Framingham Heart Offspring Study. Prostaglandins, leukotrienes, and essential fatty acids 94:65-72.
- Gieger C, Geistlinger L, Altmaier E, Hrabe de Angelis M, Kronenberg F, et al. (2008) Genetics meets metabolomics: a genome-wide association study of metabolite profiles in human serum. PLoS genetics 4:e1000282.
- Dupuis J, Langenberg C, Prokopenko I, Saxena R, Soranzo N, et al. (2010) New genetic loci implicated in fasting glucose homeostasis and their impact on type 2 diabetes risk. Nature genetics 42:105-116.
- Portolesi R, Powell BC, Gibson RA (2007) Competition between 24:5n-3 and ALA for Delta 6 desaturase may limit the accumulation of DHA in HepG2 cell membranes. Journal of lipid research 48:1592-1598.
- Hong SH, Kwak JH, Paik JK, Chae JS, Lee JH (2013) Association of polymorphisms in FADS gene with age-related changes in serum phospholipid polyunsaturated fatty acids and oxidative stress markers in middle-aged nonobese men. Clinical interventions in aging 8:585-596.
- Tanaka T, Shen J, Abecasis GR, Kisialiou A, Ordovas JM, et al. (2009) Genome-wide association study of plasma polyunsaturated fatty acids in the InCHIANTI Study. PLoS genetics 5:e1000338.
- Harris WS, Varvel SA, Pottala JV, Warnick GR, McConnell JP (2013) Comparative effects of an acute dose of fish oil on omega-3 fatty acid levels in red blood cells versus plasma: implications for clinical utility. Journal of clinical lipidology 7:433-440.
- Rudkowska I, Plourde M, Julien P, Lemieux S, Couture P, et al. (2010) Fatty acids of plasma phospholipids and erythrocytes are reliable biomarkers of n-3 polyunsaturated fatty acid supplementation. The FASEB Journal 24 (1):939.936.


