The Effect Of Some Fruits Addition on the Nutritional, Microbiological And Sensory Qualities of Sorghum (Sorghum Bicolour) Based Pito
Adelekan Aminat. O*, Arisa Ngozi. U, Alamu A, Adebayo Yetunde.O, Omolara O
* Department of Food Science and Technology, Bells University of Technology, Ota, Ogun State, Nigeria.
*Corresponding Author
CAdelekan Aminat. O
Department of Food Science and Technology,
Bells University of Technology,
Ota, Ogun State, Nigeria.
Tel: +2348059506082
E-mail: bis_adek@yahoo.com
Received: Spetember 28, 2013; Accepted: October 15, 2013; Published: October 30, 2013
Citation: Adelekan Aminat. O, et al.(2013), The Effect of Some Fruits
Addition on the Nutritional, Microbiological and Sensory Qualities of
Sorghum (Sorghum Bicolour) Based Pito. Int J Food Sci Nutr Diet. 2(7),61-69. doi: dx.doi.org/10.19070/2326-3350-1300012
Copyright: Adelekan Aminat. O© 2013. This is an open-access article distributed under the terms of the Creative Commons Attribution License, which permits unrestricted use, distribution and reproduction in any medium, provided the original author and source are credited.
Abstract
The effect of enrichment with fruits (Orange, Banana and Pineapple) on the nutritional, microbiological and sensory properties of sorghum based Pito was studied. Proximate, physico chemical, microbiological, vitamin and mineral content of the fruity Pito were analysed using the standard procedures. Results showed a significant increase in protein, fat and carbohydrate content of Pito as the fruits were added. Enrichment with fruit also caused an increase in physico chemical, mineral and vitamin contents of Pito. The viscosity of Pito increased upon the addition of fruits with Banana Pito having the highest viscosity.(3.9 x 10⁻³ Pa.s), the Orange Pito had the highest vitamin C content (3.56mg/100g). The microbial load of Pito was affected by fruit addition, fungal and bacteria load increased significantly with the addition of fruits. As storage days increased, the control (Commercially purchased Pito) had the highest microbial load (9.80x10⁻⁶ cfu/ml). There were significance difference in the taste, aroma, appearance, colour, flavor, mouth feel and overall acceptability of all the Pito samples (p<0.05), but the pineapple Pito had the highest overall acceptability.
2.Introduction
3.Materials and Methods
3.1.Procedure for making Pito
3.2.Procedure for the modified method
3.3.Procedure for the conventional method (commercial Pito)
3.4.Procedure for making the fruit mash
3.5.Mixing of the Pito with fruit
4.Proximate Analyses
4.1.Dry matter content
5.Ash determination
6.Protein content determination
7.Fat content determination
8.Total acidity
9.Fixed acidity
10.Volatile acidity
11.pH determination
12.Specific gravity
13.pH determination
14.Ethanol content
15.Determination of Nutritional Composition
15.1.Mineral Content determination
15.2.Vitamin A
15.3.Vitamin C
16.Microbial Analysis
16.1.Bacterial load
16.2.Fungi load count
16.3.Sensory evaluation
17.Results and Discussion
17.1.Effect of fruit enrichment on the nutritive value of pito
17.2.Effect of fruit enrichment on the physico chemical properties of pito
17.3.Effect of fruit enrichment on the minerals and vitamins composition of Pito
18.Effect of fruit enrichment on the microbiological status of Pito
18.1.Total viable, total fungal and total bacterial count (cfu/ml)
19.Effect of fruit enrichment on the sensory characteristics of pito
20.Conclusion and Recommendation
21.References
Keywords
Nutritional; Microbiological; Enrichment; Fruits; Pito.
Introduction
Pito is one of the indigenous alcoholic beverages. It is produced mainly from the grains of guinea corn (Sorghum vulgare and Sorghum bicolor). It can also be produced from maize or the mixture of both sorghum and maize. Sorghum is one of the cereals cultivated in the tropical regions of Africa and is about the largest cultivated crop in the Northern Guinea Savanna areas of Nigeria (Asiedu, 1987). Sorghum is a large variable genus with many Cultivars (Ellasoe, 1972). It constitutes a major source of energy and protein for people in Asia and Africa and it serves as a staple food of many of the world’s poorest and least privileged people (Hulse et al., 1980).
Pito is consumed in various parts of Nigeria. It is prepared from sorghum or maize of combination of both. The mixture is soaked for two days and malted by leaving for five days in baskets lined with moistened banana leaves. The malted grains are milled, mixed with water and boiled. The mash is allowed to cool and is filtered using muslin cloth. The filtrate is left overnight until is tastes slightly sour. It is then boiled to concentrate it. A starter culture which is a portion of the previous brew is added to the cooled concentrate and left to ferment overnight. The taste of the resulting product varies from sweet to bitter. It contains lactic acid, sugars, amino acids and has an alcohol content of 3% (Ekundayo, 1969). Organisms responsible for souring include Geotrichum candidum and Lactobacillus sp. while Candida sp. is responsible for the alcoholic fermentation.
Pito is cheaper and more nutritious than the carbonated beverages. This contributes not only to thirst quenching but also to daily nutrient intake of the individuals. Enrichment provides the safest way through which the desired nutrient is delivered to the individual using familiar fruits as delivery vehicles. Staple fruits such as orange, pineapple, banana, are good means for enrichment. It is therefore worthwhile to ensure safety of this beverage and its contribution to daily nutrient intake of the individual.
Materials and Methods
Sorghum was purchased from Sango market; the fruits such as banana, orange, pineapple were purchased from Lusada market in Ota.
Two different methods were used to prepare the Pito namely-:
• The modified method
• The conventional method
The sorghum was weighed, sorted, graded and cleaned, and then steeped in water for 48 hours, the steeping water was drained and the sorghum was malted for 3 days by transferring it into a basket already lined with banana leaves, the malted grains were oven dried at 60°C for 12 hours to remove the rootlets produced as a result of germination, the dried germinated grains were pounded slightly with the use of mortar and pestle, pounded grains were then roasted in a dry pot to a brownish black colour, the roasted grains were cooked for 3 hours, after which caramelized sugar was added to sweeten the mixture, the boiled mixture was then filtered through a mesh and left overnight, after which it was filtered again with a muslin cloth.
The sorghum was weighed, sorted, graded and cleaned, and then steeped in water for 48 hours, the steeping water was drained and the sorghum was malted for 3 days by transferring it into a basket already lined with banana leaves, the malted grains were oven dried at 60°C for 12 hours to remove the rootlets produced as a result of germination, the dried germinated grains were pounded slightly with the use of mortar and pestle, pounded grains were then roasted in a dry pot to a brownish black colour, the roasted grains were cooked for 3 hours, after which caramelized sugar was added to sweeten the mixture, the boiled mixture was then filtered through a mesh and left overnight, after which it was filtered again with a muslin cloth.
The fruits (orange, pineapple and banana) were cleaned peeled and diced; the diced fruits were then blended individually using the blender.
The blended fruit (40%) was added to 1 liter of Pito, that is, 400g of fruit to 1 liter of Pito. Each mixture was homogenized with a 4 blade blender; the mixture was then filtering using a muslin cloth.
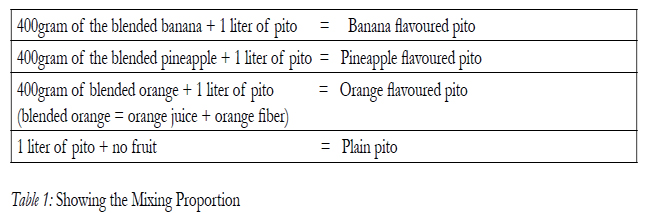

Table 1: Showing the Mixing Proportion
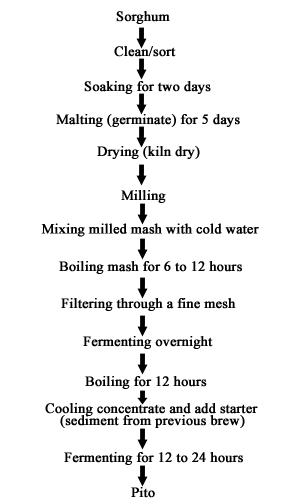
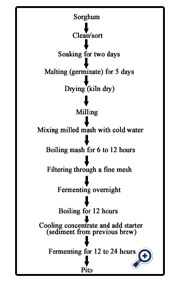
Figure 1: Flow diagram for making pito using the modified method
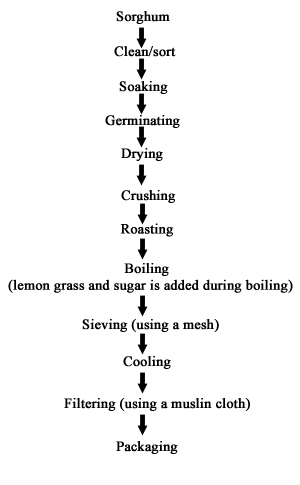
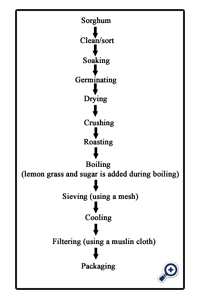
Figure 2: Flow diagram for making Pito using the conventional method
Proximate Analyses
Five grams of each of the samples was weighed into a pre weighed Petri dish. It was dried in an oven at 100°C for 24 h. The dried sample was weighed after cooling in a desiccator (AOAC, 1990).
[(Wet weight) – (Dry weight) / (dry weight of sample)] x 100%
Ash determination
This was done by using the muffle furnace. 2 ml of sample was be weighed into a weighed crucible and placed in the muffle furnace (600°C) for 2 hours. The crucibles was then cooled in the desiccators and reweighed. The loss in weight was then be calculated as percentage as or mineral content of the sample (AOAC, 1990).
The percentage (%) total ash was calculated as follows:
% Ash = (Weight of ash in grams / Weight of Sample in grams) x 100%
Protein content determination
The samples was digested with concentrated H2SO4, concentrated NaOH (40%), K2SO4 and CuSO4. 5 ml of the digest was placed into a micro-kjeldahl distillation apparatus and excess concentrated NaOH was added to make the solution strongly alkaline. Ammonia was distilled into 5 ml of boric acid indicator in a titrating flask. Above 45 ml of the distillate was collected. Titration was done with 0.01 M HCL. The end point of titration was light green (AOAC, 1990).
Fat content determination
This was done using the Soxhlet extraction unit. The Soxhlet extraction system was plug to power socket and switch on, the water tap was switch on for recycling. The equipment was Pre-heated. The extraction thimbles were attached to the adapters. 5g of the sample was weighed into each extraction thimble (W1), the weight of the extraction cup (W2). The extraction thimble was attached with adapters into the extraction unit, 50ml of solvent was weighed into the extraction cupboard put in the cup holders and they were lowered to rinsing position. The cups with solvent in the cup holder was clamped into the condensers and cork tightly using the lever to engage safety hook, the knobs was moved to boiling position and ensure the condenser valves are open then the extraction started.
Calculation: fat % = (W3-W2)/W1 × 100
W1 = sample weight (g)
W2 = extraction cup weight (g)
W3 = extraction cup + residue weight (g).
Total acidity
To 200mls of boiling distilled water in a 500ml Erlenmeyer flask was added 1ml of a 1% phenolphthalein indicator. The solution was titrated with 0.1M sodium hydroxide solution to a faint but definite pink colour; 5mls of the sample was titrated to a pink colour with the 0.1M NaOH, using 3 drops of 1% phenolphthalein as indicator.
T.A (g/100ml) = (0.075× M1× W2)/V1ml
Where,
M1 = Molarity of NaoH
V2 = Titre volume
V1 = Volume of sample (5ml)
0.075 = Equivalent weight for Tartaric acid
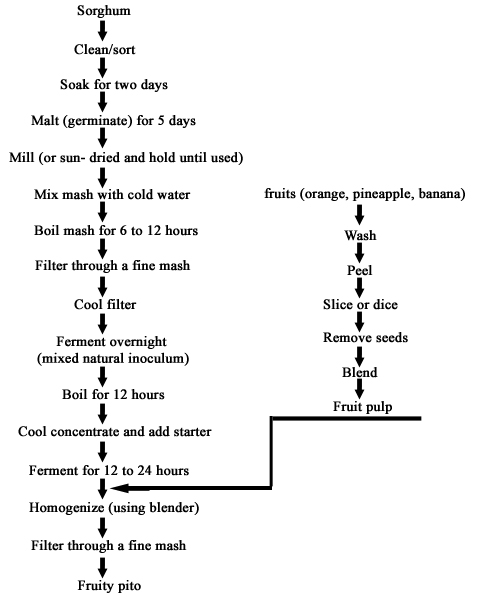
Figure 3: Flow diagram for making the fruity pito.
Fixed acidity
25mls of the samples were placed in boiling tubes and evaporated carefully on the hot plate until the volume reduced to 5mls. Then, 25mls of hot distilled water was added and the solution again evaporated to a final volume of 5ml. this process was repeated once more. The residue was allowed to cool, and then diluted to 50ml with distilled water. 3 drops of 1% phenolphthalein was added and finally, the samples were titrated with a standardized concentrated 0.1M NaOH until a colour change was observed.
(F.A. g/100mlV1 × M1 × 0.075 × 100)/V2
Where,
V1 = Volume of NaoH used
V2 = Volume of Sample (25ml)
M1 = Molarity of NaoH
0.075 = Equivalent weight for Tartaric acid
Volatile acidity
The volatile acidity was calculated by subtracting the fixed acidity from the total acidity expressed on the same scale
i.e. = TA − FA = VA (g/100ml)
Where,
TA = Total acidity
FA = Fixed acidity
VA = Volatile acidity
pH determination
The pH was carried out by dipping the electrode of the ph meter into the sample. The readings were obtained from the photo-detector on the pH meter.
Specific gravity
This was determined using a density bottle. The samples were poured into a 50ml density bottle and weighed. This is known as the mass. The mass was divided by the volume of the density bottle, to get the density.
Ethanol content
The refractometer method was used in determining the alcohol content.
A clean dry applicator was used to place 2 drops of the sample (brew i.e., before fermentation) on the prism of the refractometer and the value (Original gravity) of the refractive index taken. Also, after fermentation, 2 drops of the sample was applied on the prism of the refractometer and the value (Total gravity) was taken. Then the total gravity was subtracted from the original gravity to get ethanol content.
Determination of Nutritional Composition
The dry ashing procedure was used for mineral content determination was. Five (5) grams of each of the samples were accurately weighed into porcelain crucibles and pre-ashed until the sample was completely charred on a hot plate. The pre-ashed samples were thereafter ashed in the muffle furnace at 500 degrees Celsius till the ash was white for about 2 hours.
After ashing, the crucibles were transferred into the desiccator to cool and the reweighed. Each sample was quantitatively transferred into volumetric flasks by carefully washing the crucibles with 1ml nitric acid, then with portions of dilute nitric acid.
All washings were transferred to individual volumetric flasks, repeating the washing procedure twice. The solutions were diluted to volume with deionised water and were used for individual mineral determination using the appropriate standards and blank. The content of the minerals; Calcium, Magnesium, Potassium, Iron, Copper and Zinc were determined with the Atomic Absorption Spectrophotometer (Buck Scientific, Model 210).
The percentage (%) mineral content was calculated as follows:
% Mineral Element concentration = Ppm / 1000
Where,
Parts per million (Ppm) of any element = Meter reading x Slope x Dilution factor
Each sample was weighed (2g) into a flat bottom reflux flask and 10ml of distilled water was added followed by careful shaking to form a paste. This was followed by the addition of 25mls of alcoholic Potassium Hydroxide solution and the attachment of a reflux condenser. The mixture was then heated in boiling water bath for 1 hour with frequent shaking and rapidly cooled with 30mls of distilled water added. The hydrolysate obtained was transferred into a separating funnel and the solution was extracted three times with 250ml quantities of chloroform. 2g of anhydrous Sodium tetraoxo sulphate (Na2SO4) was thereafter added to the extract to remove any traces of water. The mixture was then filtered into a 100ml volumetric flask and made up to mark with chloroform. Standard solutions (within the range of 0 to 50 micron gram/ml) prepared were determined with reference to their absorbance from which average gradients were taken to calculate Vitamin A (Beta- Carotene in micron gram/100 gram).
Absorbance of each sample and standards was read on the Spectrophotometer (Spectronic 21D, Milton Roy Model) at a wavelength of 328nm.
The vitamin A concentration (in micron gram/ 100g) was calculated with the formula:
Vitamin A (micron gram / 100g) = [(Absorbance x Dilution Factor) / (Weight of sample)] x100/1
Equal weights of each of the samples and 3% metaphosphoric acid were individually mechanically blended and each portion mixed to obtain homogenous slurry. Five (5) grams of individual slurry was transferred using a pipette into a 100ml volumetric flask and made up to mark with 3% metaphosphoric acid. Each mixture was filtered, discarding the first portion of the filtrate and 10ml of the aliquot was pipetted into a 50ml volumetric flask and titrated immediately with the standard dye solution of 2, 6 – dichlorophenolindophenol to a faint pink colour which persisted for 15 seconds.
The concentration of ascorbic acid was calculated using the formula:
Mg Vitamin C per 100g = [(W1 + W2) / (W1 x W3)] x [V1/V2] x[100 (V x F)]
Where:
W1 = Weight of sample (grams)
W2 = Weight of extracting acid (grams)
W3 = Weight of slurry removed for analysis
V1 = Volume to which slurry sample in diluted (ml)
V2 = Volume of filtrate taken for titration (ml)
V = Volume of dye solution used for titration.
F = Ascorbic acid Equivalent of dye in milligrams/milliliters.
Microbial Analysis
Spread plate technique as described by Pelczar and Chan, (1997) was used .1ml of each sample was aseptically transferred to 9 ml of sterile water in a separate tube and mixed vigorously. 1ml of the resulting mixture was transferred to 9ml of sterile water in a separate tube. The process was continued until the 6th diluents (10-6). Nutrient Agar (NA) was inoculated with a 0.1ml of appropriately diluted pito (10-6) by spread-plating technique and incubated at 37oC for 24 hours. Colonies were counted and multiplied by the dilution factor.
Bacterial load (cfu / g) = (N x 1 x D)/V
Where,
N = Numbers of colonies counted.
V = Volume of inoculums
D = Dilution factors
The fungal load was determined in a similar way as the bacterial load. However, Potato Dextrose Agar was used using spread plate technique. 0.1ml of the 4th diluents was used and incubated 370C.
Fungi load (cfu / g) = (N x 1 x D)/V
Where:
N = Numbers of colonies counted
V = Volume of inoculums
D = Dilution factors
Evaluation was done by 20 judges selected randomly from Bells University of Technology Ota,Ogun .The nine (9) point hedonic scale was used ( score “9” having excellent attribute and Score “1” indicating extremely dislike) Samples were coded with three digit random numbers and presented in random order. The characteristics evaluated, were appearance, taste, colour, mouth feel and overall acceptability (Larmond, 1977).The responses were statistically analyzed via analysis of variance (ANOVA).
Results and Discussion
The proximate analysis of the control (commercially purchased pito) and the fruity pito samples are presented in table 2. This result shows that the nutrient content of the fruity pito compared to the control increased significantly (p < 0.05). However, there were also significant differences between the different types of the fruity pito (p < 0.05), especially with the addition of orange which has the highest increase in the protein content this is because it has the highest amount of protein compared with banana and pineapple, while the addition of banana had the highest increase in carbohydrate and fat contents. There was decrease in moisture content as the fruit were added, the fruity pito containing banana had the lowest moisture content. The values of nutrient in the modified method are higher than that of the conventional method.
Table 3 shows the effect of fruit enrichment on the physico chemical properties of Pito. There was a slight difference between the plain pito and the fruity pito (p ≤ 0.05), but the fruity pito is significantly different from the commercially purchased pito (p < 0.05). The fruity pito containing pineapple had the highest pH (5.88), and the one containing orange had the lowest (3.80), this also explains why the highest total and fixed acidity were found in the fruity pito containing orange and the lowest in the one containing pineapple because the lower the pH of a substance the higher the acidity, but it is also possible to find high acid in high pH beverages (Bellman and Gallander, 1979). There was also significant difference in the brix content of fruity pito, with pineapple pito having the highest brix level (19.41º) and the modified plain pito had the lowest (6.70º), the higher the brix level of a substance the higher the degree sugar/sweetness of that substance (Hough and Briggs, 1971) and in some cases the Brix content also determines the specific gravity of some substances (Boulton et al, 1996) and in this case as the specific gravity increases, the brix degree increases. The sample containing the highest brix content which is the pineapple pito had the highest alcoholic content, this is because the yeast present in the glucose is converted by the yeast to ethanol, therefore, the higher the sugar level the higher the tendency of it having a higher alcoholic content (Philip, 1985), the alcoholic content and the viscosity of the sample are significantly different (p < 0.05). The pito containing banana had the highest resistance to flow (3.9 x 10⁻³) this is because of its higher dry matter content, and the lowest was pineapple (3.2 x 10⁻³), due to its reduced dry matter contents.
The mineral and vitamin content of the fruity pito is shown on table 4. The iron content of the fruity Pito increased significantly from each other, the pito containing pineapple had the highest amount of iron while the pito containing orange had the highest amount of magnesium, though the magnesium content are significantly different from one another (p < 0.05). Vitamin A and vitamin C content are also significantly different with the pineapple pito having the highest amount of vitamin A (0.61 IU) and the orange pito having the highest amount of vitamin C (3.56mg), the commercially purchased pito had the lowest value both in vitamins A and C. Compared to the pito fortified with soybean (Adeniji and Keshiro, 2009) and the pito mixed with adoyo (another fermented beverage) and burukutu (Kolawole et al, 1996), the fruity has a higher amount of minerals and vitamins. The orange pito had the highest amount of vitamin C because oranges have high citrus acid compared to pineapple and banana and citric acid helps to balance the pH level (Dawson et al, 1959), this can as well explain the reason why the orange pito had the lowest pH value compared with the other fruity pito.
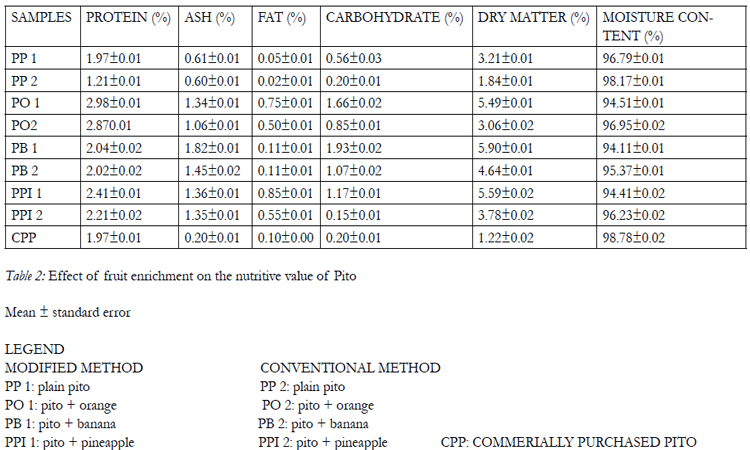
Table 2: Effect of fruit enrichment on the nutritive value of Pito
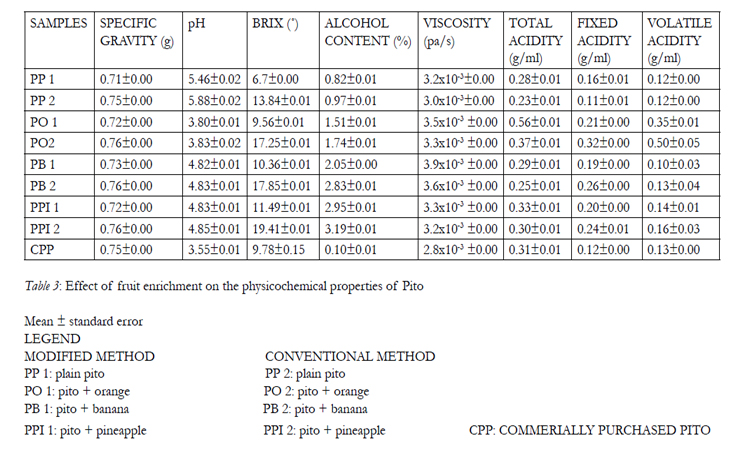
Table 3: Effect of fruit enrichment on the physicochemical properties of Pito
Effect of fruit enrichment on the microbiological status of Pito
Effect of enrichment of pito on the microbiological status was shown on tables 5-7. It was discovered that in day 0 there was no microbial growth in the plain and fruity pito that were produced using the modified and conventional method but the commercially purchased pito had microbial growth, in day 2, there were growth in the plain and fruity pito, which increased as storage days increases. The microbial growth of each pito samples from day 0 to day 6 were significantly different (p < 0.05) with the highest total viable count found in the commercially purchased pito (9.80 cfu/ml).
The same trend of increment was found in the total fungal and total bacterial count, the only difference being that there were growth in day 0, but the growth were found in small amount compare to the commercially purchased pito which had higher count, and the amount of total bacteria found was higher than the total fungi, this is because the microorganisms responsible during fermentation are mostly bacteria, which results in the souring of the pito such microorganisms are, Geotrichum candida and the Lactobacillus species, souring is a special type of fermentation by Lactobacillus species, that is, the Lactobacillus convert pyruvate from glucose as a result of glycolysis to lactic acid which gives fermented beverages their sour taste (Lerio, 1993).
Fungi is only needed in small quality, the fungi present in fermented beverages is usually yeast, which react with the glucose present in the beverage to produce alcohol and carbon dioxide (George, 2003).
Therefore the higher the sugar content level of a beverage the more the fungi and bacteria growth (Okafor, 1987), this explains why the pineapple pito had the highest bacteria and fungi count at day 6, because it had the highest brix (sugar) level.
Effect of fruit enrichment on the sensory characteristics of pito
Twelve judges were used for the sensory evaluation and the statistical analysis of their response is shown on table 8 below, and it showed that there were no significant difference in the appearance, flavour, aroma, colour, taste mouth feel and overall acceptability of the pito samples (p < 0.05). However, for the conventional method, the pineapple pito had the highest overall acceptability score of 9.75, follow by the orange pito,then the banana and plain pito, the commercially purchased pito had the least overall acceptability score of 4.67. The same trend occurred in the modified pito, but the overall acceptability of the pineapple pito was 6.50.
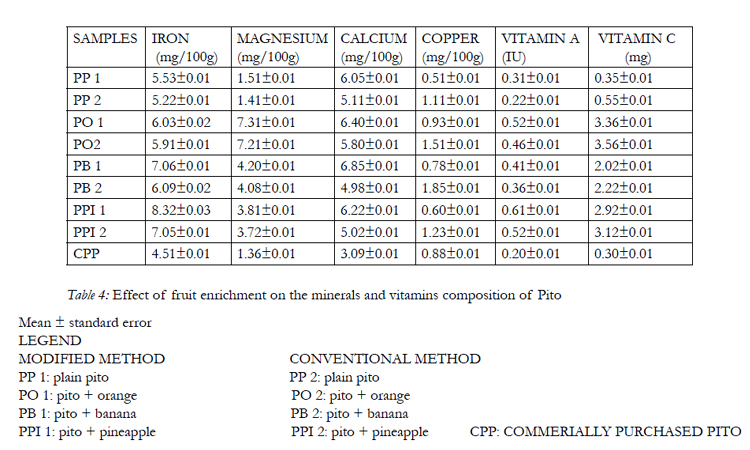
Table 4: Effect of fruit enrichment on the minerals and vitamins composition of Pito
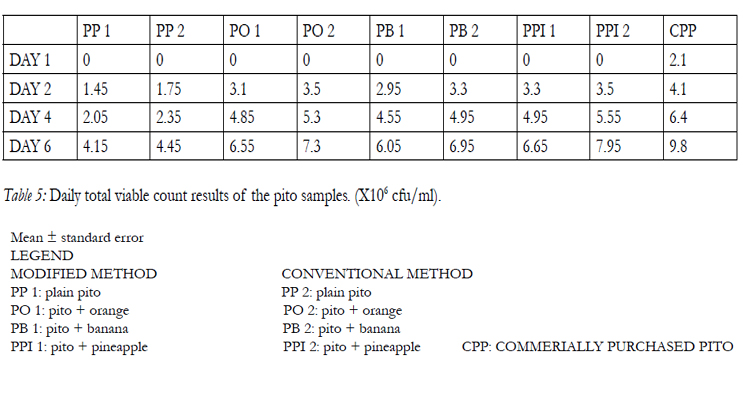
Table 5: Daily total viable count results of the pito samples. (X106 cfu/ml).
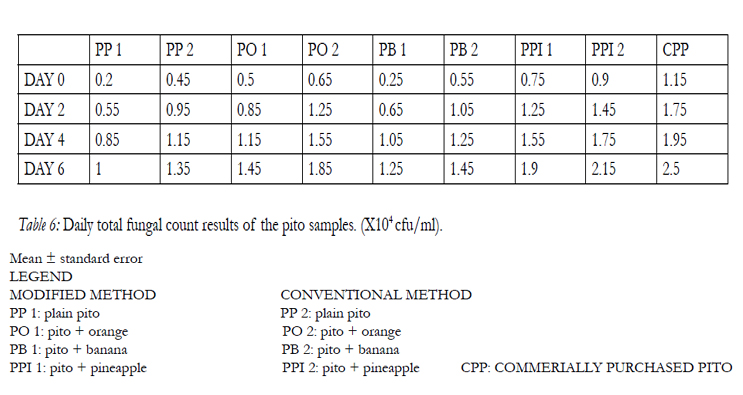
Table 6: Daily total fungal count results of the pito samples. (X104 cfu/ml).
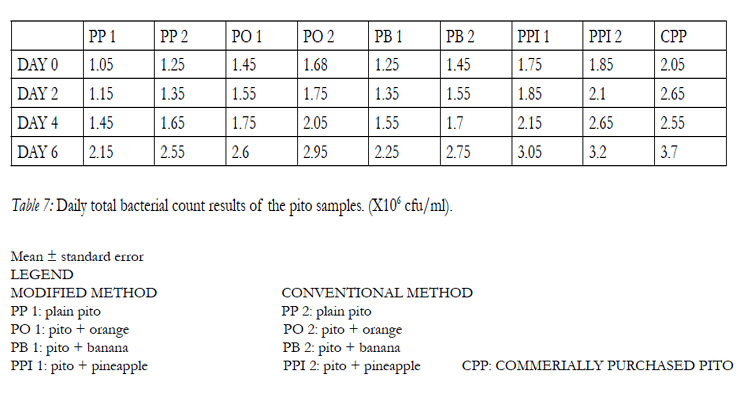
Table 7: Daily total bacterial count results of the pito samples. (X106 cfu/ml).
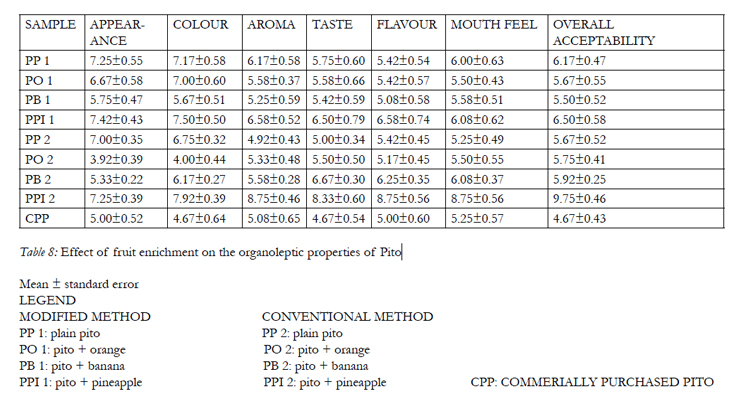
Table 8: Effect of fruit enrichment on the organoleptic properties of Pito
Conclusion and Recommendation
The use of fruits in the enrichment of pito using the modified and conventional methods had effect on the nutritional status of the pito with the protein, fat and carbohydrate content of pito increasing significantly (P < 0.05) with the addition of each fruits. Also, the physicochemical status of the pito also increased with addition of the each fruits. The minerals and vitamins content of the pito also increased significantly with the addition of each fruits.
Some parameters of the sensory characteristics of the pito samples such as colour, appearance, aroma, taste and overall acceptability increased significantly (P < 0.05), while the mouth feel and aroma were not significantly different (P > 0.05). However, the pineapple pito had the highest overall acceptability for the modified and conventional method.
The level of bacterial and fungal growth increases significantly from day 0 to day 6 (P < 0.05) as each fruits were added, therefore, pito should be consumed immediately or it can be preserved in the refrigerator before and after adding the fruits.
The two methods used in preparing the pito both follow the same trend of increasing the nutritive content with the addition of fruit, the value of each nutrient for the modified method are higher than that of the conventional method.
It can be concluded that enriched pito is safe for consumption, and could serve as a source of increased nutrient intake for individual that like to consume Pito.
I recommend a modified packaging material that would help to reduce the growth of the micro organisms in other to extend the shelf life of the fruity pito. Further work can also be done on the fruity pito by incorporating carbon dioxide into it; in order for it to be easily compared with the other carbonated drinks and even in the international market and the carbonation will also serve as preservative to the fruity pito.
References
- Adeniji AO and Keshiro A (2009). Nutritional, microbiological and sensory assessment of Pito, a home- prepared traditional Nigerian beverage. Journal of Nutritional Sciences.Vol. 30: Pp 30-35.
- AOAC (1990). Official Methods of Analysis, 15th edition, Association of Official Association of Official
- Analytical Chemist, Washington DC.
- Asiedu JJ (1987). Processing Tropical crops. A Technological approach. Macmillian Education. Pp.563-569.
- Barnett HL and Hunter BB (1972). Illustrated Genera of Imperfect Fungi. 3rd edition, Burgess Publishing Co., Minneapolis.Pp. 241.
- Bellman RB and Gallander JF (1979). “Deacidification in Wine”. Third edition, Oxford University Press. Pp. 681
- Boulton CA, Briggs DE, Brookes PA and Stevens R (2004). Brewing Science and Technology. Woodhead publishing Limited, Cambridge. Pp. 230-248
- Dawson RMC (1959). Data for Biochemical Research. Oxford, Clarendon Press. Pp: 78-85
- Ekundayo J (1969). Production of Burukutu a Nigerian Fermented Beverage. Ife: University of Ife Press.
- Ellasoe C (1972). Sorghum and Pearl millet: In Food crops of lowland tropics, Oxford University Press, Great Britain. Pp. 191-192
- George W (2003). Yeast and fermentation, Alcoholic beverages: Beer, wine and liquor. Pp. 67-68
- Gutcho M (1976). Alcoholic Beverages Processes. London: Noyes Press Ltd.
- Hulse JH, Laing EM and Pearson OE (1980). Sorghum and Millet, their composition and nutritive. Pp. 57-76
- Kolawole A, Adewumi JK and Odo PE (1996). Firki-masakwa cultivation in Borno, northeast Nigeria. In: Sustaining the Soil: Indigenous Soil and Water Conservation in Africa. Reij,C. Scoones, I. and Toulmin, C. (Eds.), pp. 90-96. Earthscan,London.
- Larmond E (1977). Laboratory methods for sensory evaluation of food. Publication 1284, Canadian Department of Agriculture, 0ttawa, Canada.
- Leroi F and Pidoux M (1993). Characterization of interactions between Lactobacillus hilgardii and Saccharomyces florentinus isolated from sugary kefir grains. Journal of Applied Microbiology Vol. 74,(1). Pp 54–60.
- Nout MJR (1993). Processed Weaning Foods for Tropical Climates. Int. J. Food Sci. Nutr., 43. Pp 213-221.
- Okafor N (1987). Industrial Microbiology, 1st Edn., University of Ife Press Ltd. Ile-Ife, Nigeria.
- Okafor N (2007). Modern Industrial Microbiology and Biotechnology (1st Edn). Science Publishers, Enfield, New Hampshire. p. 530.
- Pelczar MJ jr., Chan ECS and Krieg NR (1998). Microbiology 5th edition. Tata McGraw-Hill, India.Pp. 1-9
- Philip J (1985). The modern wine making. Pp 565-598
- Protz R (2004). The complete guide to World beer. Carlton Books, London, UK.
- Sade FO (2009). Proximate, antinutritional factors and functional properties of processed pearl millet (Pennisetum glaucum). J. Food Technology, 7: 92-97


