Assessment And Comparison of Diet Quality And Physical Activity of African-Caribbean, South Asian and Caucasian Groups in The UK
Sara Diana Garduño-Diaz1*, Santosh Khokhar2
1* American University of the Middle East, Dasman, Kuwait
2 School of Food Science and Nutrition, University of Leeds, Leeds, UK
*Corresponding Author
Sara Diana Garduno-Diaz
American University of the Middle East,
Dasman, Kuwait.
Tel: +965 222 51 400 (1228),
E-mail: sara.gardunodiaz@aum.edu.kw
Received: June 05, 2013; Accepted: June 21, 2013; Published: June 25, 2013
Citation: Sara Diana Garduño-Diaz , Santosh Khokhar.(2013), Assessment
And Comparison of Diet Quality And Physical Activity of African-
Caribbean, South Asian And Caucasian Groups in The UK.. Int J Food Sci Nutr Diet. 2(5), 45-50. doi: dx.doi.org/10.19070/2326-3350-130009
Copyright: Sara Diana Garduño-Diaz© 2013. This is an open-access article distributed under the terms of the Creative Commons Attribution License, which permits unrestricted use, distribution and reproduction in any medium, provided the original author and source are credited.
Abstract
Background: Nutritional advice from public health campaigns in most Western countries does not include specific recommendations for minority groups. In this study we aimed to evaluate and compare diet quality and physical activity between the major ethnic groups residing in the UK.
Methods: Adherence to recommendation, measured using a Diet Quality and Physical Activity Index (DPI) derived from national recommendations,
was measure among participants (n=210) of African-Caribbean-, South Asian- and Caucasian ethnicity currently residing in the UK.
Results: Significant difference in total DPI score between ethnic groups was not found. Components of the obtained score varied with a higher
consumption of dairy products among African-Caribbeans and Asians, oil for cooking was preferred more frequently by Caucasians as was
breakfast consumption and frequency and duration of physical activity. African-Caribbeans scored highest in fish, fruit/vegetables and liquid
consumption.
Conclusion: While the overall diet quality of ethnic minority groups may not be significantly different from the mainstream population, differences
in individual diet components should be considered as part of the national nutritional advice of countries with heterogeneous populations.
2.Introduction
3.Methods
4.Results
5.Discussion
6.Conclusions
7.Competing Interests
8.Author’s Contributions
9.Aknowledgments
10.References
Keywords
Diet Quality; Diet Score; Ethnic; Dietary Recommendations; South Asian; African-Caribbean.
Introduction
The Food Standard Agency (FSA), in partnership with the Department of Health, is the official authority in food and nutrition in the United Kingdom (UK). As an initiative to improve the health of the national population the Eat Well Be Well campaign promotes a set of essential points to encourage healthier choices, including recommendations regarding diet and physical activity. These recommendations seek to promote sufficient consumption of starchy foods, preferably wholegrain products; to consume at least 5 portions of fruits and vegetables per day; to eat at least two portions of fish per week, one of which should be oily; to cut back on saturated fat, one of the ways being the use of oil for cooking instead of other fats; to consume breakfast regularly and to remain hydrated and active [1].
Although the advice given by the FSA is suitable for most people, the Eat Well Be Well campaign does not provide specific recommendations for non-Caucasian ethnic minority groups who represent approximately 8% of the total UK population; the ethnic minority groups most widely represented in the UK are Asians and African-Caribbeans, representing 4 and 2%, respectively [2]. While ethnic minority group populations experience dietary acculturation as part of the process of integration into the host country, some eating habits typical of the country of origin are retained [3] and may affect the health status of at risk populations, such as Asians and Africans.
Research on the assessment of dietary quality has been carried out using single indicators including healthy eating indexes, food variety scores and diet diversity scores [4].These tools have been developed to provide an overall picture of the diet, to measure adherence to interventions or specific diets and to calculate the adherence with guidelines and recommendations. In this study we aimed to evaluate and compare diet quality and physical activity between the major ethnic groups residing in the UK using a newly developed Diet Quality and Physical Activity Index (DPI), based on the recommendations given by the FSA, while focusing on differences associated to ethnicity and socio-economical indicators. To our knowledge this is the first time that FSA recommendations from the Eat Well Be Well campaign have been used to assess ethnic minority groups in the UK.
Methods
A newly developed 15-item questionnaire measured the diet quality as well as the physical activity level in a sample of the UK’s multiethnic population (South Asian, African-Caribbean and Caucasian) based on the recommendations set out in the FSA’s Eat Well Be Well campaign. The proposed DPI evaluates nine recommendations for food intake and selection, eating habits and frequency/duration of physical activity. The questionnaire was posted to three different area codes in the city of Leeds to obtain a random sample of responses and to cover people of different ethnic origins. Ethnicity was self-reported. In total, 5400 questionnaires were sent out over a period of two months with a pre-stamped return envelope. Responses were then coded and scored. All procedures were approved by the University of Leeds Research Ethics Committee.
The DPI was calculated for each respondent based on a maximum score of 13 points, covering nine main dietary components plus physical activity. The dietary components were chosen to reflect recommendations from the FSA as well as from being part of a prudent diet [5]. Table 1 indicates how recommendations were measured and scored. Consumption was assessed by daily intake for liquids, fruits, vegetables, starchy and dairy products; and by weekly intake for fish and protein rich foods. Respondents were provided with written examples of what constitutes a portion of the main foods in each food group; these examples included both mainstream and ethnic foods (i.e. the starchy foods listed included sliced bread, chapattis and cassava).
The first four components evaluated both the amount and quality of foods. For starchy foods, this meant a preference of whole grain over refined products; for dairy products, choosing low fat over full fat products; for fish, twice-weekly consumption with at least one portion of oily fish; and for protein, choosing lean meat and removing visceral fat. Each component was awarded two points. For fruit/ vegetables and liquids, evaluation was based on sufficient daily intake (5-aday); one point was awarded for each component. Finally the last three components evaluated healthy lifestyle habits including: type of fat used for cooking (oil over other fats), daily breakfast consumption and engagement in physical activity at least three times per week for at least 30 minutes per session; each of these components was awarded one point. Closed questions were used in the design of the questionnaire in order to obtain the information sought; such was the case for the type of fat most frequently used for cooking, where the options offered were oil, butter/margarine and other types of fat. By limiting the responses it was possible to focus on the specific recommendation being measured.
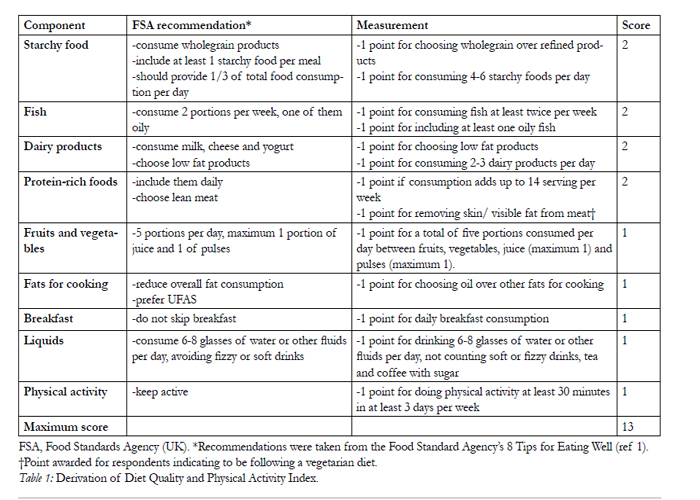

Table 1: Derivation of Diet Quality and Physical Activity Index.
Responses were grouped according to the number of years lived in the UK, thus recent immigrants (living in the UK <5yrs), mid-term immigrants (5-15yrs) or long-term immigrants (>15yrs); and by educational level (from primary school to postgraduate studies) and household annual income level (from less than £10,000 to more than £40,000 annually).
Descriptive statistics were used to define the demographic characteristics of the respondents and Kolmogorov-Smirnov statistics and histograms were used to test for variable normality. One-way analysis of variance (ANOVA) was used to test for differences between ethnic groups for DPI and each individual component of the total score. Chi-square test for independence was calculated between DPI score and ethnicity, educational level, income, immigration status and body-mass index (BMI). Analyses were carried out using SPSS Statistics version 17.0 (SPSS Inc., Chicago, IL, USA) software.
Results
A total of 220 questionnaires were returned. From these, ten were eliminated due to age (less than 20 years old) or insufficient data to calculate DPI. The remaining 210 were grouped by self-reported ethnicity; these demographic characteristics are presented in Table 2. Average age ranged from 30 years (South Asian men) to 45.6 years (Caucasian women). Africans were the most recent migrants having spent the least number of years in the UK (mean 23 years). Higher levels of education were observed amongst the Caucasian group, for both men and women, and higher income levels were also reported in this group. Higher prevalence rates of obesity were found among Africans when calculated by BMI, followed by Caucasians. South Asians were found to have the lowest BMI levels; this was expected as body composition studies for this ethnic group tend to report similar findings [6].
The Kolmogorov-Smirnov test showed significant results (p < .05) for all variables, with the exception of African total score (data not shown). For ANOVA, statistically-significant (p< .05) differences were found for points obtained from dairy consumption, type of fat for cooking, breakfast consumption and physical activity, as shown in Table 3.
Highest compliance with recommendations was reached for protein-rich foods and fruit/vegetables,whilst the lowest compliance with recommendations,among all minority ethnic groups, was for liquid consumption.
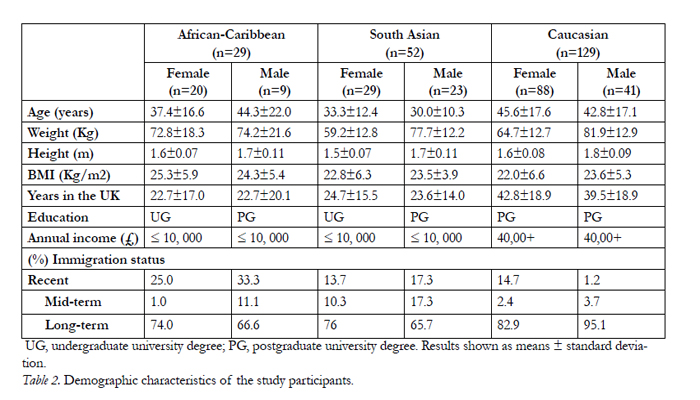
Table 2. Demographic characteristics of the study participants.
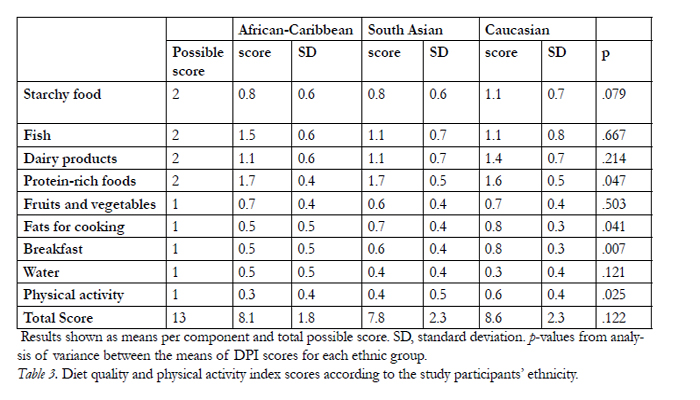
Table 3. Diet quality and physical activity index scores according to the study participants’ ethnicity.
Engagement in physical activity was reported by 94% of Caucasians, 75% of South Asians and 72% of African-Caribbeans. On average, physical activity was carried out four days per week with duration of 30 minutes per session. The most frequently mentioned activities included walking (for all groups), followed by cycling (for Caucasians) and yoga (South Asians).
Comparison was also made between minority ethnic groups according to their education level, annual income, immigration status and BMI as shown in Figure 1. Higher scores were achieved among those respondents completing higher levels of education. For Caucasians and Africans, income was observed to be directly related to DPI score; however, this was not the case for South Asians, where higher income was related to a lower DPI. Pearson Chi-Square showed no significant association between education level and total DPI score, or between income, immigration status and total DPI score.
As the time spent in the UK increased so did the intake of fruits/vegetables (from 2.7 to 3 portions per day for fruits and from 1.5 to 2.2 portions per day for vegetables), dairy (from 1.5 to 2.9 portions per day), chicken (from 2.1 to 3 portions per week) and red meat (from 0.7 to 1.8 portions per week) for South Asians. No changes were found for the rest of the food groups examined including starchy foods, fish and pulses. Also, no changes were found for physical activity practices. As for changes amongst African-Caribbeans, ageneral increase was found in consumption of foods from all groups including fruit/vegetables (from 3 to 6 portions per day), dairy products (from half a portion to 1.5 portions per day) and red meat (from 0.8 to 1.4 portions per week).
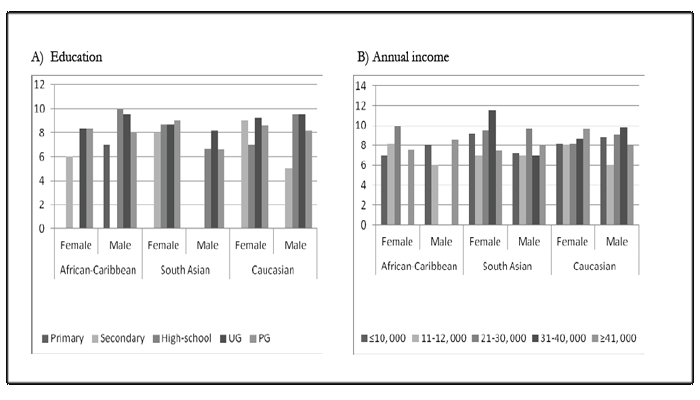
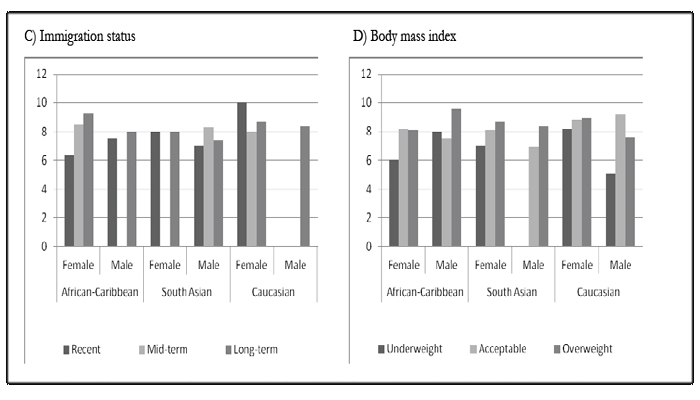
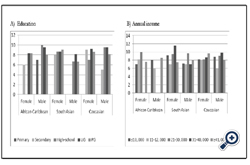
Figure 1: Diet quality and physical activity index score level of the study participants.
UG, undergraduate; PG, postgraduate. Income shown in Great Britain Pounds. Recent, living in the UK <5years; mid-term, living in the UK 5-15years; long-term, living in the UK >15years. Body-mass index levels were considered as < 19 underweight, 19-25 acceptable and >25 as overweight for African-Caribbean. For South Asians a level >23 was considered overweight.
Significant (p = 0.03) association was found between ethnicity and total DPI score. The highest total DPI score was obtained by Caucasian men (DPI = 8.4) while the lowest was for South Asian men (DPI = 7.5). Overall, Caucasians scored higher in overall diet quality with Africans showing the lowest scores.
Total DPI score was inversely associated with BMI (p= 0.01) among Caucasians, highest DPI scores wereobtained for participants with lower BMI. For South Asians, higher DPI scores were found among respondents categorized as overweight according to BMI,showing a direct association between DPI score and BMI. African-Caribbean females with an acceptable BMI scored highest in overall diet quality while African- Caribbean men in the overweight category scored highest.
Discussion
According to total DPI score, Caucasians in the UK have an overall higher diet quality than ethnic minority groups. Between ethnic groups there were significant differences in the individual components of the DPI for dairy product and breakfast consumption, type of fat used for cooking and regular physical activity. Results from this study are comparable with those obtained by Gao et al. [7] where Caucasians scored higher on overall dietary quality than minority ethnic groups in the United Sates. However, results are contradictory to those of Nicolau et al. [8] comparing Surinamese and Dutch populations in The Netherlands, where the former scored higher on overall diet quality.
When compared with Caucasians, minority ethnic groups in the UK tended to consume more dairy products. These findings differ from other studies where milk consumption was found to be lower among African- Americans than for Caucasian-Americans [7]. Regular dairy consumption has been associated to lower risk of osteoporosis, hypertension, obesity and type 2 diabetes [9-11]. However, full fat versions of milk and dairy products contain high quantities of saturated fat; hence recommendations for their consumption should be distinguished from reduced-fat versions.
Oil was used most often for cooking among Caucasians while African-Caribbeans preferred hard fats, including butter and margarine. Fat-rich diets tend to be more flavorful; however, they are also usually higher in energy content. Although dietary recommendations for a reduced intake of total fat exist, attention must be emphasized on the type of fats that are being consumed. The difference in the choice of fat used for cooking may be a significant factor on the overall diet quality and disease prevalence between ethnic minority groups.
Regular breakfast consumption was most frequent among Caucasians and lowest for African-Caribbeans.It has been long concluded and accepted that regular breakfast consumption greatly enhances the overall diet quality [12].
The intake of fruits and vegetables, being important sources of vitamins and minerals as well as fibre and phytochemicals, is a component frequently used in various diet indices [13] as their intake is found to be inversely-correlated with risk of chronic disease[14, 15]. The results reported here show no significant difference between ethnic groups for fruit and vegetable consumption, although there was a slightly higher intake of fruits and vegetables among the African-Caribbean group; this confirms previously reported results where African-Caribbeans consumed more fruit and green vegetables than their British counterparts [16]. The lack of significant difference in fruit and vegetable intake between ethnic groups may suggest the possibility to rule out this factor as a significant contributor to the difference in prevalence of chronic diseases.
Caucasians were found to be most physically active, with Africans scoring lowest and South Asians in between. This supports the evidence found by Fisch Fischbacher et al. [17] where Asians were reported to be less physically active than their Caucasian counterparts in the UK. Social acceptance of engagement in physical activity is a significant obstacle to overcome among South Asian women, where time dedicated to physical activity is seen as time taken away from the family and gender role activities (cooking, cleaning and child care), and where sports attire and exposure to males is frequently unacceptable [18].
Total DPI score was lower among obese respondents, defined by ethnic-specific BMI levels, in accordance to the results of Gao et al. [7] where the likelihood of being obese was inversely correlated with Healthy Eating Index scores. It has been observed in the past that, when using index scores to assess diet quality, high energy diets will usually be reported as higher quality [13]. Because the DPI score is independent of total energy intake, it was not possible to obtain a high score simply by consuming a larger amount of food.
In regard to educational level and diet quality, a trend towards a direct correlation was observed among all ethnic groups. Although this finding is in agreement with the work reported by Irala-Estevez et al. [19], the effect of education on total DPI score was not found to be significant.
Income level was found to be inversely associated with DPI score among Asians and directly associated among Caucasians, while the relationship was not clearly defined for African-Caribbeans.
No significant difference was found between immigration status and total diet quality. However, as shown by the difference in composition of the DPI as number of years spent in the UK increased, it was possible to observe a certain degree of westernization of the diet, as reported in other studies [3, 8]. In a study carried out in France [20], it was found that longer periods of time spent in the host country (more than half of one’s lifetime) were associated to overweight. Hence, it is possible that significant impact on diet quality due to migration is only observed after a much longer duration of residency in the host country.
Differences between vegetarian and non-vegetarian diets are generally found for proteins, fibre and vitamin B12. However, there were no differences in the DPI score of vegetarians and non-vegetarians; similar findings have been reported by Jonnalagadda et al. [21] who concluded that a vegetarian diet is not necessarily a healthier option.
The main strength of these data are their ability to provide information on the diet of South Asians and African-Caribbeans in the UK. To our knowledge, this is the first study to employ a single index to compare the dietary quality among different ethnic groups in the UK to national dietary recommendations. Ethnicassociated differences in food selection were considered when asking about specific food groups with respondents being prompted not only with mainstream foods (i.e. sliced bread for starchy food) but also with foods previously identified as frequently consumed by both South Asians and African-Caribbeans in the UK (rice, chapattis, cassava) [22]. Vegetarian sources of protein, such as legumes and nuts, were also included for consideration in the DPI since vegetarianism is common among South Asians. Individual scores for each of the components of the DPI might help identify specific areas of concern (breakfast consumption, dairy product consumption, type of fat used for cooking and physical activity) for intervention among minority groups in a heterogeneous population. In addition, ethnic-specific threshold levels were used for comparisons according to BMI and the influence of other ethnic-associated factors, such as income level and education, were evaluated for their impact on dietary quality.
One of the main limitations of this study could be its small sample size due to a low response rate (4%). The reasons for the low response rate might include the nature of the study and the study population. While a higher response rate might be achieved by face-to-face interview-based studies, by employing self-responded instruments it is likely that any bias linked to the presence of an interviewer is reduced. The quantification of food consumption was also a challenge; however this is an ongoing problem faced by all dietary assessment methods and a degree of control and uniformity was obtained by providing respondents with indications and examples as to what constitutes a portion and by including both daily and weekly consumption questions. Finally, although physical activity might be roughly estimated by enquiring about the type, frequency and duration more detailed and accurate investigation might reflect even lower levels of physical activity.
Conclusions
Although overall diet quality did not differ greatly across ethnic groups, the differences found in the components of the score identified key aspects to address when planning public health campaigns aimed at reducing the incidence of diet-related non-communicable diseases. Special attention should focus on the consumption of dairy products and breakfast, the type of fat used for cooking and engagement in physical activity. Findings from this study indicated that ethnicity, independent of the number of years spent in the host country, is related to overall dietary. In addition, education and income tend to be directly associated to diet quality, although body composition remains a stronger indicator of overall diet quality.
Competing Interests
The author(s) declare that they have no competing in-terests.
Author’s Contributions
Both authors participated in the design of the study. SDGD collected the data, performed the statistical analysis and drafted the manuscript. Both authors read and approved the final manuscript.
Aknowledgments
SDGD thanks the National Council of Science and Technology (Mexico) for PhD sponsorship.
References
- Food Standard Agency’s 8 tips for eating well. http://www.eatwell.gov.uk/healthydiet/eighttipssection/8tips/
- Statistics UK: Census April 2001. Office for National Statistics.http://www.statistics.gov.uk/cci/nugget.asp?id=273
- Vyas A, Greenhakgh A, Cade J, Sanghera B, Riste L, SharmaS, Cruickshank K: Nutrient Intakes of an adult Pakistani,European and African-Caribbean community in inner city Britain. J Hum Nutr Diet 2003, 16: 327-337.
- Arvaniti F, Panagiotakos D: Healthy Indexes and Public Health Practice and research: A Review. Critical Reviews in Food Science and Nutrition 2008, 48: 317-327.
- Crozier SR, Inskip HM, Barker ME, Lawrence WT, Cooper C, Robinson SM: Development of a 20-item food frequency questionnaire to assess a “prudent” dietary pattern among young women in Southampton. Eur J Clin Nutr 2010, 64:99-104.
- Misra A, Vikram NK: Insulin Resistance Syndrome (metabolic syndrome) and obesity in South Asian Indians: Evidence and Implications. Nutrition 2004, 20: 482-491.
- Gao SK, Beresford SAA, Frank LL, Schreiner PJ, Burke JL, Fitzpatrick AL: Modifications to the Healthy Eating Index and its ability to predict obesity: the Multi-Ethnic Study of Atherosclerosis. Am J Clin Nutr 2008, 88: 64-69.
- Nicolau M, van Dam RM, Stronks K: Ethnicity, Acculturation and Education Level in Relation to Quality of the Diet: a study of Surinamese residents of the Netherlands. J Hum Nutr Diet 2006, 19: 383-393.
- Pereira MA, Jacobs DR Jr., Van Horn L, Slattery ML, Kartashov AI, Ludwig DS: Dairy consumption, obesity, and the insulin resistance syndrome in young adults: the CARDIA Study. JAMA 2002, 287: 2081–2209.
- Zemel MB, Miller SL: Dietary calcium and dairy modulation of adiposity and obesity risk. Nutr Rev 2004, 62: 125–131.
- Choi HK, Willett WC, Stampfer MJ, Rimm E, Hu FB: Dairy consumption and risk of type 2 diabetes mellitus in men: a prospective study. Arch Intern Med 2005, 165: 997–1003.
- Morgan KJ, Zabik ME, Stampley GL: The role of breakfast in diet adequacy of the U.S. adult population. J Am Coll Nutr 1986, 5: 551-563.
- Kant AK: Indexes of overall diet quality: A review. J Am Diet Assoc 1996, 96: 785-791.
- Maynard M, Gunnell D, Emmett P, Frankel S, Davey S: Fruit, vegetables and antioxidants in childhood and risk of a cancer: The Boyd Orr cohort. J Epidemiol Community Health 2003, 57: 218-225.
- Antony GM, Visweswara Rao K: A composite index to explain variations in poverty, health, nutritional status and standard of living: Use of multivariate statistical methods. Public Health 2007, 121: 578-587.
- Sharma A, Cade J, Riste L, Cruickshank S: Nutrient intake trends among African-Caribbeans in Britain: a migrant population and its second generation. Public Health Nutr 1999, 2: 469-476.
- Fischbacher CM, Hunt S, Alexander L: How physically active are South Asians in the United Kingdom? A literature review. Journal of Public Health 2004, 26: 250-258.
- Sriskantharajah J, Kain J: Promoting physical activity among South Asian women with coronary heart disease and diabetes: what might help? Family Practice 2007, 24: 71-76.
- Irala-Estevez JD, Groth M, Johansson L, Oltersdorf U, Prattala L, Martinez-Gonzalez MA: A systematic review of socioeconomic differences in food habits in Europe: consumption of fruits and vegetables. Eur J Clin Nutr 2000, 54: 706-714.
- Martin-Fernandez J, Grillo F, Tichit C, Parizot I, Chauvin P: Overweight according to geographical origin and time spent in France: a cross sectional study in the Paris metropolitan area. BMC Public Health 2012, doi:10.1186/1471-2458-12-937
- Jonnalagadda SS, Khosla P: Nutrient intake, body composition,blood cholesterol and glucose levels among adult Asian Indians in the United States. J Immigrant Minority Health 2007, 9: 171-178.
- Khokhar S, Pandor A, Cade J: Eating Habits: food preparation and serving practices in ethnic populations: critical review and assessment of dietary survey requirements. Report to the Food Standards Agency 2001, London , UK. FSA Project:NO8015.


