Exchange Rate Volatility and Portfolio Flows : A State Dependent and Heterogeneous Relationship, Evidence from Emerging Market Currencies
Süleyman Hilmi KAL*
Republic of Turkey Ministry of National Education, Ankara, Turkey.
*Corresponding Author
Süleyman Hilmi KAL,
Republic of Turkey Ministry of National Education, Ankara, Turkey.
E-mail: Suleyman.Kal@tcmb.gov.tr
Received: September 07, 2021; Accepted: November 11, 2021; Published: November 15, 2021
Citation: Süleyman Hilmi KAL. A Contemporary Approach to Customer Relationship Management. Int J Financ Econ Trade. 2021;4(2):100-107. doi: dx.doi.org/10.19070/2643-038X-2100013
Copyright: Süleyman Hilmi KAL©2021. This is an open-access article distributed under the terms of the Creative Commons Attribution License, which permits unrestricted use, distribution and reproduction in any medium, provided the original author and source are credited.
Abstract
In this paper, we investigated whether the relationship between bond and equity portfolio ows and exchange rate volatility
diers during times of high risk and low risk measured by VIX and existence of heterogeneity between among emerging
market (Brazil, Chile, Turkey, Mexico, Indonesia, Russia, Poland, South Africa)currencies. To this end, using weekly data, we
imple-mented two levels of analysis; rst, aggregate level, we employed impulse response functions of the PVAR method, and
second, at the individual level, we employed impulses responses of the MSVAR model. Our results point a very diverse and
state-dependent relationship between portfolio ows of both types and exchange rate volatilities.
JEL Codes: F31, F32,C32, C33
2.Introduction
3.A Look At Some Stylized Facts
4.Review Of Some Related Empirical Literature
5.The Method
6.The Results
7.Summary and Conclusion
8.References
Keywords
Exchange Rate Volatility; Markov Switching VAR; Panel VAR.
Introduction
Recent surge in the observed volatility of the exchange rates is
linked to liberalization of capital markets and increasing magnitude
and volatility of short term capital flows [3, 1, 8, 14, 2, 12, 6,
10, 4, 13]. Impact of cross-border short term capital flows (portfolio
flows) on exchange rate volatility is documented to be far
from being homogeneous among the different currencies with
similar exchange rate regimes and economic fundamentals [9].
Furthermore, it is also reported that impact of portfolio flows are
state dependent [5, 11].
Investigating the effects of equity and bond inflows for seven
Asian countries, [4] document that net equity (bond) inflows drive
the exchange rate to a high (low) volatility state. [9] Provide empirical
evidence of the existence of different exchange rate volatility
between floating ex- change rate countries with similar macroeconomic
fundamentals as a result of ‘noise trading’ in the foreign
exchange markets due to probable non-fundamental channel in
the link between exchange rate regimes and exchange rate volatility.
Arguing that investors react differently in different states of
the market, [11] shows that the relationship between exchange
rates and capital flows evolves over time and it is different under
different exchange rate volatility condi- tions. [4] investigates the
effects of bond and equity flows on the exchange rate volatility
of seven emerging developing Asian economies. They provide
evidence suggesting the association of high (low) exchange rate
volatility with equity (bond) inflows with one exception. They
conclude that capital controls could be an effective tool to stabilize
the foreign exchange market in countries where flows affect
exchange rate volatility. [12] find that high interest rate currencies
are negatively related to innovations in global FX volatility,
and thus deliver low returns in times of unexpected high volatility,
when low interest rate currencies provide a hedge by yielding
positive returns.[5], brings evidence on this issue from six emerging
markets that raising nominal interest rate lead to higher probability
of crises regime by utilizing a Markov regime switching
specification.
In this paper, using a weekly data set of major emerging markets
we will further investigate the issue of time-varying state dependent
impact of portfolio flows on for the currencies of emerging
markets (Brazil,Chile, Indonesia, Mexico,Philippines,Poland,
Russia, S.Africa, Turkey) for the period between 2004-2019. We
will proceed with two level of analysis for each type of portfolio
flow (equity and debt); first at ag- gregate level employing impulse response functions of Panel Data VAR method, we look
into general tendencies for the whole sample for different subtime
periods divided depending on the global risk appetite measured
by VIX. Second, using a two state Markov Switching Vector
Auto Regression (MSVAR) method, we analyze state dependent
effects of portfolio flows for each individual currency separately
to investigate heterogeneous impact of both type portfolio flows
among the countries and among the different type periods based
on global risk appetite.
Our contribution to literature is multi-fold. First, in our best
knowledge, this is the first study analyzing this relationship both
at aggregate and country level. Second, we showed that at the aggregate
level the relationship between bond flows, equity flows,
and exchange rate returns differ depending on the state of the
global risk appetite. Third, we provide further evidence at the individual
country level that the impact of bond and equity flows on
emerging country currencies show great heterogeneity.
The rest of the paper is as follows. In section next section Background
and Data, we will explain the data and visually look in
to the relationship between equity and bond flows and exchange
volatility with graphs for full period and for sub-periods. In the
third section, the econometric methods employed in this paper
will explained.
We will discuss the results in Section 4 and Section 5 will be conclusion
and policy implications.
Data and Background
Sample countries are Brazil, Turkey, Mexico, Argentina, South
Africa, Indone- sia,Poland, Philippines and Chile. Data used in
the paper is obtained from IRRF and Bloomberg data bases. The
periodicity of the portfolio flows, exchange rates and VIX are
weekly. Realized monthly volatility is calculated from daily data
for thirty days.
Mai objective of this paper is to investigate the existence of state
dependent relationship between portfolio flows and exchange
rate volatility at aggregate and country levels and heterogeneity
among the sample countries. Before quantifying this relationship
with econometric techniques, as a natural first step, we divided
sample period into sub-sample periods based on the state of the
global economy and compare and contrast the statistical properties
of the portfolio flows and the the exchange rates of each
country for each sample period. We determined sub- sample periods
based on the state of the global economy as flows: Pre-Financial
Crises Period: 2004-2008, Financial Crises Period: 2008-2013,
Post Financial Crises Period: 2013-2019.
Full Sample: 2004-2019
Figure 1 is intended to show comparative impact of the volatility
of equity and bond flows to the volatility of exchange rates
for the whole sample period:2004- 2019. Drawing these figures,
we first calculated coefficient of variation (stdv/mean) for equity,
bond flows for each country and ratio them to the coefficient of
variations of the each currency. The first graph of Figure I is for
equity flows and the second graph is for bond flows. For the first
graph, Argentinian peso was eliminated as an out-lier. It is evident
in the figure that other than Argentina, the volatility of both equity
and bond flows are comparatively greater affect on the the
volatility the currencies of Turkey, Chile and Poland.
Sub-Sample I: 2004-2008
This is the period which covers relatively calm period before the
great financial crises during which portfolio flows reached all time
high levels. Figure shows that affect of equity and bond portfolio
flows are heterogeneous the countries in sample. Compared with
Figure 1 it is evident that exchange rate volatility associated with
bond and equity flow volatility is lower during this sub-period
compared to the whole period and Chile,which has the most liberal
capital markets for this period, seems to have highest impact.
Sub-Sample II: 2008-2013
This is the crises period marked first by the 2008 Lehman Brother
crises and second with Euro era crises caused mainly by Greek,
Spain and Portuguese economies. We choose June of 2013 as the
end of liquidity abundance period with US FED president Ben
Bernanke’s famous tapering speech. Figure 7 shows the how volatility
of equity and bond portfolio flows affect volatility of the
currencies of the sample countries during this period. Compared
with the previous period, impact of the volatility of portfolio
flows on exchange rate volatility is smaller. During this 2008-2013
volatility of Chilean peso is more exposed to volatility of portfolio
flows than the other currencies. Currencies of Brazil, Mexico,
Russia are more resilient to the volatility of the equity and bond
flows.
Sub-Sample III: 2013-2019
The last sub-period that we analyzed is post-tapering speech period,
during which the global liquidity is reduced gradually. Figure
7 shows the how volatility of equity and bond portfolio flows
affect volatility of the currencies of the sample countries during
this period. Compared with the previous period (2008-2013),
impact of the volatility of equity flows on exchange rate volatility
is greater; again compared with pre-crises period, impact of the equity flows is greater but that of bond flows is smaller. During
this period countries like Argentina, Turkey are more vulnerable
for both types of flows.
Global risk appetite according to which states in the MSVAR
model is deter- mined by VIX value and CDS values for each
country is used in MSVAR model to govern time-varying transition
probabilities.
Methodology
Panel VAR
As briefly explained above both exchange rates and portfolio flows
affect each other,so the relationship between portfolio flows and
exchange rate returns is en- dogenous. Thus, in aggregate level,
we investigated this relationship by employing the panel data VAR
method, which combines endogeneity of all the variables in the
system of VAR method with unobserved individual heterogeneity
of the panel data method.The model formulated as follows:
where Zit is a vector of three variables: Exchange Rate Volatility
of Sample Coun- tries, Bond Flows to Sample Countries,
Equity Flows to Sample Countries. We used Granger causality
test to determine te order of the variables. The order selection
criteria suggest all endogenous variables to enter the model with a lag. Unobservable time-invariant fixed effects such as different
exchange rate regimes, country size, and financial regulation, at
country level is included in the model with the term fi. For- ward
mean-differencing is used to eliminate the correlated effects stemming
from lagged regressors by preserving the orthogonality between
transformed variables and lagged regressors with system
GMM12. Common time effects for all currencies such as to capture
any global macro economic shocks that may affect all countries
in the same way.For example, time effects capture common
factors such as key in- terest rates, spreads or global risk factors
are added to the model with dt. This is equivalent of putting time
dummies in the system.
Markov Switching Exchange VAR Model
Fixed effect panel VAR estimation provides a general idea about
relationship be- tween capital flows and exchange rates. Detecting
the existence of heterogeneity with respect to countries and
with respect to time periods requires analyzing each currency
separately with a method which allows state dependent and nonlinear
analysis. Regime depended analysis provides a better frame
work to investigate the relationship between exchange rate return
and portfolio flows depending on global risk appetite than dividing
sample period into sub-periods. Vector auto regres- sion will
allow us to address the endogeneity of the relationship between
exchange rate returns and portfolio flows. Thus, a two-state time
varying transition probabil- ity Markov Regime Switching Vector
Autoregressive Regression (MSVAR) model is employed in this
paper.
[7] who use the Markov regime switching models in econometrics
are pioneers in this litera- ture. Later on it is Hamilton(1990) who
popularized Markov switching models. In Markov models, an observable
variable yt depends on state variables which are not directly
observed. Here st is used for state variable definition. States
are defined as State 0, State 1.. State N. State variables, which are
not observed, evolve follow- ing a Markovian regime change. st,
state variable governs the distribution of each period. Thus, in
our model there are two distributions each with different means
and variance of yt which are based on the respected state. The
purpose of using Markov regime changing model in this paper is
to investigate whether relationship between exchange rate returns
and portfolio flows depend on global risk apatite. We choose Chicago
mercantile index VIX as the criteria to determine states of
high risk appetite and low risk appetite.
Markov switching approach utilized in this paper is briefly summarized
as follows:
Thus, in case st = 0 the observed changes of yt is a random
draw from distribution ( ) 0 0
/ ~ , 2 t t s s y s N μ σ and in case st = 1,
the observed changes of yt is a random draw from distribution
( ) 0 ~ /tt s y s N μ .
The probability density of yt conditional on state variable is formulated
as follows:
Transition between the states is only based on the previous state.
Transition probability is defined as the probability of switching
from one state to another state. Transition probabilities can be
constant, as Hamilton suggested in his very well cited work (Hamilton,
1989), or it can be time varying, as developed by Diebold,
Wein- bach and Lee (1994). In the Hamiltonian framework, the
probabilities of switching between the states are fixed, exogenous
and do not vary over time. For example, the transition from State
(t - 1) to State (t) is shown as: ( 1) ( | ) t t ij P s i s j P − = = =
These features of the model limit the explanatory power of the
Markov process. Allowing transition probabilities to change over
time, depending on a vector of variables, enriches the Markov
process by enabling it to model the underlying process of transitional
dynamics explicitly. Hamilton's constant transition model
is later evolved by Diebold, Weinbach and Lee (1994) by addition
of time-varying transition probabilities which are estimated with
logistic functions of vector of (x(t - 1)) as follows:
Since Sims (1980) study, Vector Autoregressive model has become
one of the major tools of empirical studies. Krolzig (1997)
introduces the regime changes to vector autoregressive model.
An MSVAR model provides framework of modeling multivariate
representation of related variables non-linearly. Following bond
and equity portfolio ows and exchange rate model is designed
with Markov specication, for each currency VAR of bond ows,
equity ows and exchange rate returns is model as follows:
where Φ is state dependent constant term, Yst state vector is
ranked as bond flows,equity flows and exchange rate return
(against USD) for each currency, Ωst error term.
According to this model, we will have a time varying transition
probability two state Markov switching autoregressive model.
State O is defined as the periods during which VIX index is less
than 25 and State 1 is the periods during which VIX index is higher
than that threshold level. We assume risk appetite is low in State
I and high in State 0. Thus, the model used is in this paper is to
see whether the relationship between both of the portfolio capital
flows and exchange rate volatility demonstrate any difference
between the states.
The impulse response functions uses Cholesky decomposition
and impulses are defined as one standard deviation positive
shocks the variables.
Empirical Results
Aggregate Model: PVAR Exchange Rate Volatility
In section impulse response graphs of PVAR model are presented
and discussed. As indicated in the previously sample period
in divided into four sub-periods to ana- lyze whether volatility
of exchange rate react differently to equity and bond flows depending
on the global risk appetite measured by VIX index: Precrises
Period: 2005-2008; Crises Period:2008-2013 and Post-crises
Period:2013-2019. The response of exchange rate volatility to a
one-standard-deviation shock to bond flows and eq- uity flows
are plotted. All graphs show responses for the first 10 quarters.
Upper and lower limits of are 90th percentile bounds constructed
using Monte Carlo simulations with 500 repetitions.Each of the graphs also plots the zero line.
Figure 5 shows aggregate volatility response of sample countries
to the impulses of equity and bond flows for the full-period,
2005-2019. The first graph of Figure 1 indicate that bond flows
reduce exchange rate volatility, second graph of Figure 1 on the
other hand portrays a different outcome for equity flows, equity
flows initially increase the volatility of exchange rates for four
periods before it is reduced. Results shown in Figure 6 are for
pre-crises period, 2005-2008 are different from the whole sample
period; bond flows during this period increase exchange rate
volatility permanently, while equity flows decrease it permanently.
During the great financial crises period (2008-2013) bond flows
do not have significant impact on exchange rate volatility, while
equity flows reduce it permanently. Post-crises period relationship
is similar to hat of the whole sample period.
Impulse response figures of PVAR method provides evidence
that heterogeneous response of exchange rate among different
period between 2004-2019 provide ev- idence that exchange rate
volatility portfolio flows relationship is not linear and depending
on the investors’ risk appetite both types of portfolio flows sometimes
reduce sometimes elevate exchange rate volatility. After detecting
this important pattern from aggregate analysis, as a natural
next step we will discuss the results of same VAR ranking analysis
for implemented to individual currencies separately by employing
MSVAR frame work in the next session.
Impulse response figures of PVAR model indicate that aggregate
the relationship between bond and equity portfolio flows is heterogeneous
across the different periods.
Exchange Rate Volatility Model Markov Regime Switching
VAR Models
MSVAR framework allows to model state dependent variables. In
the previous sec- tion, results imply that at aggregate level both
types of portfolio flows and exchange rate volatility are not linear
and vary depending on the global risk appetite mea- sured by
VIX. As explained above we employed MSVAR method for each
currency separately to investigate state dependent impact of portfolio
flows on exchange rate volatilities. In this context, States of
MSVAR model is determined based on VIX value. A VIX value
of higher than 25 is determined as high risk low risk appetite state
and a VIX value of lower than 25 is determined as periods of low
risk state.
Figure 9 shows he smoothed transition probability of being at
State 1 of MSVAR model. This figure compared to sub-periods
of PVAR analysis shows a more nu- anced state depended analysis.
Figures 10 to Figure 16 show the response of the return of the
each currency in both states. First two graphs of each figure show
the volatility response of each currency to bond and equity positive
one standard deviation shock in State 0 and last to those of
in State 1. When one looks at the figures together, diversity of the
volatility responses of the exchange rates to the bond and equity
flows are notice- able. Bond flows permanently reduce volatility
of Brazilian real and Russian ruble in State 0, also in State I bond flows reduce volatility of Chilean peso, Russian ruble and South
African zar permanently. On the other hand, bond flows in State 0
increase volatilties of Chilean peso, Mexican peso, South African
zar, permanently and Polish zlot,Turkish lira and Mexican peso
temporarily; In State it increases volatilities of Brazilian real, Turkish
lira temporarily and Mexican peso, Polish zlot permanently.
Responses to equity flows also plot a a very heterogeneous picture
in their impact on exchange rate volatilities of emerging market
currencies.In State 0, equity flows permanently reduce the volatilities
of Brazilian real, Polish zlot and Russian ru- ble; volatilities of
Chilean and Mexican peso are temporarily reduced.On the other
hand, volatilities of Turkish lira, South African zar are permanently
increased by equity flows. In State 1, Polish zlot, Russian
ruble, Turkish lira, South African zar are permanently reduced by
equity flows;volatilities of Brazilian real and Mexican peso temporarily
reduced and Chilean peso permanently elevated. Impulse
response analysis of bond equity flows on exchange rate volatilities
of emerging market cur- rencies provide additional evidence
of heterogenous and state dependent impact of portfolio flows
on exchange rate volatilities.
According to the graphs (Figure 7), response of return of
Chilean Peso to bond flow shocks at State 0 and State 1 is
different,appreciate at State 0 and depreciate at State 1, response
of the currency to equity flows on the other hand is similar in
states appreciation.
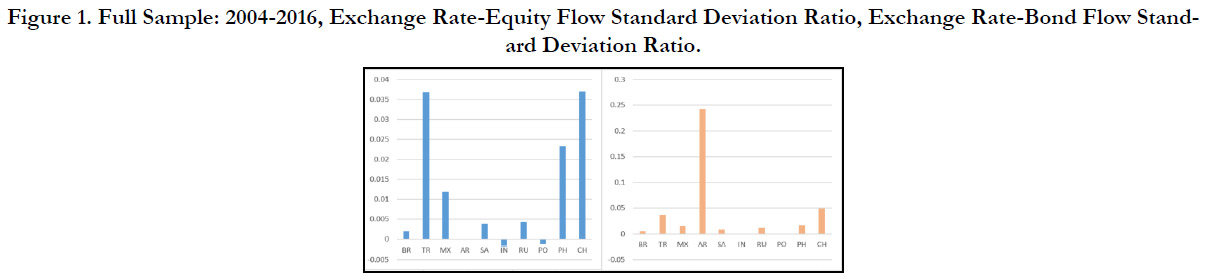

Figure 1. Full Sample: 2004-2016, Exchange Rate-Equity Flow Standard Deviation Ratio, Exchange Rate-Bond Flow Standard Deviation Ratio.
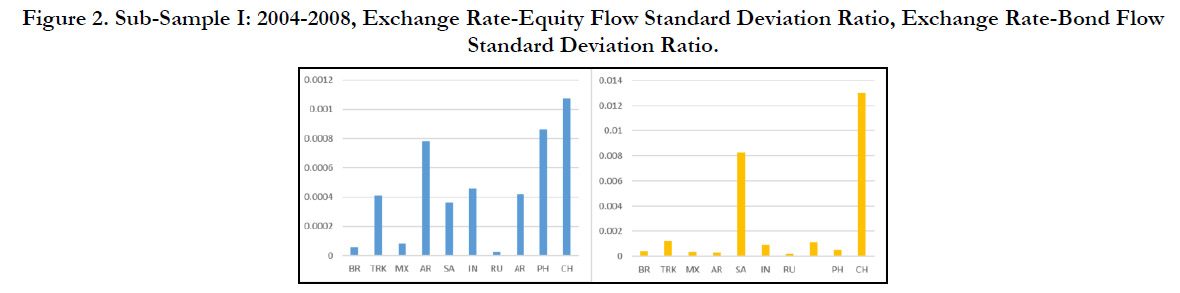
Figure 2. Sub-Sample I: 2004-2008, Exchange Rate-Equity Flow Standard Deviation Ratio, Exchange Rate-Bond Flow Standard Deviation Ratio.
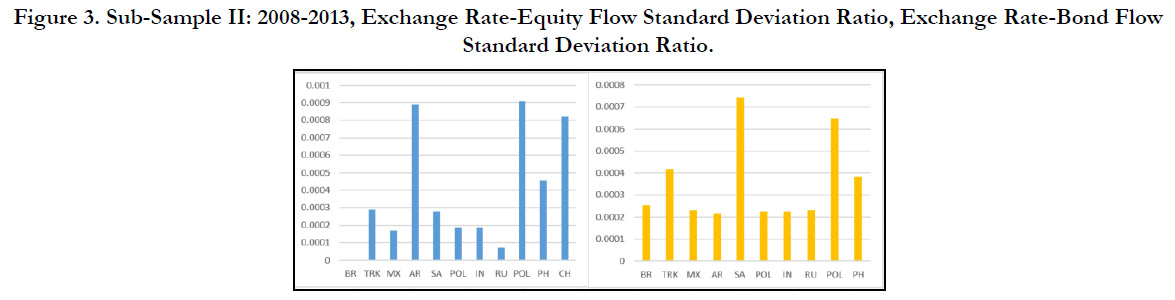
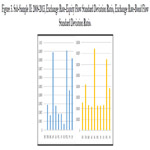
Figure 3. Sub-Sample II: 2008-2013, Exchange Rate-Equity Flow Standard Deviation Ratio, Exchange Rate-Bond Flow Standard Deviation Ratio.
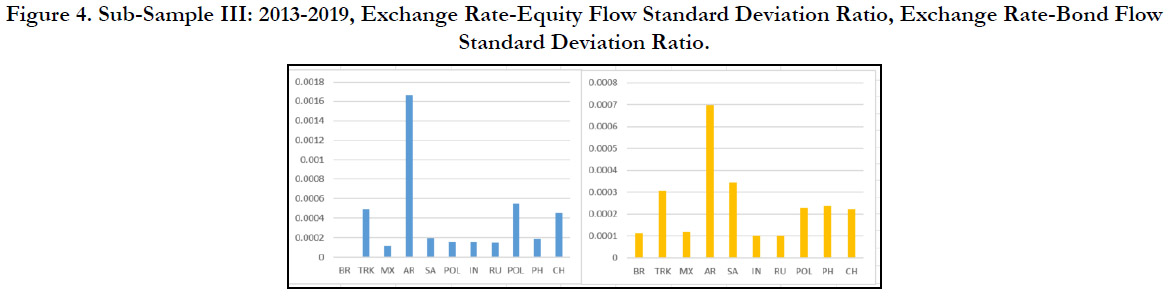

Figure 4. Sub-Sample III: 2013-2019, Exchange Rate-Equity Flow Standard Deviation Ratio, Exchange Rate-Bond Flow Standard Deviation Ratio.
Figure 5. PVAR Exchange Rate Volatility Response, 2005-2019, Bond Flows, Equity Flows.
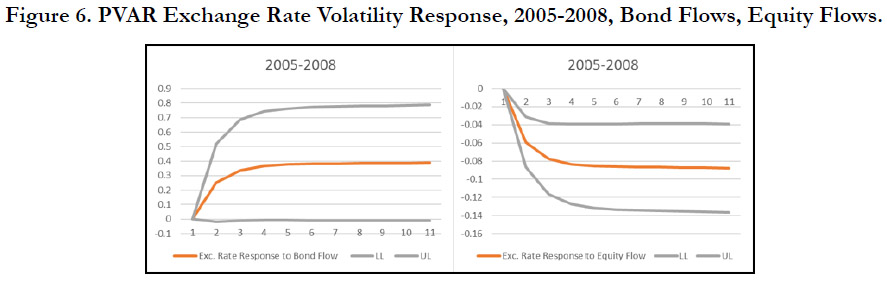

Figure 6. PVAR Exchange Rate Volatility Response, 2005-2008, Bond Flows, Equity Flows.
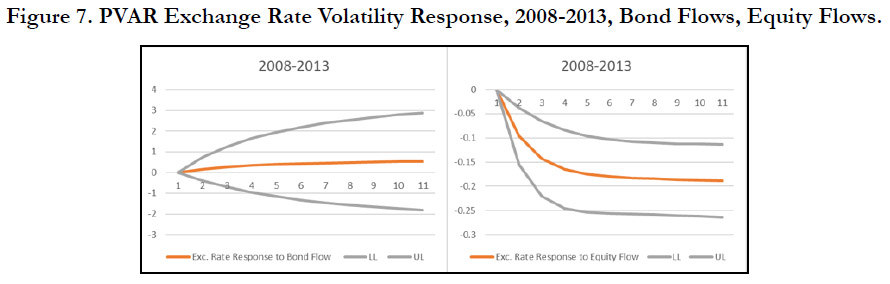
Figure 7. PVAR Exchange Rate Volatility Response, 2008-2013, Bond Flows, Equity Flows.
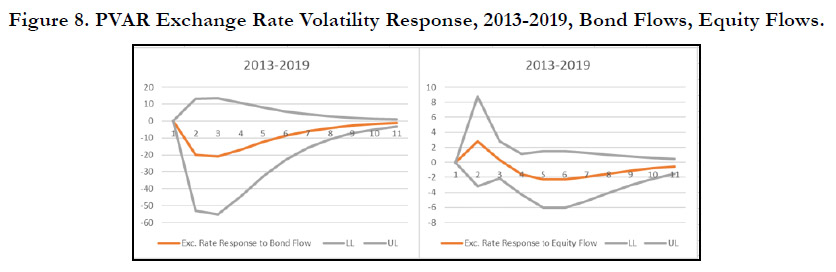
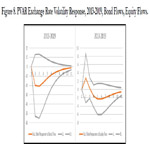
Figure 8. PVAR Exchange Rate Volatility Response, 2013-2019, Bond Flows, Equity Flows.
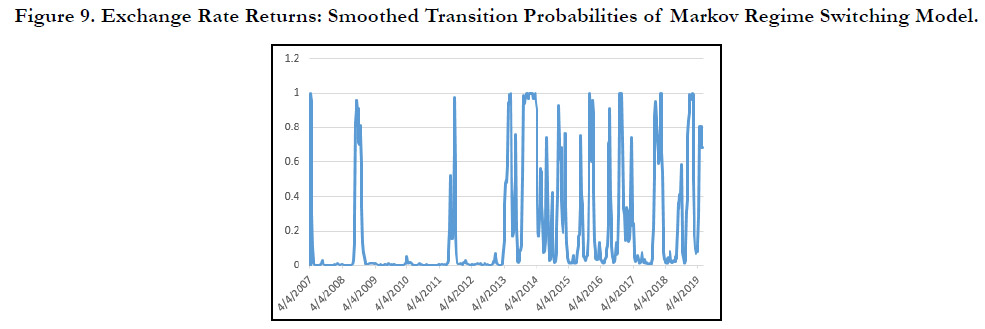
Figure 9. Exchange Rate Returns: Smoothed Transition Probabilities of Markov Regime Switching Model.
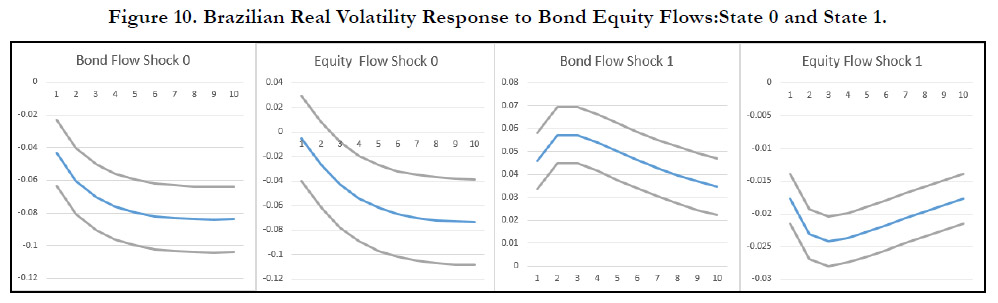
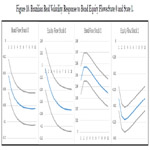
Figure 10. Brazilian Real Volatility Response to Bond Equity Flows:State 0 and State 1.
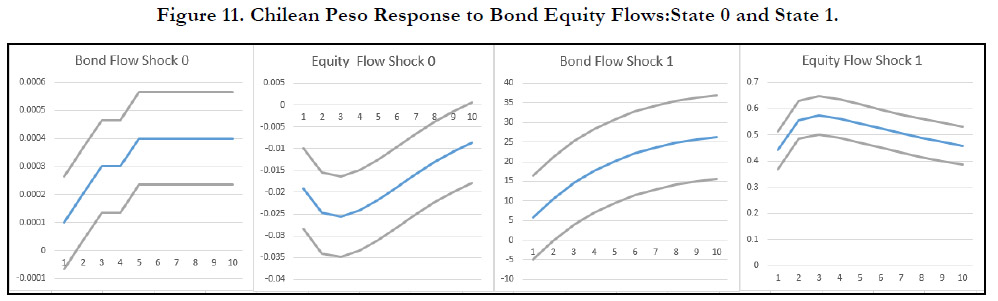
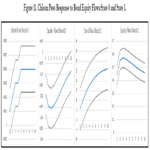
Figure 11. Chilean Peso Response to Bond Equity Flows:State 0 and State 1.
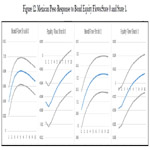
Figure 12. Mexican Peso Response to Bond Equity Flows:State 0 and State 1.
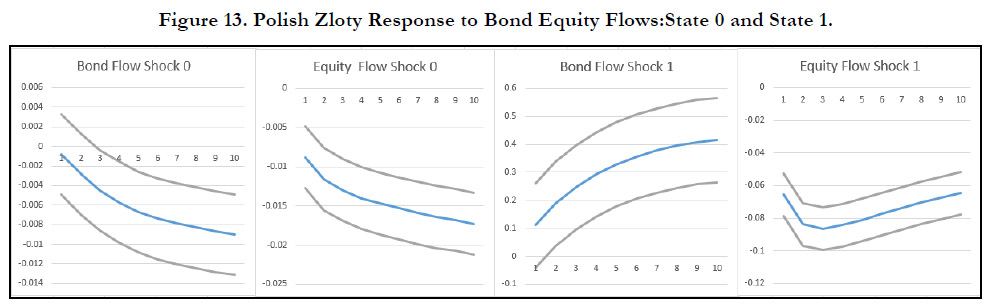
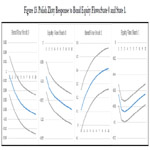
Figure 13. Polish Zloty Response to Bond Equity Flows:State 0 and State 1.
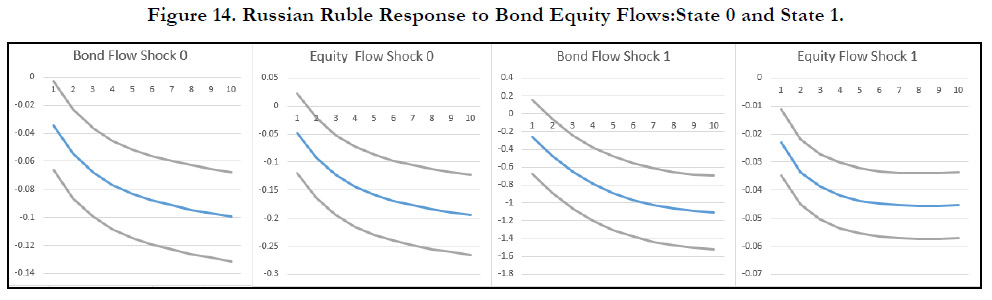
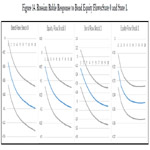
Figure 14. Russian Ruble Response to Bond Equity Flows:State 0 and State 1.
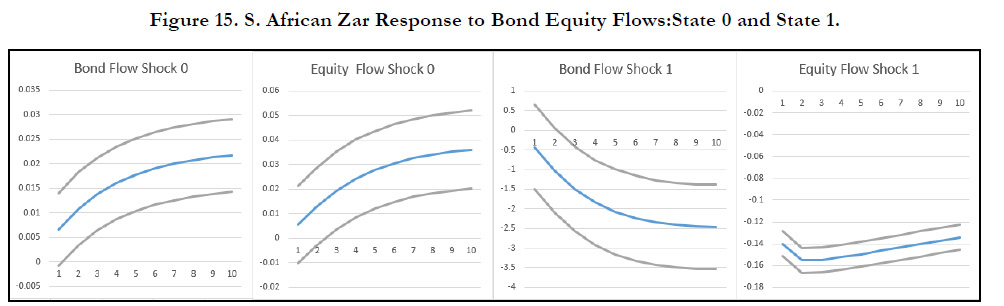
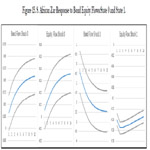
Figure 15. S. African Zar Response to Bond Equity Flows:State 0 and State 1.
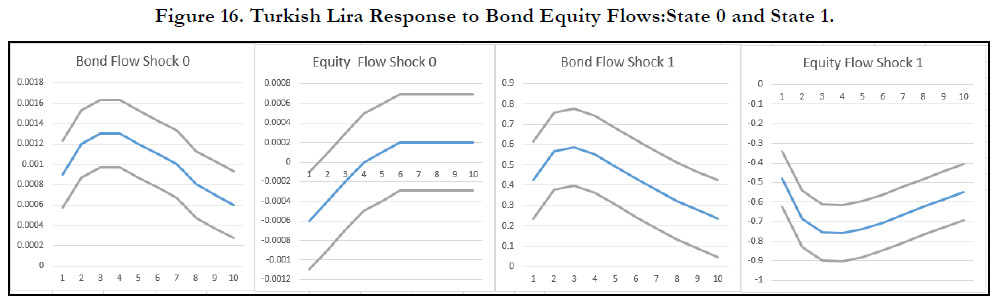
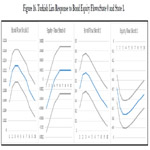
Figure 16. Turkish Lira Response to Bond Equity Flows:State 0 and State 1.
Conclusion
In this paper, we investigated heterogeneous effect of bond and
equity portfolio flows on volatility of emerging market currencies.
Following a two stage analysis method, we found at aggregate
level, for different periods, bond and equity flows have varying
impact on emerging market currencies together. And at individual
level, our results point a very diverse and heterogeneous impact
of portfolio flows on the volatilties of emerging markets currencies.
As a conclusion, it is hard to generalize a pattern of impact
of portfolio flows on emerging market currencies. Thus, central
bank policies on attracting foreign capital for currency stabilization
may lead to unexpected results.
Compliance with Ethical Standards: This article does not contain
any studies with human participants performed by the author.
This article does not contain any studies with animals performed
by the author. This article does not contain any studies with human
participants or animals performed by the author.
Conflict of Interest Statement: On behalf of the author, the corresponding
author states that there is no conflict of interest.
Data Availability Statement : The data that support the findings
of this study are available from the corresponding author upon
reasonable request.
Financial Support Statement: This research received no specific
grant from any funding agency in the public, commercial, or notfor-
profit sectors.
References
- Arief A, Megawati S. Analysis of factors affecting the satisfaction and loyalty of the use of cargo services: A case study of PT. BEX. Russian Journal of Agricultural and Socio-Economic Sciences. 2019;87(3).
- Arsić S, Banjević K, Nastasić A, Rošulj D, Arsić M. Family business owner as a central figure in customer relationship management. Sustainability. 2018;11(1):1-9.
- Ashraf S, Ilyas R, Imtiaz M, Ahmad S. Impact of service quality, corporate image and perceived value on brand loyalty with presence and absence of customer satisfaction: A study of four service sectors of Pakistan. International Journal of Academic Research in Business and Social Sciences. 2018;8(2):452-74.
- Stenley B. Customer Relationship Management: a strategic imperative in the world of e–business. Willey; 2000.
- Colicev A, Malshe A, Pauwels K, O'Connor P. Improving consumer mindset metrics and shareholder value through social media: The different roles of owned and earned media. Journal of Marketing. 2018 Jan;82(1):37-56.
- Dzikowski P. A bibliometric analysis of born global firms. Journal of Business Research. 2018 Apr 1;85:281-94.
- Fidel P, Schlesinger W, Emilo E. Effects of customer knowledge management and customer orientation on innovation capacity and marketing results in SMES: the mediating role of innovation orientation. International Journal of Innovation Management. 2018 Oct 5; 22(07): 26-55.
- Fossen BL, Schweidel DA. Measuring the impact of product placement with brand-related social media conversations and website traffic. Marketing Science. 2019 May;38(3):481-99.
- Gai PJ, Klesse AK. Making recommendations more effective through framings: Impacts of user-versus item-based framings on recommendation click-throughs. Journal of Marketing. 2019 Nov;83(6):61-75.
- Gholami H, Zameri Mat Saman M, Mardani A, Streimikiene D, Sharif S, Zakuan N. Proposed analytic framework for student relationship management based on a systematic review of CRM systems literature. Sustainability. 2018 Apr;10(4):1237.
- Gholami S, Rahman MS. CRM: A conceptual framework of enablers and perspectives. Business and Management Research. 2012 Mar;1(1):96-105.
- Gil-Gomez H, Guerola-Navarro V, Oltra-Badenes R, Lozano-Quilis JA. Customer relationship management: digital transformation and sustainable business model innovation. Economic research-Ekonomska istraživanja. 2020 Jan 1;33(1):2733-50.
- Gimpel H, Kleindienst D, Nüske N, Rau D, Schmied F. The upside of data privacy–delighting customers by implementing data privacy measures. Electronic Markets. 2018 Nov;28(4):437-52.
- Grabner-Kraeuter S, Moedritscher G. Alternative approaches toward measuring CRM performance. In Sixth Research Conference on Relationship Marketing and Customer Relationship Management, Atlanta (June 9–12) 2002 Jun 9.
- Grewal L, Stephen AT. In mobile we trust: The effects of mobile versus non mobile reviews on consumer purchase intentions. Journal of Marketing Research. 2019 Oct;56(5):791-808.
- Janakiraman R, Lim JH, Rishika R. The effect of a data breach announcement on customer behavior: Evidence from a multichannel retailer. Journal of Marketing. 2018 Mar;82(2):85-105.
- Jham V, Khan KM. Customer satisfaction in the Indian banking sector: A study. IIMB Management Review. 2008 Mar;20(1):84-93.
- Kebede AM, Tegegne ZL. The effect of customer relationship management on bank performance: In context of commercial banks in Amhara Region, Ethiopia. Cogent Business & Management. 2018 Jan 1;5(1):1499183.
- Komba MM, Lwoga ET. Systematic Review as a Research Method in Library and Information Science. Handbook of Research on Connecting Research Methods for Information Science Research. 2020:80-94.
- Kotler P, Keller KL, Koshy A, Jha M. Marketing management(13thedition). Pearson Education. 2012.
- Krizanova A, Gajanova L, Nadanyiova M. Design of a CRM level and performance measurement model. Sustainability. 2018 Jul;10(7):1-17.
- Kumar V, Leszkiewicz A, Herbst A. Are you back for good or still shopping around? Investigating customers' repeat churn behavior. Journal of marketing research. 2018 Apr;55(2):208-25.
- Liu W, Wang Z, Zhao H. Comparative study of customer relationship management research from East Asia, North America and Europe: A bibliometric overview. Electronic Markets. 2020 Dec;30(4):735-57.
- Meire M, Hewett K, Ballings M, Kumar V, Van den Poel D. The role of marketer-generated content in customer engagement marketing. Journal of Marketing. 2019 Nov;83(6):21-42.
- Mbango P. The role of perceived value in promoting customer satisfaction: Antecedents and consequences. Cogent Social Sciences. 2019 Jan 1;5(1):1684229.
- Mylonakis J. Customer relationship management functions: A survey of Greek bank customer satisfaction perceptions. IUP Journal of Bank Management. 2009 May 1;8(2):7.
- Nguyen HT, Nguyen H, Nguyen ND, Phan AC. Determinants of customer satisfaction and loyalty in Vietnamese life-insurance setting. Sustainability. 2018 Apr;10(4):1151.
- Pawson R, Greenhalgh T, Harvey G, Walshe K. Realist review--a new method of systematic review designed for complex policy interventions. J Health Serv Res Policy. 2005 Jul;10 (1):21-34. Pubmed. PMID: 16053581.
- Petticrew M, Roberts H. Systematic reviews in the social sciences: A practical guide. 2006.
- Pohludka M, Stverkova H, Ślusarczyk B. Implementation and unification of the ERP system in a global company as a strategic decision for sustainable entrepreneurship. Sustainability. 2018 Aug;10(8): 1-16.
- Raghuvanshi R, Tripathi R. Customer relationship management as a strategic tool in the Indian banking sector: A case study of Axis Bank at Lucknow [Paper presentation]. National Conference on Emerging Challenges for Sustainable Business, Haridwar, Uttarakhand, India. 2012.
- Rahi S. Research design and methods: A systematic review of research paradigms, sampling issues and instruments development. International Journal of Economics & Management Sciences. 2017;6(2):1-5.
- Ryals L, Payne A. Customer relationship management in financial services: towards information-enabled relationship marketing. Journal of strategic marketing. 2001 Jan 1;9(1):3-27.
- Samudro A, Sumarwan U, Simanjuntak M, Yusuf E. Assessing the effects of perceived quality and perceived value on customer satisfaction. Management Science Letters. 2020;10(5):1077-84.
- Samudro A, Sumarwan U, Simanjuntak M, Yusuf EZ. How commitment, satisfaction, and cost fluctuations influence customer loyalty. Samudro, A. 2019 Jun 19:115-25.
- Howshigan S, Ragel VR. The Effectiveness of Switching Barrier on Customer Loyalty Mediated with Customer Satisfaction: Telecommunication Industry, Batticaloa. South Asian Journal of Social Studies and Economics. 2018 Nov 15:1-9.
- Sin LY, Alan CB, Yim FH. CRM: conceptualization and scale development. European Journal of marketing. 2005 Nov 1.
- Susanti V, Sumarwan U, Simanjuntak M, Yusuf EZ. Rational antecedent framework of brand satisfaction in the industrial market: Assessing rational perceived quality and rational perceived value roles. International Review of Management and Marketing. 2020;10(1):19.
- Swift RS. Accelerating customer relationships: Using CRM and relationship technologies. Prentice Hall Professional; 2001.
- Tellis GJ, MacInnis DJ, Tirunillai S, Zhang Y. What drives virality (sharing) of online digital content? The critical role of information, emotion, and brand prominence. Journal of Marketing. 2019 Jul;83(4):1-20.
- Victor L. Systematic reviewing in the social sciences: outcomes and explanation. Enquire. 2008;1(1):32-46.
- Won EJ, Oh YK, Choeh JY. Perceptual mapping based on web search queries and consumer forum comments. International Journal of Market Research. 2018 Jul;60(4):394-407.
- Zeng M, Cao H, Chen M, Li Y. User behaviour modeling, recommendations, and purchase prediction during shopping festivals. Electronic Markets. 2019 Jun;29(2):263-74.


