Market Efficiency in Emerging Markets ETFs
Krause TA*
Black School of Business, Penn State Behrend, Jordan Rd., Erie, PA, USA.
*Corresponding Author
Timothy A. Krause,
Black School of Business, Penn State Behrend,
5101 Jordan Rd., Erie, PA, 16563, USA.
Tel: (814) 898-6326
E-mail: tak25@psu.edu
Received: October 02, 2019; Accepted: November 05, 2019 Published: November 07, 2019
Citation: Krause TA. Market Efficiency in Emerging Markets ETFs. Int J Financ Econ Trade. 2019;3(3):64-73. doi: dx.doi.org/10.19070/2643-038X-190009
Copyright: Krause TA© 2019. This is an open-access article distributed under the terms of the Creative Commons Attribution License, which permits unrestricted use, distribution and reproduction in any medium, provided the original author and source are credited.
Abstract
Exchange Traded Funds (ETFs) in emerging markets are currently popular with investors since they rose almost forty percent in 2017 on average, as opposed to the S&P 500 return of just over twenty percent. Although ETFs are generally accepted as a low-cost alternative to investing in individual equities, this cost is increased by deviations from net asset value (NAV). The most important factor that determines significant deviations from net asset value for emerging markets ETFs is the presence of negative returns and the resulting asymmetric volatility, while the age of the fund is also an important factor. These results are most likely related to the inability of market participants to short sell individual equities in emerging markets. A loosening of restrictions on short selling in these markets may contribute to the more efficient impounding of information in security prices.
2.Introduction
3.Data Sample
4.Methodology and Empirical Results
5.Conclusion
6.References
Keywords
Emerging Markets; Exchange Traded Fund; ETF; Market Efficiency; Net Asset Value.
Introduction
Market efficiency in developed capital markets has been examined extensively in the finance literature, but Kearney (2012) [14] suggests that further research regarding market efficiency in emerging markets is warranted. Additionally, in a survey of investor “reaction, sentiment, and institutional trading in emerging markets,” Brzeszczynski, et al., (2015) [5] suggest a dozen separate areas of potential research in emerging financial markets (p. 339). These observations motivate the current study which examines the evolution of market price deviations from net asset value (NAV) in emerging markets exchange-traded funds (ETFs). The main findings are that deviations from net asset values decrease markedly over time and are negatively related to both monthly ETF returns and the age of the fund. Both findings indicate that efficiency in emerging markets ETFs follows a similar pattern to those in developed markets but may be limited by the “limits to arbitrage” that occur due to short selling constraints in these markets, as postulated by Schleifer and Vishny (1997) [21].
Investing in the ETFs of emerging markets securities has seen increased interest [22] since the sector rose 37.4% in 2017 (as proxied by the iShares Emerging Markets ETF, symbol IEMG), as compared to 21.8% for the S&P 500 Index ETF (SPY). Investors are able to obtain broad exposure to these markets at a relatively low cost in terms of management fees and expense ratios. However, Angel et al., (2016) [1] demonstrate that the true cost of ETF investing must incorporate deviations from net asset value (NAV). They show that, although bid-ask spreads for ETFs may be narrow even for emerging markets ETFs, the true cost of trading should incorporate a consideration of deviations from NAV, since it can be an order of magnitude higher than expense ratios due to the much larger bid-ask spreads of the securities held by the ETF. Similarly, Blitz and Huij (2012) [4] show that tracking errors are substantially higher for emerging market ETFs when compared to developed market ETFs. While Hougan (2014) [11] states that investors’ most important consideration in an ETF purchase is its expense ratio, he also cites tracking error as an important consideration. Tang and Xu (2013) [24] provide a similar analysis, although their research only examines ETFs in China. Rompotis (2017) [19] provides somewhat conflicting information on the weak-form efficiency of emerging markets ETFs, and the goal of this study is to attempt to shed further light on the issue. Krause and Tse (2018) [16] provide information regarding the relative impact of currency effects relative to the commodity producing capabilities to the respective emerging markets. Currency fluctuations may also impose costs on emerging markets ETF investors. Since Yavas and Rezayat (2015) [29] find significant benefits to diversifying via emerging markets ETFs, the issue seems to be of interest to both institutional and individual investors.
Background information on the ETF industry and its importance in financial markets is provided by Madhavan (2014) [17].
To summarize the results of this study, the overall average deviations from net asset value (DNAV) in our ETF data sample are near zero (18 basis points), but average absolute deviations from net asset value (ADNAV) average 2.61%. There is a clear decline in absolute deviations from net asset value (ADNAV) since these funds were introduced. While absolute deviations from NAV declined by 71.56% for developed European markets, they also declined by 30.60% for Eastern European and Russian ETFs, and 67.94% for general emerging markets exchange-traded funds. The results clearly indicate that deviations from net asset value are negatively related to contemporaneous monthly returns, which is most likely related to the inability to short sell securities in these markets. Evidence regarding the inability to easily short sell emerging markets securities is provided by Tully (2013) [27]. Fund age is another significant factor in the evolution of market efficiency in these products, since deviations from NAV decline over time. The study also confirms the well-documented positive volume-volatility relations, and the results of the study are confirmed by several tests of robustness.
Data Sample
The data for this study is provided by the CRSP database of security and mutual fund returns, both of which contain data for Exchange Traded Funds (ETFs) in emerging markets. As indicated in Table 1, there are 351 ETFs in the sample, including seven separate categories of emerging markets ETFs and two comparable developed market ETFs, which are included for comparative purposes. The comparative ETFs that are included are Developed European market ETFs and U.S. Small Cap ETFs, which seem most directly comparable to Emerging Markets ETFs.
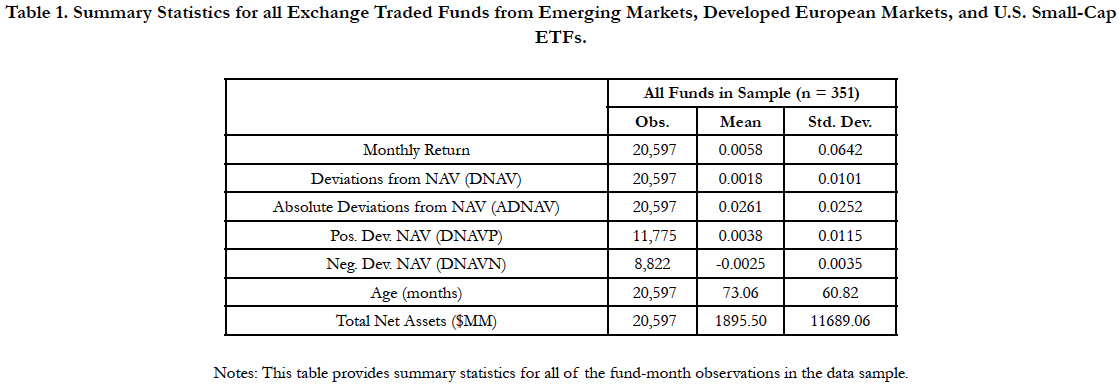

Table 1. Summary Statistics for all Exchange Traded Funds from Emerging Markets, Developed European Markets, and U.S. Small-Cap ETFs.
The CRSP database provides daily net asset values, ETF prices, returns, and additional fund information. The daily NAV values are averaged on a monthly basis in order to provide comparable statistics for fund age and total net assets, which are reported on a monthly basis. Summary statistics for this data is provided in Table 1. The table indicates that mean monthly return of these funds is 58 basis points (bps), with a similar standard deviation of 64 bps. Overall deviations from net asset value (DNAV) are near zero (18 bps), but average absolute deviations from net asset value (ADNAV) total 2.61%, an indication of potential market inefficiencies. The average age of the sample funds is 6.09 years (73.06 months), with a standard deviation of 5.07 years (60.82 months). Finally, the average size of each fund is approximately $1.9 billion, with a wide dispersion of net asset size (standard deviation of $11.7 billion). Because fund age is closely correlated with fund total net assets (Pearson correlations coefficient of 0.29), the latter variable is excluded from further analysis. Additionally, in order to explore the data in full and to avoid potential “omitted variable” bias, data are collected for each of the funds’ expense ratios, management fees, and volume (turnover). None of these variables are consistently significant when included in the empirical specifications below, so they are excluded from further discussion.
Further sample fund details are provided in Table 2, where fund characteristics are broken down by geographic region. As is evident for the Emerging Markets, there are regional funds with as few as three ETFs (the BRIC countries of Brazil, Russia, India, and China), and as many as 61 for General Emerging Markets funds). Each of the developed markets funds contains a slightly greater number of funds (72 for developed European markets and 63 for U.S. small cap funds). The “youngest” group of funds is that for Eastern Europe and Russia (average age 46.24 months), while the “oldest” group of funds is the Developed European ETFs (average age 103.94 months).
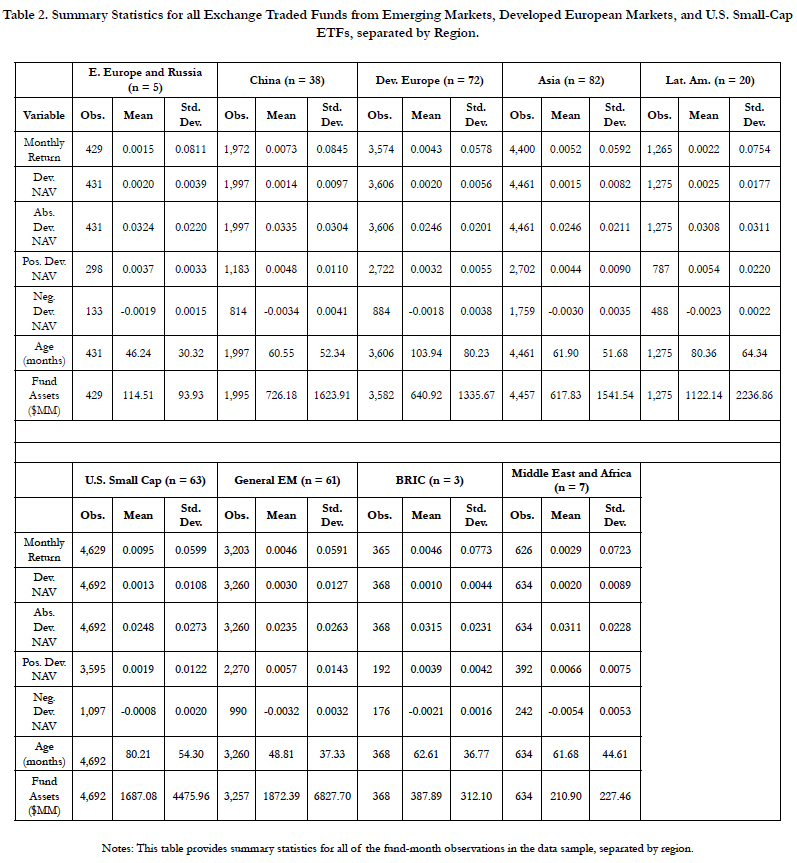
Table 2. Summary Statistics for all Exchange Traded Funds from Emerging Markets, Developed European Markets, and U.S. Small-Cap ETFs, separated by Region.
More insightful information can be gleaned from Table 3 and the graphs in Figure 1. Table 3 contains data regarding the emerging markets funds’ start dates, as well as initial and final ADNAV’s, which indicate how markets have become more efficient over time. For each fund group, a 12-month rolling average ADNAV is calculated over the sample period, and substantial reductions in these deviations are observed over time. The greatest reduction is present in the Developed European markets, where ADNAV declines by 71.56% over the sample period, although all of the ETF ADNAV values decline by at least thirty percent. The lower magnitude of declines in ADNAV for the emerging markets may be related to constraints on short selling [27]. One of the main results of this study is provided in the graphs of Figure 1 that demonstrate the clear decline in absolute deviations from net asset value (ADNAV) since their inception of trading. All of these markets have become more efficient over time, and the trends are obviously apparent in each of the graphs.
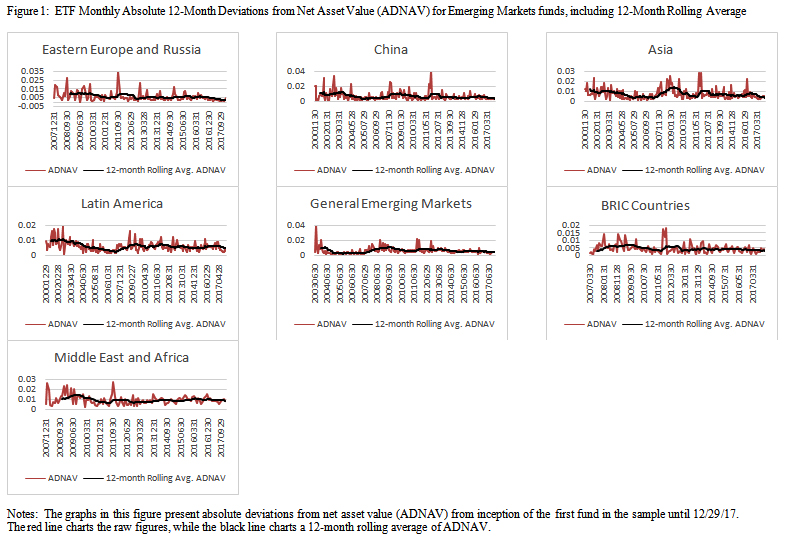
Figure 1. ETF Monthly Absolute 12-Month Deviations from Net Asset Value (ADNAV) for Emerging Markets funds, including 12-Month Rolling Average.
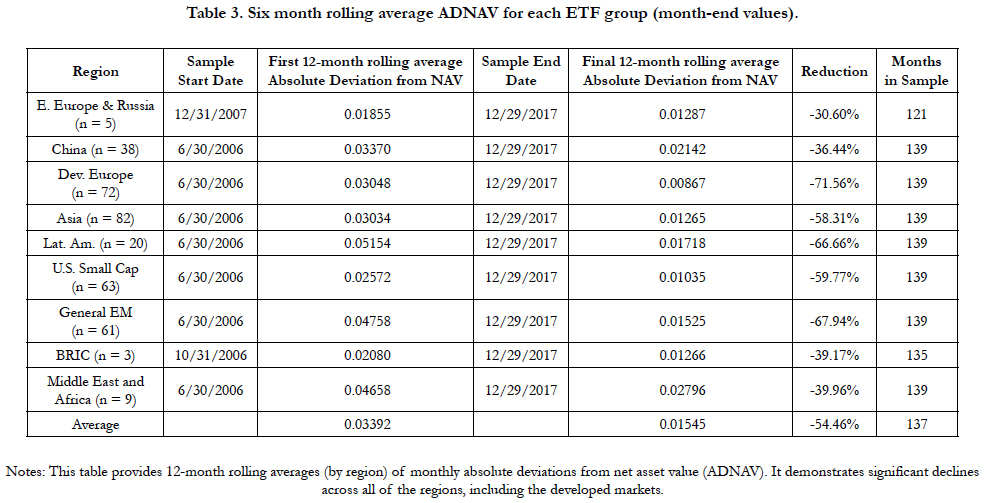
Table 3. Six month rolling average ADNAV for each ETF group (month-end values).
Methodology and Empirical Results
In order to compare the fund returns more directly, panel-data regressions (with fixed-effects for each individual fund) are conducted for the entire sample and each regional fund in Table 4. The dependent variable for all of these specifications is the absolute deviation from net asset value (ADNAV), while the independent variables are the funds’ monthly returns and their age (in years) for each regional sector ETF i at time t:
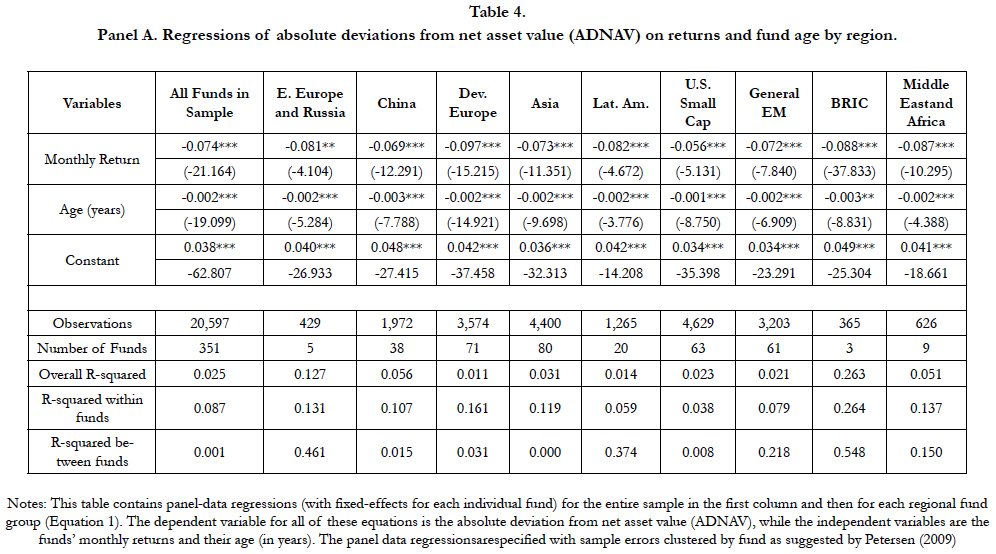
Table 4. Panel A: Regressions of absolute deviations from net asset value (ADNAV) on returns and fund age by region.
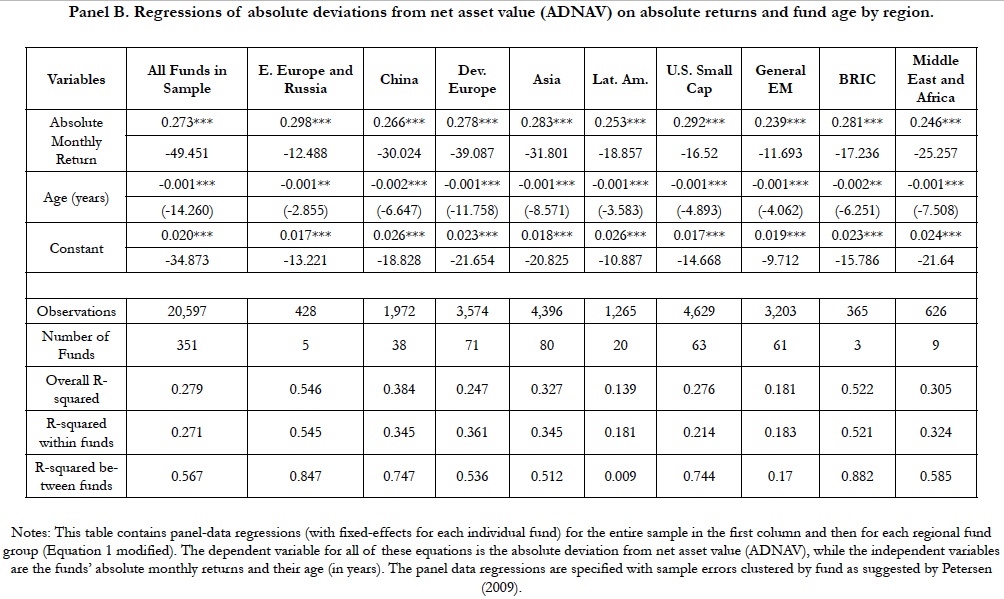
Table 4. Panel B. Regressions of absolute deviations from net asset value (ADNAV) on absolute returns and fund age by region.

Table 4. Panel C. Regressions of deviations from net asset value (ADNAV) on absolute returns, fund age, and SPY market volume by region.
ADNAVi,t = α+β1 RETi,t + β2 AGEi,t + εi,t ---- (1)
All of the regressions are conducted with sample errors clustered by fund, as suggested by Petersen (2009) [18], and the results of this initial specification for all funds in the sample are provided in the first column of Table 4. The results clearly indicate that deviations from net asset value are negatively related to contemporaneous monthly returns. A one percent decrease in monthly returns leads to an increase in the average absolute deviation from net asset value of 7.4%, while the converse is true as well. Thus, during periods of negative returns that are generally associated with greater market volatility (the well-documented “asymmetric volatility” phenomenon), deviations from fundamental value increase. This is most likely a result of liquidity providers increasing bid-ask spreads to compensate for the increased volatility. This argument is explored extensively in the literature, including Subrahmanyam (1991) [23], Gorton and Pennachi, (1993) [9], Ben-David, Franzoni and Moussawi (2014) [3], Krause et. al., (2014) [15], Sarwar and Khan (2017) [20], Teng-Ching and Kuei-Yuan (2017), and Badshah (2018) [2]. The results are also economically and statistically significant for all of the regions under study. The coefficients are highest for developed European funds (coefficient of -0.097), and lowest for U.S. Small Caps (coefficient of -0.056).
The negative and significant coefficients for fund age demonstrate that the effect of negative returns on deviations from NAV is attenuated by the number of years that a fund has been in existence. In terms of economic significance, the negative and significant coefficient for returns of all sample funds (-0.002) indicates that a one-year increase in fund age is associated with a 20-basis point decrease in average ADNAV for the full sample, while the results are slightly more pronounced for Chinese and BRIC country ETFs (coefficients of -0.003, or 30 bps). As indicated by the negative and significant coefficient for fund age, the effect of negative returns on deviations from NAV is attenuated by the number of years that a fund has been in existence. As a robustness check on the model specification, the data is examined for the potential for endogeneity that may bias the panel data regressions, due to potential correlations among the dependent variables and the error terms. Thus, Hausman tests for endogeneity [10] are specified for the entire sample and for each particular emerging market ETF. For six of the ETFs, the null hypothesis of endogeneity is rejected at the 1% level. For the general Asian markets ETFs, the null hypothesis of endogeneity is rejected at the 10% level (p-value of 0.068). However, the null hypothesis cannot be rejected for the general Latin American ETFs and the ETFs from the Middle East and Africa. The low sample sizes for these two sectors (in total, 27 of the 351 funds in the sample) may contribute to this result, but it does not seem significant enough to affect the remaining empirical results of the study.
In order to confirm these results, the regressions for Equation 1 are repeated replacing the monthly return regressor with the absolute value of monthly returns to generate new coefficient estimates for β1. The results of these estimations are contained in Panel B of Table 4. As is evident from the large positive coefficients for β1, these results are stronger than those using raw returns. The coefficient values are greater than those in Panel A, and signs of these coefficients have switched to being positive. This provides evidence that return volatility in either direction increases funds’ deviations from net asset value, and the β1 coefficients across the regional ETFs similar in magnitude to each other, as seen in Panel A. The results for fund age are similar to those from Panel A, and the explanatory power of the models (R2) has increased significantly for each of the fund groups.
The positive relationship between volume and volatility is documented extensively in the literature. Karpoff (1987) [13] provides a survey of early work in this area, and there is a voluminous literature that follows. See, for example, Jones, Kaul, and Lipson (1994) [12], Chordia, Roll, and Subrahmanyam (2002) [7], Wee and Yang (2012) [28], and Krause et al., (2014) [15], just to name a few representative studies. Although it is mentioned earlier that turnover in the individual regional ETFs is not a significant driver of ADNAV, a rough proxy for global financial market volume is provided by the S&P 500 Index ETF (SPY). The CRSP database provides monthly trading volume and closing price levels for SPY, and these are multiplied together to provide a rough proxy for trading activity (turnover). The variable in use is actually the natural log of this number given its large magnitude. Using this proxy, Equation 1 is modified as follows:
ADNAVi,t = α+β1 RETi,t + β2 AGEi,t + β2 VLMi,t + εi,t ----- (2)
where VLM represents the natural log of monthly SPY turnover. In Panel C of Table 4, the results of these estimations are provided. As expected, the signs and magnitudes of the coefficients for monthly returns and fund age are similar to those in Panel A of Table 4. The coefficients for SPY volume are uniformly positive and significant, as expected. Greater volume in this security, which is a proxy for overall global equity market volume, leads to greater volatility, and therefore greater absolute deviations from net asset value. While this observation is intuitive and confirmatory of many prior studies, the focus of this analysis is on those variables that reduce deviations from net asset value for the ETFs, and therefore contribute to market efficiency. Thus, the rest of the study will focus on monthly returns and fund age as the dependent variables in the analysis of deviations from net asset value.
In order to further examine theeffects of the baseline analysis in Panel A of Table 4, Table 5 presents the results of panel data regressions with the sample divided approximately in half, in order to examine these effects over time. Panel A includes observations from the start of the sample on 6/30/06 until 6/28/13, while Panel B examines the period thereafter until its conclusion on 12/29/17). The results are similar to those in Table 4, although it is clear that these effects have decreased over time, and presumably due to increases in market efficiency. The coefficients for all of the funds declined significantly (roughly by half, in absolute value), indicating increased market efficiency in the presence of negative returns. The largest remaining coefficients in Panel B are seen in the Middle Eastern and BRIC country funds, which is consistent with the fact that they are the two “youngest” funds in the sample. These funds evolved during more recent years and should benefit from increased market efficiency over time. The coefficients for fund age are all negative and statistically significant. It seems that most funds mature at a similar pace (in terms becoming more efficient to correctly price ETFs), whether they are in emerging or developing markets.
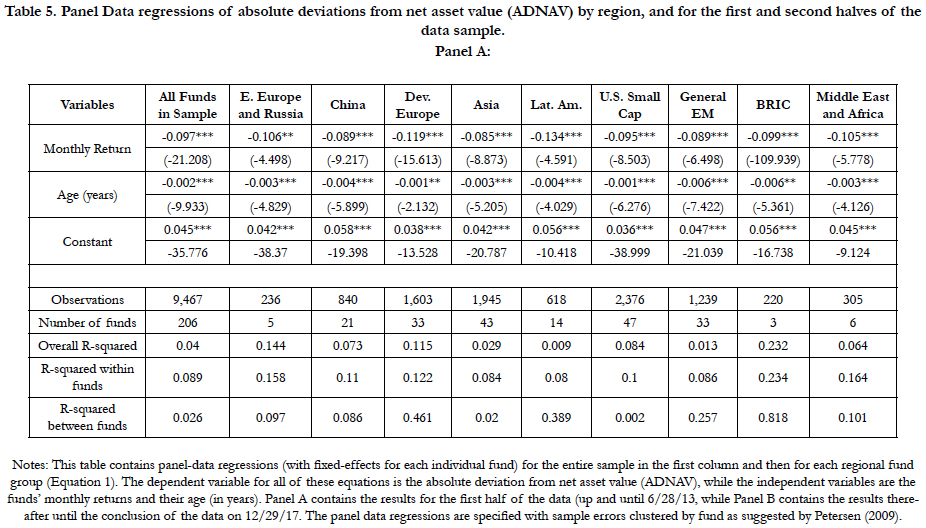
Table 5. Panel Data regressions of absolute deviations from net asset value (ADNAV) by region, and for the first and second halves of the data sample. Panel A:
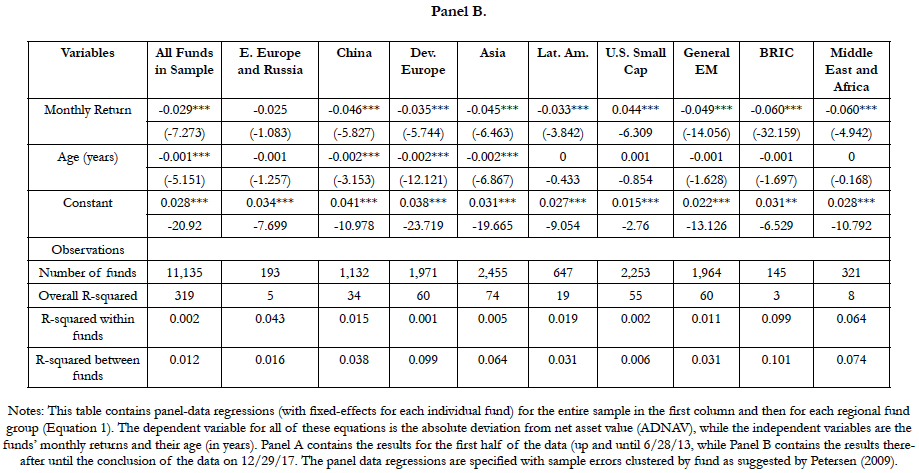
Table 5. Panel B.
Gleason et. al., (2004) [8] demonstrate that ETF investors behave differently in their reaction to news in “up markets” and “down markets.” Thanakijsombat and Kongtoranin (2018) [26] provide additional evidence on the sensitivity of these ETFs to downside risk. Thus, Table 6 separates the sample into firm-months where there is a positive deviation from NAV (ETF price > NAV, noted as DNAVP) and where there is a negative deviation from NAV (ETF price < NAV, noted as DNAVN). In the first row of Panel A of Table 6, it seems that positive monthly return months do not significantly affect DNAVP in any of the emerging financial markets. However, the negative and significant coefficients observed for the fund age variable in Tables 4 and 5 are still present for almost all of the funds in the sample, although their values have diminished significantly. This result indicates that the asymmetric volatility effect still remains important in today’s markets.
However, the most important result of this study is found in Panel B of Table 6, where strong positive coefficients for monthly returns are observed for several of the emerging markets. This seems counter-intuitive given the negative coefficient results of Tables 4 and 5, but the dependent variable (negative deviation from net asset value, DNAVN) is always a negative number, so the positive coefficients indicate that in months of positive return, the deviation is less negative, indicating a reduction in the absolute value of deviations from NAV (ADNAV). Conversely, negative monthly returns increase the negative deviation from NAV. Similarly, the coefficients for fund age switch signs in this analysis but that also indicates an increase in market efficiency, because as age rises, negative deviations from NAV become less negative (i.e. closer to NAV). Both of these results are explained in part by the asymmetric volatility phenomenon but may also be affected by the “limits to arbitrage” theory of Shleifer and Vishny (1997) [21]. They propose that limits to short-selling may prevent securities from reverting to their fundamental value. This contention is supported by Chang et al., (2014) [6], who find that “intensified short-selling activities are associated with improved price efficiency” (p. 411). In the present analysis, a negative deviation to NAV would need to be corrected via arbitrage through market participants buying the ETF and simultaneously shorting the underlying basket of securities. In emerging (and some developed) markets, it may be difficult, if not impossible, to borrow the requisite number of shares to sell short and effectuate both sides of this arbitrage. Therefore, deviations from NAV may only be corrected over a longer than monthly period of time.
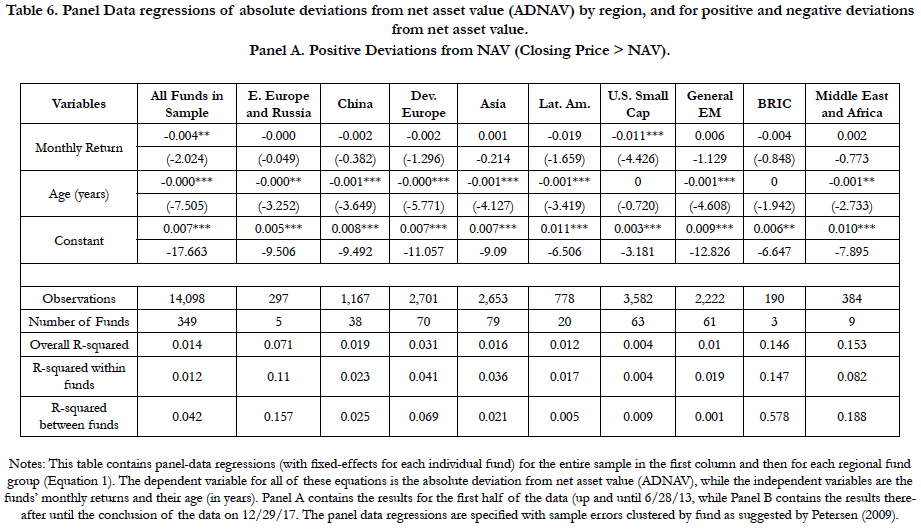
Table 6. Panel Data regressions of absolute deviations from net asset value (ADNAV) by region, and for positive and negative deviations from net asset value. Panel A. Positive Deviations from NAV (Closing Price > NAV).
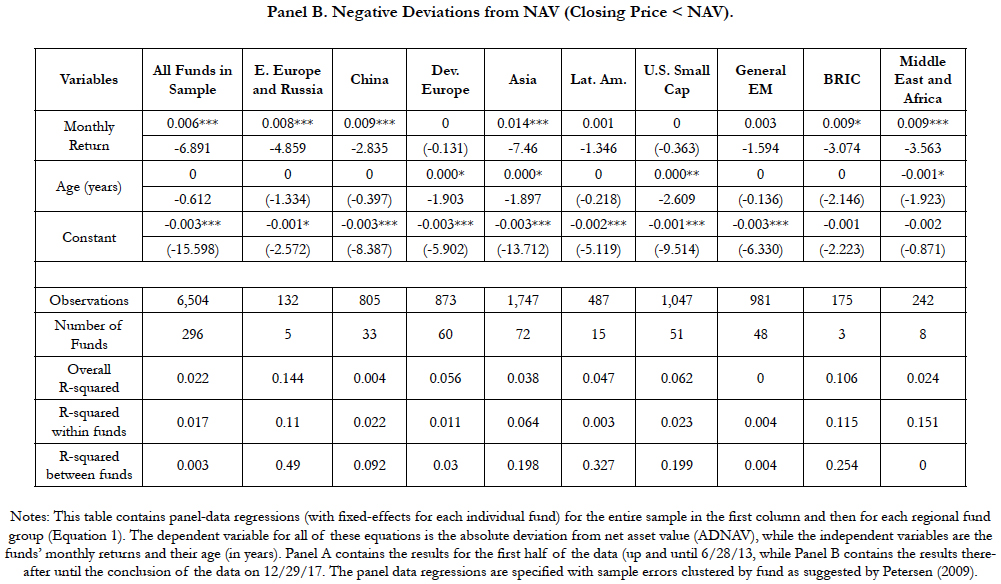
Table 6. Panel B. Negative Deviations from NAV (Closing Price < NAV).
While the results of the prior analysis are fairly straightforward, two additional tests of robustness in order to see if additional explanatory information can be gleaned from the data. In order to further examine the data with regard to asymmetric volatility, the data are divided into subsets based on months of positive and negative returns to examine their differential effects on ADNAV. Table 7 presents the results of this analysis. As indicated in Panel A of Table 7, positive monthly returns are associated with significant positive deviations from NAV (NAV lags ETF value), while negative returns are associated with significant negative deviations from NAV (ETF lags NAV). The converse confirmatory results are presented in Panel B of Table 7. Fund age continues to be associated with lower deviations from NAV under both conditions.
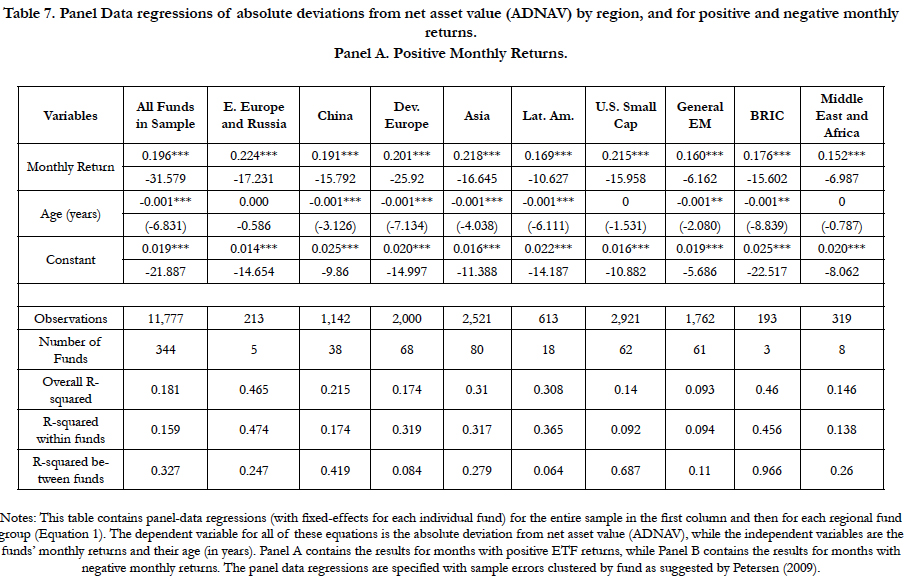
Table 7. Panel Data regressions of absolute deviations from net asset value (ADNAV) by region, and for positive and negative monthly returns. Panel A. Positive Monthly Returns.
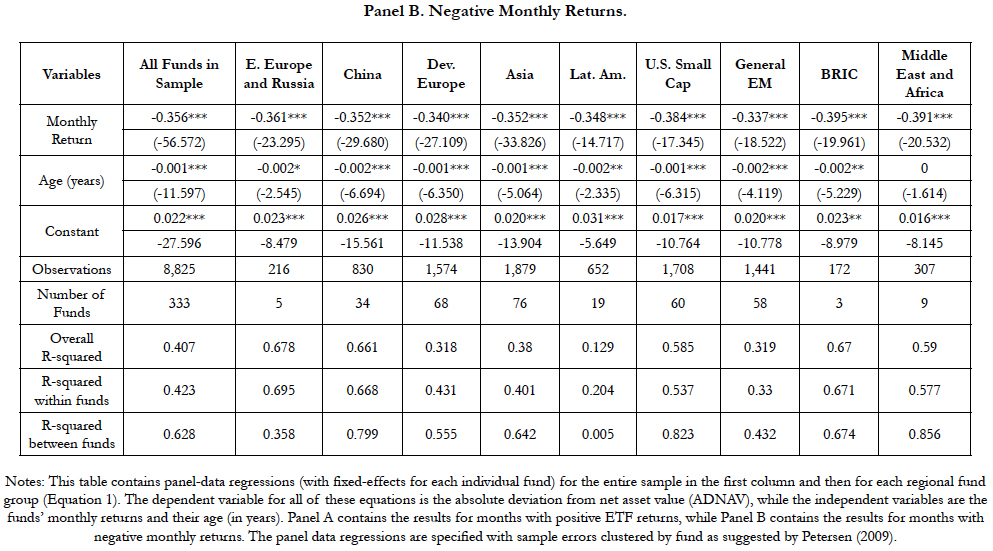
Table 7. Panel B. Negative Monthly Returns.
Conclusion
ETFs in emerging markets are subject to similar market forces as in developed markets, since they all experience significantly larger absolute deviations from net asset value during periods of negative returns. Almost all of the developed and emerging markets become significantly more efficient over time, and the results of this study indicate that negative monthly returns are the most important factor in determining negative deviations from net asset value for ETFs in these markets while fund age has a marginal effect. These results are most likely related to the inability of market participants to short sell individual equities in both emerging and developed markets. Policymakers and regulators in emerging markets may consider these results when considering policies that make their financial markets more efficient. The study also confirms the well-documented positive volume-volatility relations, and the results of the study are confirmed by several tests of robustness.
References
- Angel JJ, Broms TJ, Gastineau GL. ETF transaction costs are often higher than investors realize. The Journal of Portfolio Management. 2016;42(3):65- 75.
- Badshah IU. Volatility spillover from the fear index to developed and emerging markets. Emerging Markets Finance and Trade. 2018;54(1):27-40.
- Ben‐David I, Franzoni F, Moussawi R. Do ETFs increase volatility?. The Journal of Finance. 2018 Dec;73(6):2471-535.
- Blitz D, Huij J. Evaluating the performance of global emerging markets equity exchange-traded funds. Emerging Markets Review. 2012;13(2):149-58.
- Brzeszczyński J, Gajdka J, Kutan AM. Investor response to public news, sentiment and institutional trading in emerging markets: A review. International Review of Economics & Finance. 2015;40:338-52.
- Chang EC, Luo Y, Ren J. Short-selling, margin-trading, and price efficiency: Evidence from the Chinese market. Journal of Banking & Finance. 2014;48:411-24.
- Chorida T, Roll R, Subrahmanyam A. Order imbalance, liquidity, and market returns. Journal of Financial Economics. 2002;65:111-30.
- Gleason KC, Mathur I, Peterson MA. Analysis of intraday herding behavior among the sector ETFs. Journal of Empirical Finance. 2004;11(5):681-94.
- Gorton G, Pennacchi G. Security baskets and index-linked securities. National Bureau of Economic Research; 1991.
- Hausman JA. Specification tests in econometrics. Econometrica: Journal of the econometric society. 1978:1251-71.
- Hougan M. Expense Ratios Don't Matter (That Much) in ETFs. Journal of Financial Planning. 2014;27(2):34.
- Jones CM, Kaul G, Lipson ML. Transactions, volume, and volatility. The Review of Financial Studies. 1994;7(4):631-51.
- Karpoff JM. The relation between price changes and trading volume: A survey. Journal of Financial and quantitative Analysis. 1987;22(1):109-26.
- Kearney C. Emerging markets research: Trends, issues and future directions. Emerging Markets Review. 2012;13(2):159-83.
- Krause T, Ehsani S, Lien D. Exchange-traded funds, liquidity and volatility. Applied Financial Economics. 2014;24(24):1617-30.
- Krause TA, Tse Y. International Equity Index and Currency Futures: Commodity Currencies or Emerging Versus Developed Markets?. Emerging Markets Finance and Trade. 2018 Nov 14;54(14):3294-311.
- Madhavan A. Exchange-Traded Funds: an overview of institutions, trading, and impacts. Annu. Rev. Financ. Econ.. 2014;6(1):311-41.
- Petersen MA. Estimating standard errors in finance panel data sets: Comparing approaches. The Review of Financial Studies. 2009;22(1):435-80.
- Rompotis GG. Evaluating the weak-form efficiency of emerging markets ETFs. Aestimatio: The IEB International Journal of Finance. 2017(14):2-7.
- Sarwar G, Khan W. The effect of US stock market uncertainty on emerging market returns. Emerging Markets Finance and Trade. 2017;53(8):1796- 811.
- Shleifer A, Vishny RW. The limits of arbitrage. The Journal of finance. 1997 Mar;52(1):35-55.
- Shriber T. Emerging Market ETF Ideas For 2018. (Benzinga, 2017, December 19). Retrieved March 1, 2018. Available, from https://www.benzinga. com/analyst-ratings/analyst-color/17/12/10930767/emerging-market-etfideas-for-2018.
- Subrahmanyam A. A theory of trading in stock index futures. The Review of Financial Studies.1991;4(1):17-51.
- Tang H, Xu XE. Tracking Performance of the United States-Listed China Real Estate ETF. Chinese Economy. 2013;46(5):5-35.
- Huang TC, Wang KY. Investors’ Fear and Herding Behavior: Evidence from the Taiwan Stock Market. Emerging Markets Finance and Trade. 2017;53(10):2259-78.
- Thanakijsombat T, Kongtoranin T. Performance and diversification benefits of foreign-equity ETFs in emerging markets. Applied Economics Letters. 2018 Jan 19;25(2):125-9.
- Tully K. Securities Lending in Emerging Markets. (Global Finance, 2013, February 3). Retrieved May 1, 2018, from https://www.gfmag.com/magazine/ february-2013/securities-lending-in-emerging-markets.
- Wee M, Yang JW. Order size, order imbalance and the volatility–volume relation in a bull versus a bear market. Accounting & Finance. 2012;52(1):145- 63.
- Yavas BF, Rezayat F. Country ETF returns and volatility spillovers in emerging stock markets, Europe and USA. International Journal of Emerging Markets. 2016;11(3):419-37.


