Evaluation of Mixed-Dentition Employing Three Different Methods: Plaster, Digital, CBCT and Directly Measurements of Non-Erupted Permanent Teeth in CBCT
Rossi RC1*, Rossi NJ2, Rossi NC2, Fujita RR3, Nagata Pignatari SS3
1 Division of Paediatric Otolaryngology, Federal University of Sao Paulo - UNIFESP SP, Brazil.
2 Professor of Postgraduate of Orthodontics, Noth of Minas Foundation - FUNORTE, Brazil.
3 Associate Professor, Division of Pediatric Otolaryngology, Department of Otolaryngology and Head and Neck Surgery, Federal University of Sao
Paulo- UNIFESP, Brazil.
*Corresponding Author
Rosa Carrieri Rossi,
Division of Paediatric Otolaryngology,
Federal University of Sao Paulo - UNIFESP SP,
Brazil.
Tel: 5511981362383
E-mail: rosacrossi@gmail.com
Received: January 27, 2016; Accepted: February 13, 2016; Published: February 16, 2016
Citation: Rossi RC et al., (2016) Evaluation of Mixed-Dentition Employing Three Different Methods: Plaster, Digital, CBCT and Directly Measurements of Non-Erupted Permanent Teeth in CBCT. Int J Dentistry Oral Sci. S4:003, 15-21.DOI : dx.doi.org/10.19070/2377-8075-SI04003
Copyright: Rossi RC© 2016. This is an open-access article distributed under the terms of the Creative Commons Attribution License, which permits unrestricted use, distribution and reproduction in any medium, provided the original author and source are credited.
Abstract
This study was to evaluate the Moyers method for mixed-dentition, in dental plaster models (DP), dental digital (DD), in dental tomography models (DT) generated using Cone-beam computer tomography (CBCT) with the possibility to measure directly unerupted permanent teeth with assessing the diameter of intra-osseous (DPDT), and compare the results with those.
Material and Methods: The sample consisted of 20 healthy children, 9, 5 years, with mixed dentitions. The measurements were performed on DP, DD, DT, DPDT, using the reference of Moyers analysis with 75% and 95% error probability.
Results: We obtained significant differences between most measures, although they correlated and reliability demonstrating that the measures were related and could be used clinically, (p-value < 0.005 and p-value <0.016 , in Manova e Bartlett test and 95% intervals of Bonferroni reliability for standard deviations to Moyers 75% and 95%, respectively). There is a significant association in the average for discrepancies between DP and DD (p<0.0018), DP and DT (p<0.031) , DP and SDPT (p<0.04). There was a positive Pearson correlation between DP and DD (0.694533), DP and DT (0.603836), DP and SDPT (0.602709) and DT and SDPT (0.998076).
Conclusion: DP and DT can be used with the parameters of Moyers analysis with 75% and 95% probability of error. There were significant differences between DP and DD, and DT and DPDT. For the application of analysis Moyers 75%, the differences between techniques was positive, and that within the orthodontic planning could not be clinical difference.
2.Abbreviations
3.Introduction
4.Material and Methods
5.Results
6.Discussion
7.Conclusion
8.References
Keywords
CBCT; Moyers Analysis; Study Plaster Models; Digital Models.
Abbreviations
Dental plaster models = DP; Dental digital models = DD; Dental tomography models = Abbreviations; Cone-beam
computer tomography = CTCB; Clinical measurements = DC; Diameter of intra-osseous permanent = DPDT; Upper Airway = UA; American Board of Orthodontics = ABO; Digital Imaging and Communications in Medicine = DICOM; Discrepancies in superior right arch = DSR; Discrepancies in superior left arch = DSl; Discrepancies in inferior right arch = DIR; Discrepancies in inferior left arch = DIL; Confidence Interval = CI; Standart Deviations = SD.
Introduction
The orthodontic planning is critical to achieving an effective and stable orthodontic treatment. Each patient of growth phase requires knowledge of specific techniques to the treatment plan. The biggest challenge in mixed dentition is to predict as are the conditions for the permanent dentition. In cases of unfavorable forecasts, we must devise strategies for a better result. The Moyers analysis is a tool that helps us to predict how this phase will be. It was designed based on data obtained from an unspecified number of US white children. This method calculates the mesiodistal width of the tooth not erupted, with estimated 75% accuracy, from the size of the tooth have erupted in the mixed dentition to calculate the space needed for the alignment of permanent tooth [1-6].
In the past, the dental plaster (DP) was the options for the analysis of mixed dentition. Dental digitalized (DD) has been a new proposal for orthodontic planning to be easy to get the measurements of the teeth and have greater ease in storage. New technologies in the scanning process have improved the DD technique including laser scanning, holographic scanning and stereophotogrammetry imaging captures making this method more reliable [3-16]. Recent studies have compared the measurements obtained by Moyers analysis on DP compared to DD [3, 6], to investigate the equivalence of these methods. Most of the studies showed no significant differences between then [7- 14] with the exception of only one study [15].
Furthermore, images obtained in computed tomography cone beam (CTBC) as Digital Imaging and Communications in Medicine (DICOM) or i-CA software, has been used to generate 3D models (DT) giving us the possibility to perform direct analysis of the dentition by accessing the diameter of the erupted teeth and teeth still intra bone, facilitating the calculation of the necessary space to align the tooth [1, 17].
We can get directly from the 3D image, the mesial distal diameter of the teeth have not erupted [18-21]. Studies have been developed assessing the equivalence of Moyers analysis results to DP and compared with DD and DT making possible the Moyers analysis on different study models [22-27], but the feasibility of using only the models generated by 3D technique for orthodontic planning has not been tested.
The 3D image is more reliable than 2D to evaluate all of the neck and head structures, and upper airway, and can be useful for many professionals. The FDA indicates this test only mode for evaluation of disease in children. The CBCT is a type of 3D examination exposing the child to a lower ionizing radiation compared with multislice scanner, but higher than one RX 2D, but the collective dose of all 2D radiographs generally recommended by the orthodontist is equal to or slightly larger than just a CBCT examination, which can provide all the necessary information to orthodontic plan [28, 29].
The aim of the study was to identify the differences between three different models of mixed-dentition measurements according to Moyer’s analysis: 1 Plaster, 2 Digital, 3 CBCT and proposed assessing the intra-osseous diameter of non-erupted permanent teeth with CBCT.
Material and Methods
This clinical study was approved by the Institutional Ethics Committee under the number of: 1739/11 02/12/2011, granted by the Research Foundation - FAPESP under the Protocol 2012 / 15715-2 November 2, 2012.
The study sample consisted of 20 healthy children, of both genders, mean age 9, 5 years old, with mixed-dentition without caries, restorations, loss of interproximal enamel, or coronal fractures. Patients whose legal guardians did not sign the informed consent, were excluded.
All patients underwent orthodontic records with equal parameters: DP build for alginate impressions, DD scanned with a structuredlight 3D scanner (Maestro 3D Desktop Scanner; AGE Solutions, Pontedera, Italy) with 10-μm readability from the DP, and DT and DPDT were by CTBC. The CBCT exams were requested by an otolaryngologist in order to evaluate the upper airway. The DICOM file format of DT were imported from CBCT, (I-Cat, tomography images by using OsiriX, Advanced Image in 3D software). The 3D scans were also obtained in conjunction with otolaryngologists for verification of the upper airways (UA).
In three study models, (DP, DD, DT) was calculated the space required for alignment of permanent teeth through the Moyer`s analysis [1] with reliability of 75% and 95%. The DP measurements were obtained using a digital caliper with an accuracy of 0.02 mm and 0.01 mm repeatability (Starrett, Itu, SP, Brazil), Figure 1. The DD measurements were accomplished with the Maestro tool Ortho Studio, as shown in Figure 2. The DT measurements were performed with the software tools OsiriX in the three orthogonal planes, as shown in Figure 3 and 4.
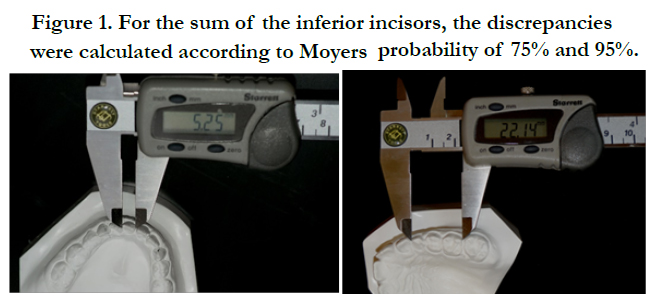
Figure 1. For the sum of the inferior incisors, the discrepancies were calculated according to Moyers probability of 75% and 95%.
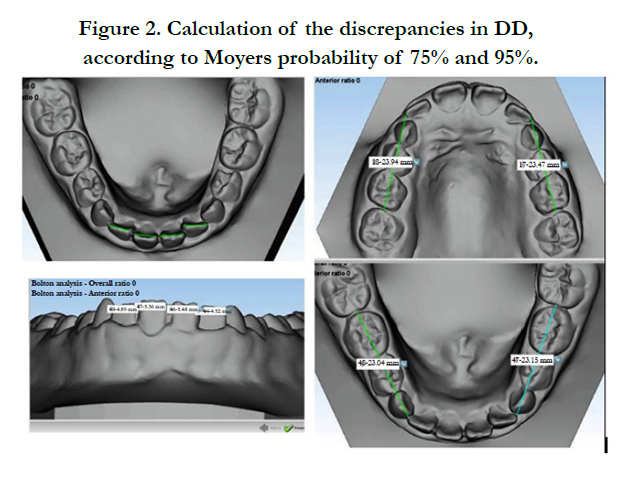
Figure 2. Calculation of the discrepancies in DD, according to Moyers probability of 75% and 95%.
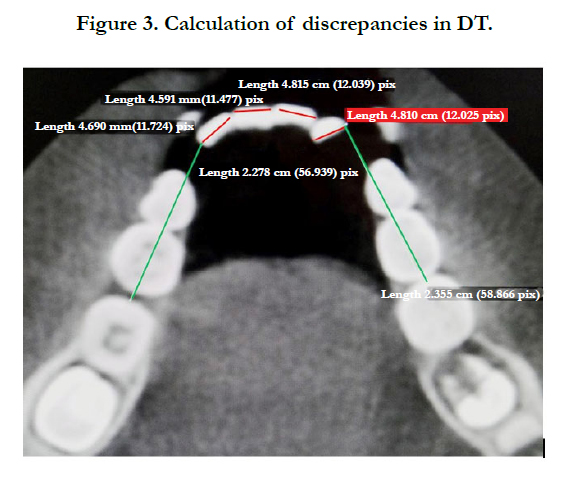
Figure 3. Calculation of discrepancies in DT.
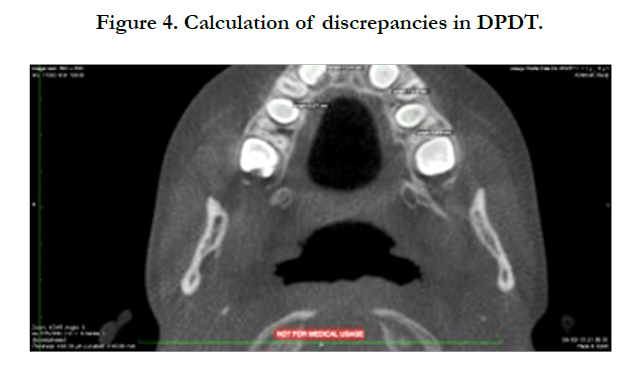
Figure 4. Calculation of discrepancies in DPDT.
In the fourth method (DPDT), the discrepancy model was evaluated by measuring directly the canine and pre molars teeth not erupted in the image generated by CBCT and rendered by Osirix program, and this measurements were compared with clinical measurements, made directly into the patient's mouth (DC) (Figure 4). To verify the reality and clinical reliability of the DPDT measures, thirty-eight related permanent teeth that erupted during the study were measured directly inside the mouth of the patient and these measurements (DC) were compared with measurements of intra-osseous teeth in 3D (DPDT). Direct measurements were performed with a compass and a millimeter ruler. Figure 5.
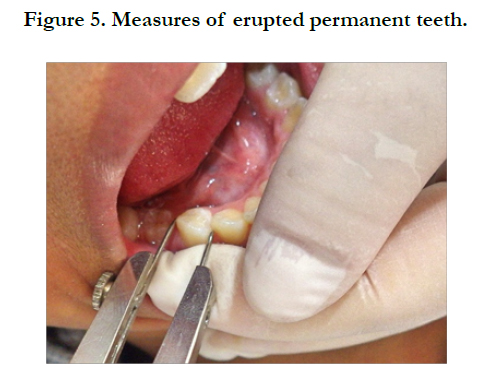
Figure 5. Measures of erupted permanent teeth.
According to the Moyers method, were calculated the mesiodistal width of four permanent lower incisors, and the distance between the distal of the lateral incisor and mesial of the first permanent molar in each half dental arch.Thus measurements were obtained, superior right arch (DSR), superior left arch (DSL), inferior right arch (DIR) and inferior left arch (DDL).
The Student's t-test was used to verify the accuracy and reliability.
In DPDT the difference was calculated by measurements obtained directly from non-erupted teeth in 3D image, (DPDT) as required space (RS). The means of the discrepancies were calculated for each dental arch of 20 children for statistical associations.
Three experienced orthodontists performed the measuring five times in an interval of ten days to access the level of agreement of the measures. The data were analyzed using descriptive analysis for comparison among all measurements, by using Excel 2007 program and Minitab software 17. To verify the normality to each variable, Kolmogorov-Smirnov Test (KS) was applied. Means and standard deviation (SD), and confidence interval (CI) of the data were compared by using T Student test and Bonferroni tests for multiple comparisons. To verify the equality of the means of the four types of analysis of dentition, MANOVA was used, with 95% of confidence. Null hypothesis, “All variances are equal”. Alternative hypothesis,” At least one variance is different”. Significance level α = 0.05. Bartlett's method was used for normal data.
Results
In the table 1, we can see the variance, SD and CI (t) of the averages discrepancies according to Moyers analysis (DP, DD, DT) and directly measurements in CBCT (DPDT).
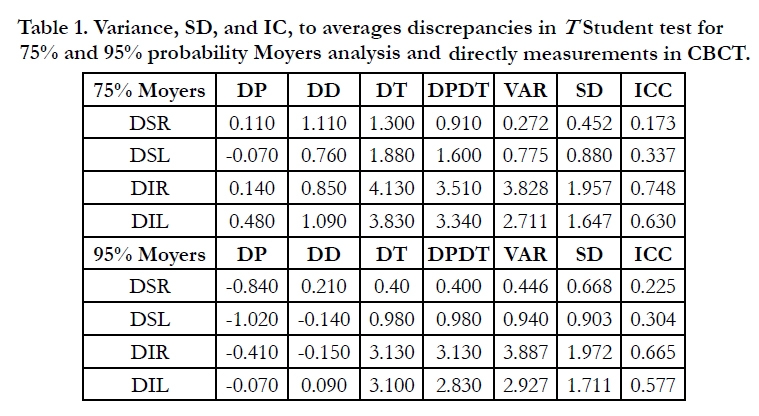

Table 1. Variance, SD, and IC, to averages discrepancies in T Student test for 75% and 95% probability Moyers analysis and directly measurements in CBCT.
The greatest differences were found between measurements obtained with the methods generated by Plaster models (DP and DD) and the 3D image (DT and DPDT). We encounter the largest differences (+3.99 mm) between DP and DT in Moyer’s 75%, and +3.54mm between DP and DT mm in 95% error probability. The minor differences were observed between DD and DPDT (+3.28mm), both for 75% and 95%. Measures generated by CTCB were greater than the cast models.
In table 2, and figure 6, Bartlett's test, applied to check the level of reliability of the data for Moyers analysis with probability 75%, showed that variable is not an identity matrix (p<0.005) with Individual Confidence level = 98.75%, demonstrating that the data is suitable for this method allowing the rejection of the null hypothesis.
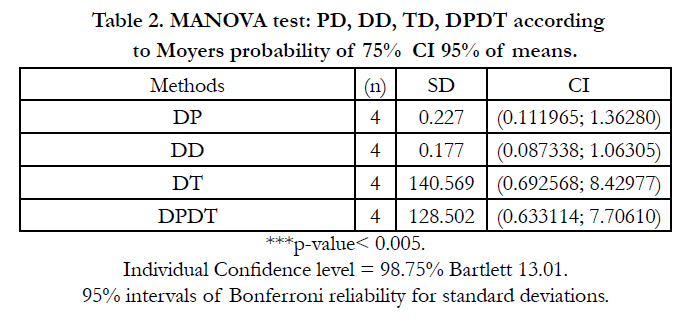
Table 2. MANOVA test: PD, DD, TD, DPDT according to Moyers probability of 75% CI 95% of means.
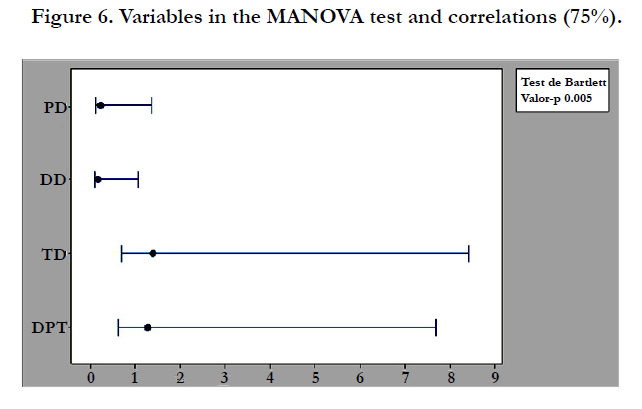
Figure 6. Variables in the MANOVA test and correlations (75%).
In table 3, and Figure 7, Bartlett's tests for Moyer´s analysis, with probability 95%, demonstrated that the original correlation matrix is not an identity matrix (p<0.016) with Individual Confidence level = 98.75%, allowing correlation among the variables included in the analysis, and showing that there was a significant intraexaminer difference.
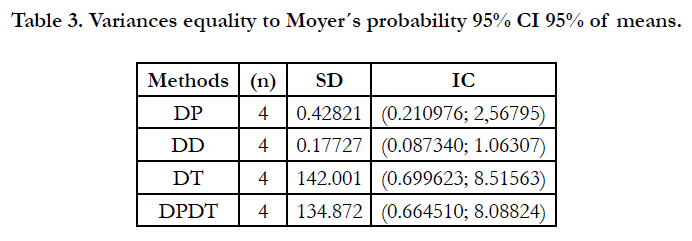
Table 3. Variances equality to Moyer´s probability 95% CI 95% of means.
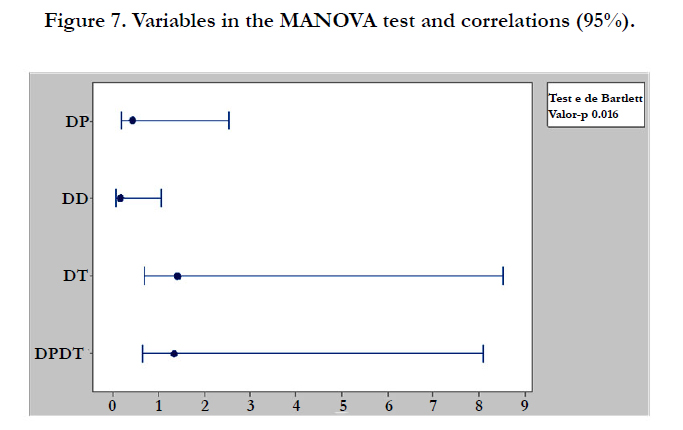
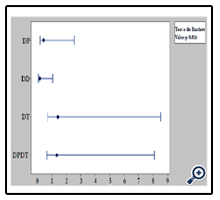
Figure 7. Variables in the MANOVA test and correlations (95%).
Student’s and Pearson correlation tests were applied to verify the degree of association between the averages of the pairs of methods. The results can be seen in Table 4.
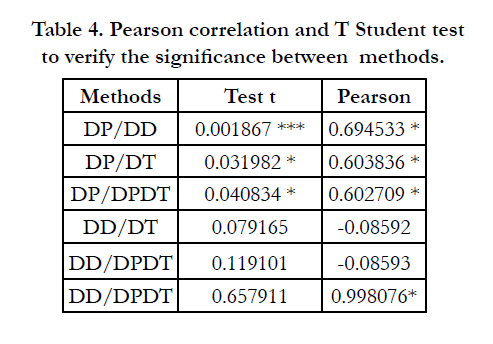
Table 4. Pearson correlation and T Student test to verify the significance between methods.
In table 4 the results show that there was a significant association in the average for discrepancies between DP and DD models (p<0.0018), and between DP and DT measurements (p<0.031), DP and DPDT (p<0.04). There was a positive Pearson correlation of DP and DD measures (0.694533), DP and DT (0.603836), DP and DPDT (0.602709) and tomographic and DPDT (0.998076) .
A significant association (p<0.000000007) was observed when comparing the measurements generated directly by the images of the non-erupted teeth (DPDT) and the measurements obtained directly from the mouth of patients, once these teeth were already erupted (DC). Clinically the discrepancy obtained between (DPDT) and the DC was 0.87 mm, with a positive correlation (Pearson = 0.42). This can be seen in table 5 and figure 8.
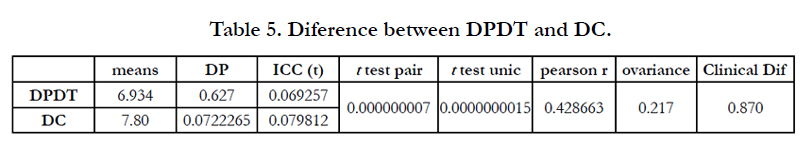
Table 5. Diference between DPDT and DC.
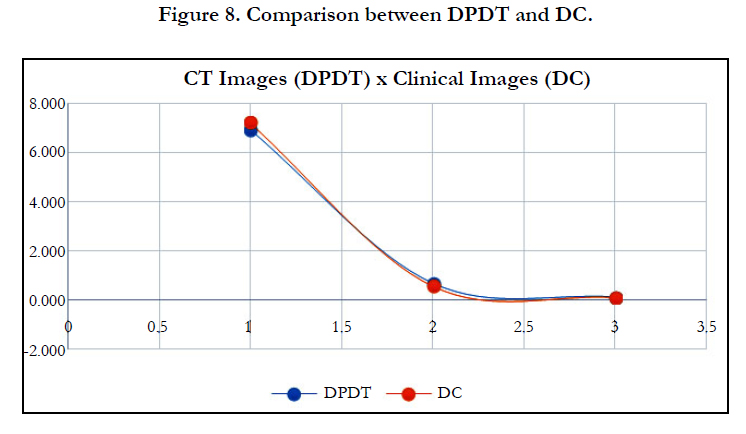
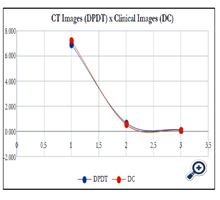
Figure 8. Comparison between DPDT and DC.
Discussion
Moyers analysis is a tool used for the mixed dentition analysis, but new methods cannot be dismissed as a facilitator in orthodontic diagnosis [1-3, 27]. Important clinical interferences such as recovery and maintenance may be required and this information is in the mixed dentition. New technologies are resources that can facilitate and improve this task and should be tested [7, 9, 15, 18,20-28].
With this in mind, many authors have compared the dentition analysis results in new forms of orthodontic examinations to establish whether they are reliable in orthodontic planning and cost benefit [4-21].
Some authors compared the measurements made in plaster models in respect of the scanning models [4-14], Others compared the measurements made in plaster models in respect to the TCCB [19, 22, 23], and a few compared the three techniques [24, 25, 27].
CBCT is an important diagnostic tool in dentistry [18], but it is not a routine procedure in orthodontic planning due to ionizing radiation emitted mainly in examinations that cover the entire head and should be used when the 2D conventional tests used in orthodontics planning fail to answer diagnostic doubts. For diagnosis and orthodontic planning, the 2D tests used include panoramic RX, lateral Rx and a series of all mouth. The individual dose emitted by the unique 2D test is low, but the collective dose is significantly equal to or slightly greater than the 3D examination [17, 18].
Some patients are referred to the orthodontist already with a CTBCs exam in hand, in hopes of avoiding other radiographic exams. In such cases the orthodontist must be prepared to carry out the treatment plan following the new diagnostic tools. 2D exams, plaster and scanned models may be substituted by only one examination CBCT. The prediction of the spaces for nonerupted teeth can be obtained through the measurement of the 3D (DPDT), where the spaces for the non-erupted teeth can be obtained with enough accuracy [10, 12, 17, 18].
We compared the three forms of measurements and proposed a method of measurement directly of the non-erupted teeth obtained directly from CBCT. That was possible because our patients had been referred from the oral breathers clinic, presenting with sleep apnea or not, already submitted to CBCT exams.
Similarly to other studies, we found significant differences between the techniques based on impressions in alginate, (DP, DD) and those based on images generated by computed tomography, (DTD, PDT) [4-6, 8-11, 13, 14]. DP and DD showed significantly similar results, as well as DT and DPDT [24, 25, 27]. The difference between these pairs of methods was almost 4mm and it is a borderline clinical situation where the recovery of the space should be well analyzed [12-14]. The difference may be by the steps required to obtain the plaster study models from the impression. These many steps could occasionally alter the values of the teeth dimensions.
Digital models are generated by scanning plaster models and are able to produce a clear picture of the plaster model, and carry with them all the errors that may have been generated from the molding phase to the final manufacture of the plaster models, but in the Moyers analysis these errors are considered to be in the 25% error margin [1].
Clinical measurements of the canines and pre-molars, made directly inside the mouth, showed a significant association with the DPDT outcome, with an insignificant clinical difference of 0.87mm. This results confirm that the forth method (DPDT) can be used to evaluate the space required for the dental alignment representing a positive benefit in terms of cost. We must consider it as an option. The plaster model (DP) involves spending excess time, requires proper storage areas, and presents a high risk of rupture, making its transportation very difficult when a multidisciplinary approach is considered [4, 7, 12, 15].
The modern tomographic images are believed to be reliable with a maximum of 1 degree or 1mm difference [15, 20, 21]. Thus, it can be used in both modalities, according to the needs and convenience of each patient. Measuring the radiographic width of non-erupted teeth is one of the methods used to predict the width of non-erupted teeth, but it is not possible in 2D due to the rotation of teeth or poor intraoral films. High quality films and a meticulous radiographic technique are essential for minimal error [15, 16].
New studies should standardize the difference in values.
Conclusion
- The Moyers analysis measurements obtained from CBCT showed significant differences when compared with those obtained from the plaster models and scanning models.
- The fourth proposed method generated by CBCT showed great accuracy in predicting the space required for noneruptedcanine and premolars.
Acknowledgments
We appreciate the support given by Research Foundation-APESP under the Protocol 2012/15715-2 November 2, 2012.
References
- Moyers RE (1988) Analysis of the dentition and occlusion. In Handbook of orthodontics. (4th edtn), Year Book Medical Publishers, Chicago. 235-238.
- Pancherz H, Schaffer C (1999) Individual-based prediction of the size of the supporting zones in the permanent dentition. A comparison of the Moyers method with a unitary prediction value. J Orofac Orthop 60(4): 227–235.
- Okunami TR, Kusnoto B, BeGole E, Evans CA, Sadowsky C, et al. (2007) Assessing the American Boar4d of Orthodontics objective grading system: digital vs plaster dental casts. Am J Orthod Dentofacial Orthop 131(1): 51-56.
- Costalos PA, Sarraf K, Cangialosi TJ, Efstratiadis S (2005) Evaluation of the accuracy of digital model analysis for the American Board of Orthodontics objective grading system for dental casts. Am J Orthod Dentofacial Orthop 128(5): 624-629.
- Stevens DR, Flores‐Mir C, Nebbe B, Raboud DW, Heo G, et al. (2006) Validity, reliability, and reproducibility of plaster vs digital study models: comparison of peer assessment rating and Bolton analysis and their constituent measurements. Am J Orthod Dentofacial Orthop 129(6): 794‐803.
- Quimby ML, Vig KW, Rashid RG, Firestone AR (2004) The accuracy and reliability of measurements made on computer‐based digital models. Angle Orthod 74(3): 298‐303.
- Nouri M, Abdi AH, Farzan A, Mokhtarpour F, Baghban AA (2014) Measurement of the buccolingual inclination of teeth: Manual technique vs 3-dimensional software. Am J Orthod Dentofacial Orthop 146(4): 522-529.
- Mullen SR, Martin CA, Ngan P, Gladwin M (2007) Accuracy of space analysis with emodels and plaster models. Am J Orthod Dentofacial Orthop 132(3): 346‐352.
- Favero L, Terrazzani C, Favero V, Stellini E, Cocilovo F (2009) Virtual studymodels: a comparison of modular application systems. Prog Orthod 10(2):16-25.
- Sjogren AP, Lindgren JE, Huggare JA (2010) Orthodontic study cast analysis- reproducibility of recordings and agreement between conventional and 3D virtual measurements. J Digit Imaging 23(4): 482-492.
- Reuschl RP, Heuer W, Stiesch M, Wenzel D, Dittmer MP (2015) Reliability and validity of measurements on digital study models and plaster models. Eur J Orthod.
- Tomassetti JJ, Taloumis LJ, Denny JM, Fischer JR Jr (2001) A comparison of 3 computerized Bolton tooth‐size analyses with a commonly used method. Angle Orthod 71(5): 351‐357.
- Santoro M, Galkin S, Teredesai M, Nicolay OF, Cangialosi TJ (2003) Comparison of measurements made on digital and plaster models. Am J Orthod Dentofacial Orthop 124(1): 101‐105.
- Luu NS, Mandich MA, Flores‐Mir C, El‐Bialy T, Heo G, et al. (2014) The validity, reliability, and time requirement of study model analysis using cone‐beam computed tomography–generated virtual study models. Orthod Craniofac Res 17(1): 14-26.
- Akyalcin S, Dyer DJ, English JD, Sar C (2013) Comparison of 3-dimensional dental models from different sources: Diagnostic accuracy and surface registration analysis. Am J Orthod Dentofacial Orthop 144(6): 831-837.
- Fleming PS, Marinho V, Johal A (2011) Orthodontic measurements on digital study models compared with plaster models: a systematic review. Orthod Craniofac Res 14(1): 1-16.
- Okano T, Sur J (2010) Radiation dose and protection in dentistry. Japanese Dent Sci Rev 46(2): 112-121.
- Silva MA, Wolf U, Heinicke F, Bumann A, Visser H, et al. (2008) Conebeam computed tomography for routine orthodontic treatment planning: a radiation dose evaluation. Am J Orthod Dentofacial Orthop 133(5): 640e1-5.
- Gamba TO, Oliveira ML, Flores IL, Cruz AD, Almeida SM, et al. (2014) Influence of cone-beam computed tomography image artifacts on the determination of dental arch measurements. Angle Orthod 84(2): 274-278.
- Lagravère MO, Carey J, Toogood RW, Major PW (2008) Three-dimensional accuracy of measurements made with software on cone-beam computed tomography images. Am J Orthod Dentofacial Orthop 134(1): 112-116.
- Ganguly R, Ruprecht A, Vincent S, Hellstein J, Timmons S, et al. (2011) Accuracy of linear measurement in the Galileos cone beam computed tomography under simulated clinical conditions. Dentomaxillofac Radiol 40(5): 299‐305.
- Periago DR, Scarfe WC, Moshiri M, Scheetz JP, Silveira AM, et al. (2008) Linear accuracy and reliability of cone beam CT derived 3‐dimensional images constructed using an orthodontic volumetric rendering program. Angle Orthod 78(3): 387‐395.
- Tarazona B, Llamas JM, Cibrian R, Gandia JL, Paredes V (2013) A comparison between dental measurements taken from CBCT models and those taken from a digital method. Eur J Orthod 35(1): 1-6.
- Kau CH, Littlefield J, Rainy N, Nguyen JT, Creed B (2010) Evaluation of CBCT digital models and traditional models using the Little's Index. Angle Orthod 80(3): 435-439.
- Kim J, Heo G, Lagravère MO (2014) Accuracy of laser-scanned models compared to plaster models and cone-beam computed tomography. Angle Orthod 84(3): 443-450.
- Luu NS, Nikolcheva LG, Retrouvey JM, Flores-Mir C, El-Bialy T, et al. (2012) Linear measurements using virtual study models. Angle Orthod 82(6): 1098-1106.
- Nguyen E, Boychuk D, Orellana M (2011) Accuracy of cone-beam computed tomography in predicting the diameter of unerupted teeth. Am J Orthod Dentofacial Orthop 140(2): e59-e66.
- Macchi A, Carrafiello G, Cacciafesta V, Norcini A (2006) Three‐dimensional digital modeling and setup. Am J Orthod Dentofacial Orthop 129(5): 605‐610.
- Hixon EH, Oldfather RE (1958) Estimation of the sizes of unerupted cuspid and bicuspid teeth. Angle Orthod 28(4): 236-240.


