Population Pharmacokinetic Analysis of Alcohol Concentration after Beer Consumption in Fasted Japanese Subjects
Nemoto A1*, Terada M2, Hayashi T3, Hamada C4, Matoba R3
1 Teikyo University School of Public Health, Tokyo, Japan.
2 School of Medical, Toho University, Tokyo, Japan.
3Osaka University School of Medicine, Osaka, Japan.
4 Tokyo University of Science, Tokyo, Japan.
*Corresponding Author
Asuka Nemoto,
Teikyo University School of Public Health,
Tokyo, 173-8605, Japan.
E-mail: anemoto@med.teikyo-u.ac.jp
Received: August 16, 2016; Accepted: September 07, 2016; Published: September 09, 2016
Citation: Nemoto A, Terada M, Hayashi T, Hamada C, Matoba R (2016) Population Pharmacokinetic Analysis of Alcohol Concentration after Beer Consumption in Fasted Japanese Subjects. Int J Clin Pharmacol Toxicol. 5(6), 225-230.DOI : dx.doi.org/10.19070/2167-910X-1600038
Copyright: Nemoto A© 2016. This is an open-access article distributed under the terms of the Creative Commons Attribution License, which permits unrestricted use, distribution and reproduction in any medium, provided the original author and source are credited.
Abstract
The absorption rate of alcohol is one of the determinants of the peak blood alcohol concentration. Studies focusing on factors that cause inter-individual variability in absorption rate have not been conducted. To conduct a population pharmacokinetic analysis to identify variables that explain inter-individual differences in the absorption rate of alcohol, using blood alcohol concentrations immediately after consumption of a low dose of alcohol under fasting conditions. The study enrolled 34 healthy Japanese subjects, consisting of 21 males and 13 females (mean age, 29.4±12.9 years; mean body weight, 61.3±10.8 kg). All subjects consumed a single 350 mL can of beer (17.5 g of alcohol) after an overnight fast: an average dose of 0.232 g of alcohol per kg of body weight. A total of 157 samples were collected from 5 to 60 min after consumption of alcohol. A one-compartment model was fitted as a base model. The estimates of the population mean absorption rate and the population mean apparent volume of distribution were 0.023 1/min and 48.3 L, respectively. Age was positively correlated to the individual absorption rate and negatively correlated to the individual apparent volume of distribution, and body weight and ADH1B genotype affected the apparent volume of distribution. The key finding of this study is that age was positively correlated with alcohol absorption rate, suggesting that aging cause higher peak BAC due to higher absorption rate combined with lower apparent volume of distribution.
2.Introduction
3.Materials and Method
3.1.Alcohol Drinking Experiment
3.2.Blood Alcohol Concentration (BAC) Analysis
3.3.Single nucleotide polymorphism (SNP) genotyping
3.4.Model Development
3.5.Model Validation
4.Results and Discussions
5.Conclusion
6.Acknowledgment & Declarations
7.References
Keywords
Population Pharmacokinetics; Pharmacogenomics; Blood Alcohol Concentrations; Alcohol Absorption Rate; ADH1B Polymorphism.
Introduction
Alcohol (ethanol) is one of the most popular psychoactive substances. Blood alcohol concentration (BAC) is affected by absorption, distribution and elimination. These processes are influenced by several factors, including age, gender, body weight, obesity state, genetic factors, fasting state, and beverage type [1, 2]. Because the rate of absorption of alcohol is faster than elimination, the rate of absorption is one of key determinants of peak BAC and the time of peak BAC [2-4].
Several studies have evaluated the population pharmacokinetics of alcohol using values converted from breath concentration measurements [5-8]. However, in these studies, the elimination process was mainly examined and factors related to inter-individual variability in BAC during the absorption phase have not been investigated. Because alcohol is mainly absorbed through the duodenum and small intestine, emptying of stomach contents into the duodenum via the pyloric sphincter plays a crucial role in determining the rate of alcohol uptake into the bloodstream [3,9, 10]. Therefore, the major factor governing the absorption rate of alcohol is whether the drink is consumed on an empty stomach (overnight fast) or with or after a meal [11, 12]. In this study, after overnight fasting to exclude the impact of food on stomach emptying, the factors that affect the process of alcohol absorption were investigated.
The objective of this study was to develop a population pharmacokinetic model to identify the key covariates that cause interindividual variability in the absorption rate of alcohol, using BAC directly measured at several time points from 5 to 60 min after the consumption of a single can of beer (17.5g of alcohol) in fasted Japanese subjects.
Materials and Method
This study enrolled 34 healthy Japanese subjects, including 21 males and 13 females, aged between 20 and 62 years old (mean: 29.4 ± 12.9 years) with a mean body weight of 61.3 ± 10.8 kg (Table 1). During screening by investigators, subjects with preexisting health conditions and/or requiring prescription drug use were excluded. All subjects were instructed to refrain from calorie intake for 12 h before the experiments. Over a period of 10 min, all subjects consumed a single can (350 mL) of beer (5% v/v) containing 14.0 g of pure alcohol or an average dose of 0.232 g of alcohol per kg of body weight. Blood samples were collected at 5, 10, 20, 30 and 60 min after completion of beer consumption, except for some subjects from whom blood samples were only obtained at 30 min. The study protocol was approved by the research ethics committee of the Faculty of Medicine, Osaka University, Japan. Written informed consent was provided by all participants.
The blood sample (1.0 mL) was transferred to a 13 mL screwcapped and silicon fluoride laminate packing, syringe vials, to which 1.0 mL 0.05% methyl ethyl ketone (internal standard). The sample was measured according to the headspace gas chromatographic (GC) method. GC analysis was carried out with a Shimazu GC-14A gas chromatograph equipped with flame ionization detector. The column was 1 m x 3 mm glass column packed with Chromosorb W 101 60-80 mesh (Shinwa Chemical Industries Ltd., Kyoto, Japan). The temperature of column, injection port and detector were 140°C, 200°C and 220°C, respectively. The calibration curve was obtained by plotting the peak area ratio of ethanol against the concentrations injected. The ethanol exhibited good linearity over the range of 0.001 to 0.6 g/L of blood. The equation and r value for the curve was y = 2.2426∙x-0.014, r²=0.9992. The quantitation limit of ethanol was 0.001 g/L.
The genotype of single nucleotide polymorphisms (SNPs) for ADH1B (Arg48His) and ALDH2 (Glu504Lys) was determined by a commercial laboratory (DNA Bank Retails, Shibuya, Tokyo, Japan). Subjects were requested to wash their mouth twice with water, and collect the exfoliated buccal epithelial cells by rubbing the inside of the cheek with a swab at least 10 times. Each swab was placed in a test tube filled with preservative buffer and samples were immediately posted at room temperature.
The base model was developed for a total of 157 BAC samples from 34 subjects using the first-order conditional estimation (FOCE) method in NONMEM version 7.3 software (ICON Clinical Research LLC, North Wales, PA, USA). ADVAN2 and TRANS2 subroutines were used. As a base model, data were fitted to a one-compartment model with linear elimination. Pharmacokinetic parameters estimated from the one-compartment model included the absorption rate constant (ka), the apparent volume of distribution (Vd/F), and the elimination rate constant (kel). Inter-individual variability in pharmacokinetic parameters was modeled by assuming a log-normal distribution, described as:
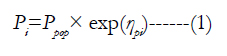
where Pi is the pharmacokinetic parameter of the ith individual which represents κai, Vd / Fi or κeli. ηpi is an inter-individual random effect normally distributed with a mean of 0 and variance of ωp², and Ppop is the population mean pharmacokinetic parameter which represents κa, Vd / F or κel. The residual variability was modeled with a proportional error structure, described as:
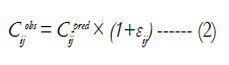
where Cij pred is the jth observation of the ith individual predicted by the pharmacokinetic model, Cij obs is the measured concentration, and εij represents the residual departure of the model from the jth observation from the ith individual. εij is a normally distributed random variable with a mean of 0 and variance of σ². All offdiagonals of the population covariance matrix were set to 0.
Starting from the base model, the final model was developed. To evaluate the influence of clinical characteristics on inter-individual variability in pharmacokinetic parameters, covariates were evaluated using objective function values (OFVs) determined using NONMEM. For comparisons between alternative models, a likelihood ratio test was used. The change in OFVs (ΔOFV) produced by the inclusion of a covariate approximates a χ² distribution with degrees of freedom (d.f.) equal to the difference in the number of parameters between models. Thus, ΔOFV< -3.84 represents a statistical significance at α=0.05 and ΔOFV< -6.63 represents a statistical significance at α=0.01 with the addition of one fixed effect.
The final model was constructed according to a four-step procedure, as described below:
Step 1: All covariate relations on pharmacokinetic parameters were tested using NONMEM for univariate analysis, starting from the base model. The covariate that caused the greatest decrease in OFV was retained in the model.
Step 2: All the remaining candidate covariates were tested in univariate NONMEM analysis, starting from the model determined in Step 1. The covariate that caused the greatest decrease in OFV was retained in the model.
Step 3: Step 2 was repeated, providing that OFV decreased by at least 3.84 (p < 0.05) for each additional covariate included in the model.
Step 4: The final model was constructed using backward deletion with a 0.01 significance level and ΔOFV < -6.63.
Covariates investigated for their influence on the pharmacokinetic parameters included continuous characteristics (age and body weight) and discrete characteristics (gender, and ADH1B and ALDH2 genotypes). Continuous variables were modeled and centered around each patient’s median value, expressed as:
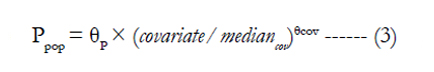
where θP is the typical pharmacokinetic parameter for the covariate equal median, and θcov is a covariate scale factor. Gender was modeled as a dichotomous variable using an indicator variable (IND) of 0 or 1 (i.e. male or female), expressed as:
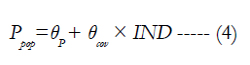
where θP is the population mean pharmacokinetic parameter value when IND = 0, and θcov is the change in the parameter value as a result of IND = 1. Initially, two SNPs were considered as categorical variables with three levels: ADH1B*1/*1, ADH1B*1/*2 and θADH1B*2/*2; and ALDH2*1/*1, ALDH2*1/*2 and ALDH2*2/*2. However, the subjects with only two ALDH2 genotypes ( ALDH2*1/*1 and ALDH2*1/*2) were included in this study. This was thought to be due to individuals with the ALDH2*1/*1 genotype tending to abstain from alcohol. With respect to ADH1B, because only one subject was genotyped as ADH1B*1/*1, only the effect between ADH1B*1/*2 (including one subject with ADH1B*1/*1) vs ADH1B*2/*2 was evaluated. Because there were only two categories for both genes, each gene was treated as a dichotomous variable. For ADH1B,0 indicates *1/*2, and 1 indicates *2/*2. For ALDH2, 0 indicates *1/*1, and 1 indicates *1/*2.
For model validation, the scatter plots of observed values (OBS) versus predicted values (PRED), OBS versus individual predicted values (IPRED), conditional weighted residuals (CWRES) versus PRED, and CWRES versus time, were included in the final model. To validate the predictive ability of the final model, visual predictive check (VPC) approaches were used. For VPC, the final model was used to simulate 1,000 new virtual replicates of the clinical study. The median simulated BAC and the 95% prediction interval, from the 2.5th percentile to 97.5th percentile of simulated BAC, were plotted and compared with the observed data.
Results and Discussions
To the best of the authors knowledge, this is the first study to extensively examine the absorption rate of alcohol and explore the factors that affect the absorption rate of alcohol, by taking multiple influencing factors into account at the same time. The experiment was conducted in the fasted state, immediately after consumption of a low dose of alcohol. The pharmacokinetic parameters and covariates in the final model were estimated with good precision, and no trends were identified in the goodness of- fit plots or other model evaluation criteria, indicating that the model was an accurate representation of the data.
Table 1 shows the anthropometric and genetic characteristics of the study population. The proportions of ADH1B and ALDH2 genotypes were similar to a previous report, in which the frequency of genotypes in 524 Japanese subjects were reported as 6.5% (*1/*1), 33.2% (*1/*2), and 60.3% (*2/*2) for ADH1B, and 56.8% (*1/*1), 36.6% (*1/*2), and 6.5% (*2/*2) for ALDH2 [13].
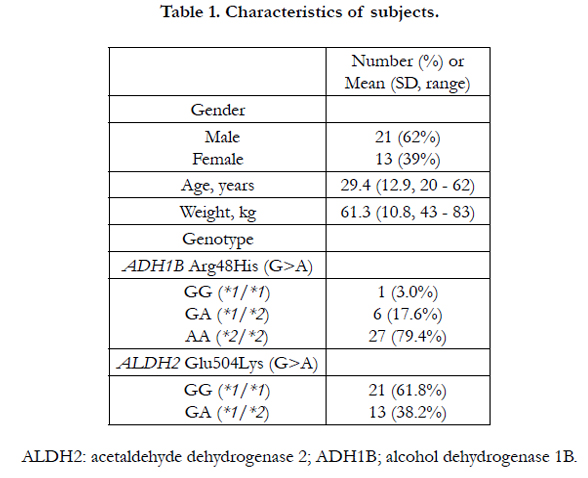

Table 1. Characteristics of subjects.
Figure 1 displays the BAC-time profiles used for population pharmacokinetic analysis. A total of 157 BACs from 34 subjects at alcohol concentrations ranging from 0.0014 to 0.41 g/L were simultaneously analyzed. BAC-time data are sometimes described with a non-linear elimination pathway according to Michaelis- Menten kinetics [2, 14]. However, as shown in Figure 1, few data on the terminal phase were available, and a one-compartment model with normal first-order elimination process was considered to be the simplest, and, thus the most appropriate for parsimony.
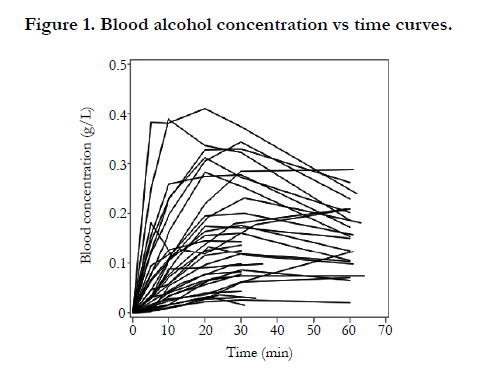
Figure 1. Blood alcohol concentration vs time curves.
BAC-time profiles were analyzed by a one-compartment model as the base model. Table 2 shows the estimated values of Κa, Vd/F, and κel for the base model. Firstly, inter-individual variabilities for all three parameters were incorporated. However, because estimates of inter-individual variability for kel were low, and could be excluded without significantly altering the parameter values and OFV, inter-individual variability for κel was excluded from the base model and the final model.
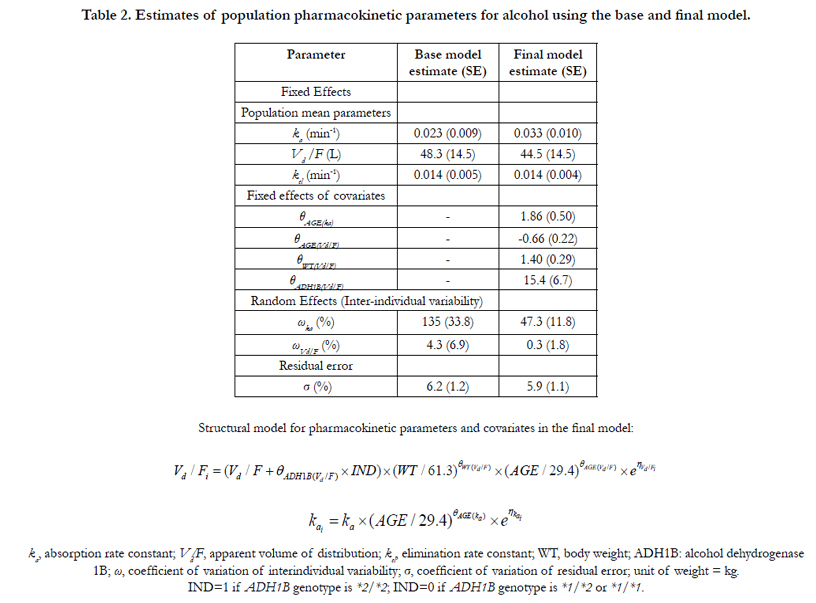
Table 2. Estimates of population pharmacokinetic parameters for alcohol using the base and final model.
During the process of final model construction, κa was found to be dependent on age in Step 1 with ΔOFV = -31.4. Subsequently, in Step 2 and Step 3, Vd⁄F was dependent on body weight with Δ OFV = -14.3, age with ΔOFV = -4.4, and genotype of ADH1B with ΔOFV = -7.6, respectively. Gender had a slight but non-significant effect on Vd⁄F (ΔOFV = -1.6). All covariates incorporated into the base model through Step 1, Step 2 and Step 3, were not deleted in Step 4. Population pharmacokinetic parameters estimated with the final model are summarized in Table 2.
In the final model, the correlation between OBS and IPRED was high (Figure 2, (b)). CWRES was uniformly distributed from -4.6 to 2.7 within an acceptable range (i.e. between -5.0 and 5.0) (Figure 2, (c) and (d)). To evaluate the final model, VPC was performed. Simulated data sets were generated from the final model and the actual data were compared with the distribution of the simulated data. A plot of the time course of median prediction, along with the 2.5th to 97.5th percentiles for the simulated values, is presented (Figure 3). The graph shows that 87% was included in the area within the 2.5th to 97.5th percentile about the observed concentration form 10 min to 60 min after the intake of alcohol.
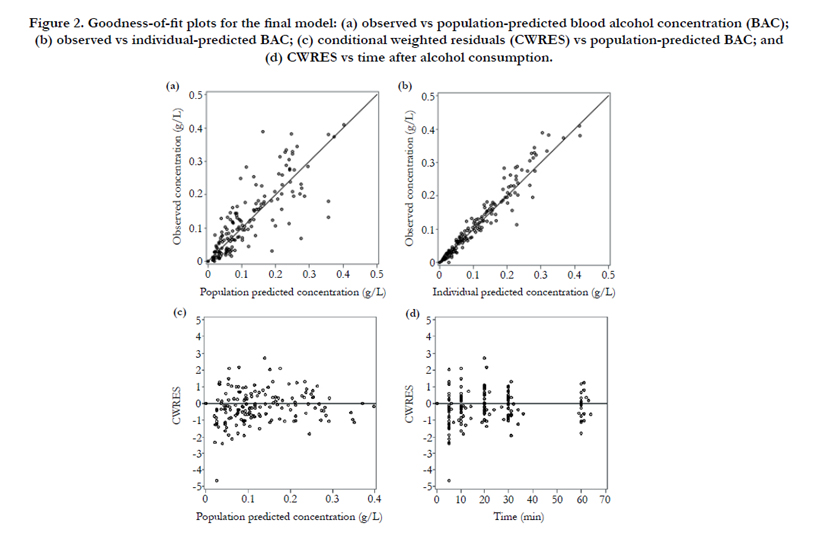
Figure 2. Goodness-of-fit plots for the final model: (a) observed vs population-predicted blood alcohol concentration (BAC); (b) observed vs individual-predicted BAC; (c) conditional weighted residuals (CWRES) vs population-predicted BAC; and (d) CWRES vs time after alcohol consumption.
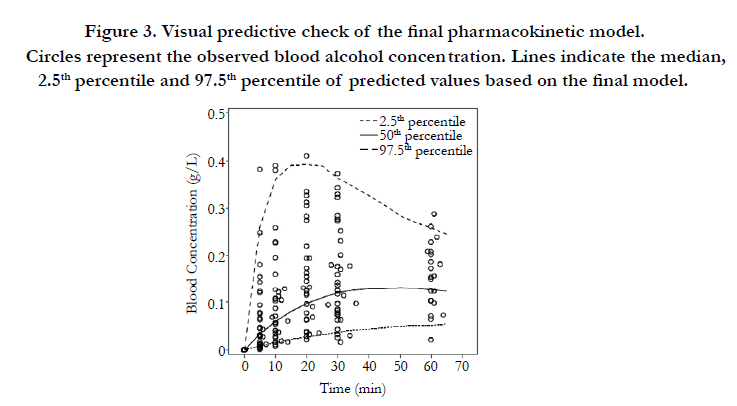
Figure 3. Visual predictive check of the final pharmacokinetic model. Circles represent the observed blood alcohol concentration. Lines indicate the median, 2.5th percentile and 97.5th percentile of predicted values based on the final model.
These data show that a positive correlation exists between age and κa, while a negative correlation exists between age and Vd⁄F. In subjects with high κai, there was a rapid increase in BAC after the consumption of alcohol and relatively high BACs were found in subjects with low Vd/Fi. The relationship between aging and ka has not been extensively studied. In young adult and elderly, nonalcoholic males, Pozzato et al., reported that first-pass metabolism (FPM), obtained from the difference between the area under the curve of BAC after intravenous or oral administration of 0.3 g per kg body weight of alcohol, was reduced by one-third in elderly compared with young men [17]. Our results are consistent with those previously reported because the reduction in FPM accounts for the rapid increase in BAC. Similar to the present study, some reports suggest that elderly subjects have a lower Vd/(F) than younger subjects [15, 16]. ka also represents a key determinant of peak BAC because the absorption rate of alcohol is greater than its rate of elimination [1, 3, 4]. Also, it is reasonable to assume that Vd⁄F increases with body weight.
The effect of the SNP in ADH1B on the metabolism of alcohol has been extensively reviewed. In this study, Vd/F was higher in the population carrying ADH1B *2/*2 than ADH1B *1/*2. This result suggests that BAC in the population with ADH1B *2/*2 is relatively low. Our results are compatible with the in vitro enzymatic activity of each AHD1B genotype [18].
Conclusion
Population pharmacokinetic parameters were estimated using a one-compartment model for alcohol absorption immediately after the consumption of a single can of beer (17.5g of alcohol) in fasted Japanese subjects. The key finding of this study is that age positively correlated with the absorption rate for alcohol and the effect of age on the absorption rate was determined as the most significant covariate through the final model building process. This study revealed the significant effect of aging on absorption of alcohol, suggesting that aging may cause higher peak blood alcohol via a higher κa and lower Vd/F.
Acknowledgment & Declarations
We appreciate YoshihideSuwa (Research Center, Suntory Limited. Osaka, Japan) for organizing a collaborative research group and Yoko Kamata (Research Center, Suntory Limited. Osaka, Japan) for help in conducting clinical studies. This study was supported by a donation from Suntory Limited (Osaka, Japan).
References
- Ramchandani V, Bosron WF, Li TK (2001) Research advances in ethanol metabolism. Pathol Biol (Paris). 49(9): 676-82.
- Norberg Å, Jones WA, Hahn RG, Gabrielsson JL (2003) Role of variability in explaining ethanol pharmacokinetics: Research and forensic applications. Clin Pharmacokinet. 42(1): 1-31.
- Holt S (1981) Observations on the relation between alcohol absorption and the rate of gastric emptying. Can Med Assoc J. 124(3): 2.
- Wilkinson PK, Sedman AJ, Sakmar E, Kay DR, Wagner JG (1977) Pharmacokinetics of ethanol after oral administration in the fasting state. J Pharmacokinet Biopharm. 5(3): 207-24.
- Clardy DO (2004) Population pharmacokinetics of ethanol in drinking drivers using breath measures. Ther Drug Monit. 26(4): 391-400.
- Yang CT, Fung WK, Tam TW (2011) Population pharmacokinetics of alcohol on Chinese subjects using breath measures. J Clin Pharm Ther. 36(6):716-24.
- Lee BY, Yoon HK, Baek IH, Kwon KII (2013) Population pharmacokinetics of multiple alcohol intake in humans. Alcohol. 47(2): 159-65.
- Seng KY, Limenta LMG, Heng D, Lee EJD (2013) Population pharmacokinetics and pharmacogenetics of alcohol in Chinese and Indians in Singapore. J Clin Pharm Ther. 38(2): 141-9.
- Goldberg L (1943) Quantitative studies on alcohol tolerance in man. Acta Physiol Scand. 5: 1-128.
- Horowitz M, Maddox A, Bochner M, Wishart J, Bratasiuk R, Collins P, et al., (1989) Relationships Between Gastric Emptying of Solid and Caloric Liquid Meals and Alcohol Absorption. Am J Physiol. 257: G291-G298.
- Roine RP, Gentry RT, Lim RT, Helkkonen E, Salaspuro M, Lieber CS (1993) Comparison of blood alcohol concentrations after beer and whiskey. Alcohol Clin Exp Res. 17(3):709-11.
- Fraser AG, Rosalki SB, Gamble GD, Pounder RE (1995) Inter-individual and intra-individual variability of ethanol concentration-time profiles: comparison of ethanol ingestion before or after an evening meal. Br J Clin Pharmacol.40(4): 387-92.
- Takeshita T, Mao X-Q, et.al., (1996) Morimoto K. The contribution of polymorphism in the alcohol dehydrogenase β subunit to alcohol sensitivity in a Japanese population. Hum Genet. 97(4): 409-13.
- Wagner J, Patel JA (1972) Variations in absorption and elimination rates of ethyl alcohol in a single subject. Res Commun Chem Pathol Pharmacol. 4(1): 61-76.
- Vestal RE, McGuire EA, Tobin JD, Andres R, Norris AH, Mezey E (1977) Aging and ethanol metabolism. Clin Pharmacol Ther. 21(3): 343-54.
- Wiberg GS, Samson JM, Maxwell WB, Coldwell BB, Trenholm HL (1971) Further studies on the acute toxicity of ethanol in young and old rats: relative importance of pulmonary excretion and total body water. Toxicol Appl Pharmacol. 20(1): 22-9.
- Pozzato G, Moretti M, Franzin F, Croce LS, Lacchin T, Benedetti G, et al., (1995) Ethanol metabolism and aging: the role of “first pass metabolism” and gastric alcohol dehydrogenase activity. J Gerontol A Biol Sci Med Sci.50(3): B135-41.
- Bosron WF, Ehrig T, Li TK (1993) Genetic factors in alcohol metabolism and alcoholism. Semin Liver Dis. 13(2): 126-35.


