Study of Insulin Secretory Response after Oral Glucose Load in Obese Subjects
Anuradha K1*, Mathur R2
1. Department of Biochemistry, S.M.S. Medical College, Jaipur, Rajasthan.
2. Biochemistry, Senior Professor & Head, Department of Biochemistry, Dr. S. N. Medical College, Jodhpur, India.
*Corresponding Author
Anuradha Khichar,
Department of Biochemistry, S.M.S. Medical College,
Jaipur, Rajasthan.
E-mail: anu6921@gmail.com
Received: December 28, 2015; Accepted: January 20, 2016; Published: January 22, 2016
Citation: Anuradha K, Mathur R (2016) Study of Insulin Secretory Response after Oral Glucose Load in Obese Subjects. Int J Bioorg Chem Mol Biol. 4(1), 12-16.DOI : dx.doi.org/10.19070/2332-2756-160002
Copyright: Anuradha K© 2016. This is an open-access article distributed under the terms of the Creative Commons Attribution License, which permits unrestricted use, distribution and reproduction in any medium, provided the original author and source are credited.
Abstract
Background: Insulin resistance leads to impaired glucose tolerance, dyslipidemia, and other adverse cardiovascular effects.Increased insulin resistance will lead to hyperinsulinemia which is a characteristic feature of obesity, hypertension and type 2 Diabetes mellitus.
Aims: The present study was designed to investigate insulin secretory response and glucose abnormalities after oral glucose
load in obese subjects.
Material and Method: The present study was carried out on 25 healthy controls and 25 obese subjects of either sex and
of varying age groups attending the Out Patient Department of Medicine, Dr. S.N. Medical College and Associated group
of hospitals, Jodhpur.
Results: The results obtained in this study showed that the results of standard OGTT and corresponding insulin response during fasting, after 1 hour & 2 hour were significantly higher in patients compared with control subjects.
Conclusion: The present study indicates an increased insulin secretory response in obese subjects, which is due to higher
insulin resistance.
2.Introduction
3.Materials and Methods
4.Results
5.Discussion
6.Conclusion
7.References
Keywords
Glucose Tolerance; Obesity; Insulin; Insulin Resistance; OGTT.
Introduction
Obesity is a medical condition in which excess body fat has accumulated to the extent that it may have an adverse effect on health, leading to reduced life expectancy or increased health problem [1, 2]. Overweight and obesity are the fifth leading risk for global health. At least 2.8 million adults die each year as a result of overweight or obese. In addition, 44% of the diabetes, 23% of ischaemic heart disease and between 7% and 41% certain cancer are attributable to overweight and Obese [3]. Obesity is associated with other well proved risk factors such as diabetes, hypertension, dyslipidemia, high blood cholesterol, and physical inactivity [4]. The combination of insulin resistance and hyperinsulinaemia cause a number of metabolic and cardiovascular changes that result in a syndrome typically characterized by type 2 DM, obesity, dyslipidemia, coronary artery disease and hypertension [5]. Thus in present study an attempt has been made to examine the insulin secretory response to oral glucose load to test whether obesity is associated with insulin resistance.
Materials and Methods
The present study was conducted on 50 subjects with either sex and of varying age group in the Department of Biochemistry, Dr. S.N. Medical College and Associated group of Hospitals, Jodhpur.
The selected subjects were further grouped as:-
GROUP 1: Healthy control subject (n=25). It was ensured by routine examination that all the subjects were healthy and there were no signs and symptoms of obese and other disease.
GROUP 2: Obese subjects (without hypertensive) (n=25). It included subjects which have BMI >30. There blood pressure is in range of systolic blood pressure (<120mmHg) and diastolic blood pressure (<80 mmHg) and have no symptoms of diabetes mellitus and thyroid abnormalities.
An informed consent was taken from all the healthy control subjects and patients, under study apprising them the nature and objective of the study. All subjects were studied as outpatient. Participant’s examination included interviews for medical and nutritional history. Present and past history of each case was recorded in detail regarding their general information i.e. name, age, sex, address, religion, occupation, economic status, nutritional and personal habits, education, medication and history suggestive of any systemic illness. Each subject was then examined for various anthropometric parameters: Weight (Kg), height (meters), BMI (Body Mass Index) was calculated by Weight (Kg)/height squared (m²) and Blood pressure (BP).
After on overnight fast of 10-12 hours, fasting blood samples were collected. OGTT was conducted in all the groups. Then orally 75 gm dose (normally 1 gm per kg body weight) of glucose was given and after 1 hour and 2 hour blood samples were drawn from antecubital vein of each subject by using aseptic technique. The blood was collected in fluoride and plain tubes for blood glucose and other parameters respectively. Serum was separated after centrifugation and analysed.
Following biochemical parameters were analysed by commercially available reagents and kits on semi autoanalyzers and autoanalyzer in Clinical Biochemistry Laboratory, M.G. Hospital, Dr. S.N. Medical College, Jodhpur.
1) Glucose by GOD-POD method.[6],
2) Serum Insulin by ELISA Method.[7],
3) Insulin Resistance: Fasting Insulin Resistance Index (FIRI) by (HOMA-IR) formula. HOMA IR= fasting insulin (μU/mL) × fasting glucose (mmol/L)]/22.5.
4) Lipid Profile:
(i) Serum Total Cholesterol (TC): Enzymatic, Cholesterol esterase, Cholesterol oxidase and Peroxidase, end point method [8].
(ii) Serum Triglyceride: Enzymatic, Lipoprotein lipase, Glycerol kinase, Glycerol phosphate oxidase and Peroxidase, end point method [9].
(iii) HDL-c: Phosphotungstic acid, end point method [10].
(iv) VLDL-c &
(v) LDL-c: By Friedwald's formula.
The different anthropometric and biochemical parameters will be subjected to essential statistical evaluation (like mean, standard deviation, student 't' test, 'p' value) to find out any correlation among the groups if exist.
Results
Table 1 shows the various baseline characteristics of study population . In the present study, mean weight was 80.32 ± 10.59 and 71.04 ± 13.25 Kg in the healthy controls, obese subjects, respectively. Mean height (in meters) of the healthy controls, obese subjects in the present study was 1.62 ± 0.07 and 1.57 ± 0.04 meters. The mean Body Mass Index (BMI) of the healthy control subjects was 22.20 ± 1.27. It was 30.58 ± 2.98 in obese subjects respectively. The mean fasting blood glucose level in the obese subjects (86.38 ± 6.04 mg/dL) were highly significant (t=5.33; p<0.001) as compared to healthy controls (76.76 ± 6.71). (Table 1 ,2 and Figure 1).
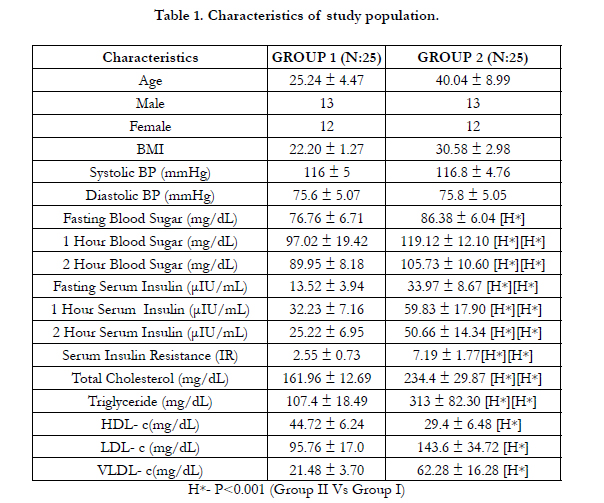

Table 1. Characteristics of study population.
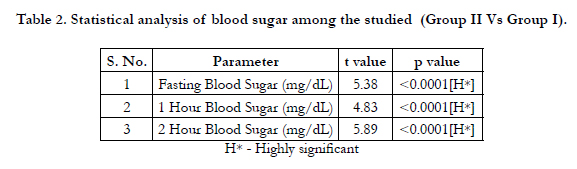
Table 2. Statistical analysis of blood sugar among the studied (Group II Vs Group I).
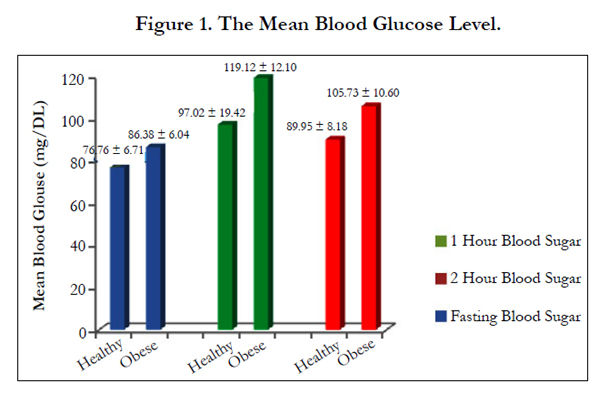
Figure 1. The Mean Blood Glucose Level.
The mean values for 1 hour and 2 hour plasma glucose in obese subjects were 119.12 ± 12.10, 105.73 ± 10.60 mg/dL whereas 97.02 ± 19.42, 89.95 ± 8.18 in healthy control subjects respectively (Table 1 and Figure 1). The mean values for fasting, 1 hour & 2 hour serum insulin were 33.97 ± 8.67, 59.83 ± 17.90, 50.66 ± 14.34 in obese subjects whereas 13.52 ± 3.94μIU/mL, 32.23 ± 7.16μIU/mL & 25.22 ± 6.95 μIU/mL in healthy control subjects respectively. There difference was highly significant (Table 1,3 and Figure 2). The mean HOMA IR level was 2.55 ± 0.73 in healthy control subjects, and 7.19 ± 1.77 in obese subjects. This difference was highly significant. (p<0.001). (Table 1,4 and Figure 3).
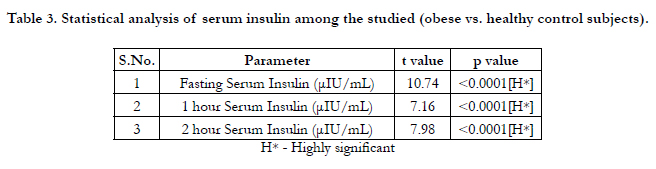
Table 3. Statistical analysis of serum insulin among the studied (obese vs. healthy control subjects).
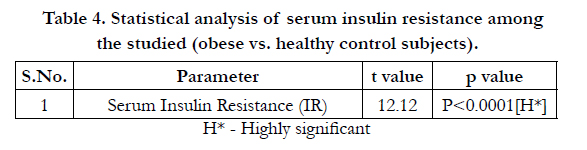
Table 4. Statistical analysis of serum insulin resistance among the studied (obese vs. healthy control subjects).
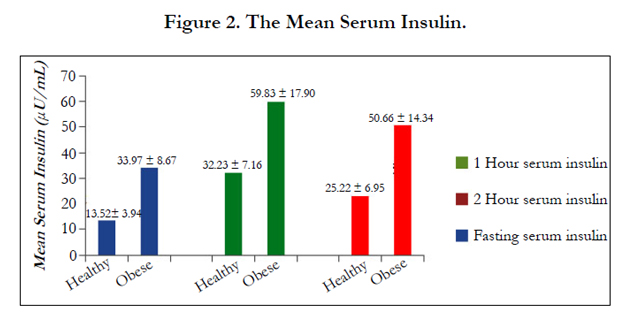
Figure 2. The Mean Serum Insulin.
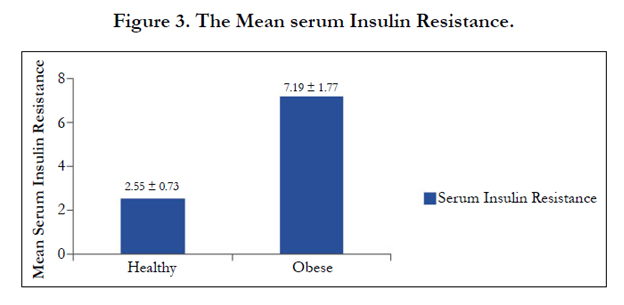
Figure 3. The Mean serum Insulin Resistance.
Mean serum total cholesterol values were highly significant (t=11.16, p<0.001) in obese subjects (234.4 ± 29.87 mg/dL) as compared to the healthy control subject (161.96 ± 12.69 mg/dL) The mean TG level was 107.4 ± 18.49 in healthy control subjects , and 313 ± 82.30 in obese subjects respectively (Table:1).
Mean serum HDL-c values were highly significant (t=8.52, p<0.001) in obese subjects (29.4 ± 6.48 mg/dL) as compared to the healthy control subject (44.72± 6.24 mg/dL). (Table:1).
The Mean serum VLDL-c & LDL-c values were 62.28 ± 16.28, 143.6 ± 34.72 in obese subjects whereas 21.48 ± 3.70, 95.76 ± 17.0 in healthy control subjects respectively. There difference was highly significant (Table : 1).
Discussion
Hypertension, obesity, and glucose intolerance (impaired glucose tolerance and noninsulin-dependent diabetes) are so commonly associated as to suggest common pathogenic mechanisms. Impaired glucose tolerance and obesity are characterized by hyperinsulinemia, which reflects peripheral insulin resistance [11].
Our study show that the mean fasting blood glucose level in the obese subjects were highly significant as compared to healthy controls. In accordance to our study, Slowinska-Srzendnicka J et al (1989) [12] reported a highly significant relation (p<0.001) with fasting blood glucose in obese subjects (77.5 ± 3.40 mg/dL) as compared to the healthy control subjects (66.7 ± 4.80 mg/dL). In present study the mean 1 hour & 2 hour Blood glucose level in the obese subjects were highly significant as compared to the healthy controls. Our results concur with the study of Beuschlein F et al (2000) [13], as they reported a highly significant relation (p<0.001) in 2 hour blood glucose in obese subjects as compared in healthy subjects. Prager R et al(1987) [14] observed significantly elevated blood glucose level during OGTT.
In this study mean fasting serum insulin values were highly significant in obese subjects as compared to the healthy control subjects. As per our study, the result of serum fasting insulin were in agreement with those of the Slowinska-Srzednicka J et al (1989) [12] as they observed a highly significant relation (p<0.001) in fasting serum insulin in obese subjects (23.80 ± 1.90 mU/L) as compared to the healthy control subjects (12.00 ± 1.00 mU/L). Further our data also matched with the results of Finta M et al (1992) [15] who suggested a highly significant relation (p<0.001) in fasting serum insulin in obese subjects (20 ± 3 microU/mL) as compared with non-obese subjects (5 ± 0.7 micro U/mL). Similarly, Guo X et al (1998) [16], Nielsen S et al (1999) [17], Zemva A et al (2000) [18] also reported significantly increased fasting serum insulin in obese subjects as compared to the healthy controls.
In our study, a highly significant correlation in 1 hour serum insulin levels were observed when healthy control subjects were compared with obese subjects. In accordance to our study, Finta M et al (1992) [15] reported a highly significant relation (p<0.001) in 1 hour serum insulin in obese subjects (118 ± 19 microU/ mL) as compared to the non-obese subjects (49 ± 6 microU/ mL).Bonora E et al(1984) [19] reported significantly higher 1 hour serum insulin level in obese subjects as compared to the healthy controls. In the present study a highly significant relation in 2 hour serum insulin levels were observed when healthy control subjects were compared with obese subjects. Our results concur with the study of ParleyMJ et al (1967) [20], as they reported a highly significant relation (p<0.001) in 2 hour serum insulin level after oral glucose load in obese subjects as compared to the healthy controls. Bonora E et al(1984) [19]. reported significantly higher 2-hour serum insulin concentration in obese subjects as compared to the healthy controls. Prager R et al(1987) [14], Bonadonna RC et al(1990) [21], Nielsen S et al(1999) [17], Hong J et al(2008) [22] also reported significantly higher insulin response after oral glucose load in obese subjects as compared to the healthy controls. In our study, a highly significant correlation (p<0.001) in serum Insulin Resistance (IR) was observed when obese subjects were compared with healthy control subjects.
Another finding observed in the present study was that the mean serum total cholesterol values were highly significant (t=11.16, p<0.001) in obese subjects as compared to the healthy control subject. In accordance to our study, Weber MA et al (2001) [23] reported a highly significant relation (p>0.001) in serum TC in obese subjects (203 ± 9mg/dL) as compared to the healthy controls (195 ± 4mg/dL). In our study ,mean serum TG values were highly significant (t=12.80, p<0.001) in obese subjects as compared to the healthy control subject. In accordance to our study, Azita F et al (2009) [24] reported a highly significant relation (p<0.001) in serum TG in obese subjects (110.6 ± 42.1 mg/dL) and overweight (107.0 ± 51.6 mg/dL) as compared to the healthy controls (86.9 ± 34.9 mg/dL).
In the present study, mean serum HDL-c values were highly significant (t=8.52, p<0.001) in obese subjects as compared to the healthy control subject. Our observation were in accordance with those of Beuschlein F et al (2000) [13], as they reported a highly significant relation (p<0.001) in serum HDL-c level in obese subjects (2.8 ± 0.8 mmol/L) as compared to the healthy control subjects (1.8 ± 0.8 mmol/L). Similarly, Weber MA et al (2001)[23] reported a highly significant relation (p<0.001) with serum HDL-c in obese subjects (52 ± 3 mg/dL) as compared to the healthy control subjects (59 ± 4 mg/dL).
Our study shows that mean serum VLDL-c values were highly significant (t=12.21, p<0.001) in obese subjects as compared to the healthy control subject. Bhatti MS et al (2001) [25] reported significantly higher level of serum VLDL-c level in obese subjects as compared to the healthy controls. In our study,a statistically highly significant increase (t=6.18; p<0.001) in obese subjects in mean serum LDL-c values was observed as compared to the healthy control subjects. In accordance to our study, Weber MA et al (2001) [23] reported a highly significant relation (p<0.001) in serum LDL-c in obese subjects (131±5 mg/dL) as compared to the healthy controls (123±7 mg/dL).
Thus in obese subjects, early diagnosis and treatment of an abnormal glucose & lipid metabolism may be particularly important to reduce cardiovascular disease, type 2 DM.
Conclusion
The present study indicates an increased insulin secretory response in obese subjects, which is due to higher insulin resistance. This increased insulin resistance will lead to hyperinsulinaemia which is a characteristic feature of obesity, hypertension and type 2 Diabetes mellitus. Therefore, all these three are very important risk factors which imposes a cumulative effect on each other and in the etiology and pathogenesis of cardiovascular complications that end up in the development of metabolic syndrome when present together. Subject with either of these should be well screened timely and also after diagnosis.
References
- World Health Organization (WHO) (2000) Obesity: preventing and managing the global epidemic. Report of a WHO consultation.
- Haslam DW, James WP (2005) Obesity. Lancet 366(9492): 1197-1209.
- World Health Organization (WHO) (2011) Obestiy and Overweight 2006.
- Thakur JS, Bisht S (2010) Comparative Study of blood lipid profile of obese and non-obese sedentary college men. VSRD-TNTJ I(1): 26-29.
- Kashyap SR, Defronzo RA (2007) The insulin resistance syndrome: physiological considerations. Diab Vasc Dis Res 4(1): 13-19.
- Trinder P (1969) Determination of Glucose in Blood using Glucose oxidase with an alternative oxygen acceptor. Ann Clin Biochem 6: 24-25.
- Eastham RD (1985) Biochemical values in clinical Medicine. (7th edtn), John Wright and Sons Ltd, Bristol.
- Richmond W (1973) Preparation and properties of a cholesterol oxidase from Nocardio sp. and its application to the enzymatic assay of total cholesterol in serum. Clin Chem 19(12): 1350-1356.
- Foosati P, Prencipe L (1982) Serum triglycerides determined colorimetrically with an enzyme that produces hydrogen proxide. Clin Chem 28(10): 2077-2080.
- Gordon T, Castelli WP, Hjortland MC, Kannel WB, Dawber TR (1977) High density lipoprotein as a protective factor against coronary heart disease. The Framingham study. Am J Med 62(5): 707-714.
- Modan M, Halkin H, Almog S, Lusky A, Eshkol A, et al. (1985) Hyperinsulinemia: A Link Between Hypertension Obesity and Glucose Intolerance. J Clin Invest 75(3): 809-817.
- Slowinska-Srzednicka J, Zglicyzynskis, Soszynski P, Zgliczynski W, Jeske W (1989) High Blood Pressure and hyperinsulinaemia in acromegaly and in obesity. Clin Exp Hypertens A 11(3): 407-425.
- Beuschlein F, Borgemeister M, Schirra J, Goke B, Fassnachi M, et al. (2000) Oral glucose tolerance testing but not intravenous glucose administration uncovers hyper-responsiveness of hypothalamo-pituitary-adrenal axis in patients with adrenal incidentalomas. Clin Endocrinol 52(5): 617-623.
- Prager R, Wallace P, Olefsky JM (1987) Hyperinsulinemia does not compensate for peripheral insulin resistance in obesity. Diabetes 36(3): 327-334.
- Finta KM, Rocchini AP, Moorehead C, Key J, Katch V (1992) Urine sodium excretion in response to an oral glucose tolerance test in obese and non-obese adolescents. Pediatrics 90(3): 442-446.
- Guo X, Li J, Ma G (1998) Relationship between blood glucose, insulin and hypertension in 60 obese children. Zhonghua Yu Fang Yi Xue Za Zhi 32(1): 25-27.
- Nielsen S, Jensen MD (1999) Relationship between urinary albumin excretion, body composition, and hyperinsulinemia in normotensive glucosetolerant adults. Diabetes Care 22(10): 1728-1733.
- Zemva A, Zemva Z (2000) Ventricular ectopic activity, left ventricular mass, hyperinsulinemia, and intracellular magnesium in normotensive patients with obesity. Angiology 51(2): 101-106.
- Bonora E, Zavaroni I, Bruschi F, Alpi O, Pezzarossa A, et al. (1984) Peripheral hyperinsulinemia of simple obesity: pancreatic hypersecretion or impaired insulin metabolism. J Clin Endocrinol Metab 59(6): 1121-1127.
- Perley MJ, Kipnis DM (1967) Plasma Insulin Responses to Oral and Intravenous Glucose: Studies in Normal and Diabetic Subjects. J Clin Invest 46(12): 1954-1962.
- Bonadonna RC, Groop L, Kraemer N, Ferrannini E, Del Prato S, et al. (1990) Obesity and insulin resistance in humans: a dose response study. Metabolism 39(5): 452-459.
- Hong J, Zhang YF, Gu WQ, Zhang YW, Su YX, et al. (2008) Insulin sensitivity and first phase insulin secretion in obese Chinese with hyperglycaemia in 30 and/or 60 min during glucose tolerance tests. Endocrine 34(1-3): 75-80.
- Weber MA, Neutel JM, Smith DH (2001) Contrasting Clinical Properties and Exercise Responses in Obese and Lean Hypertensive Patients. J Am Coll Cardiol 37(1): 169-174.
- Azita F, Asghar Z, Gholam-Reza S (2009) Relationship of Body Mass Index with Serum Lipids in Elementary School Students. Indian J Pediatr 76(7): 729-731.
- Bhatti MS, Akbri MZ, Shakoor M (2001) Lipid profile in obesity. J Ayub Med Coll Abbottabad 13(1): 31-33.


