Effects Of Marijuana On Serum Calcium, Phosphate And Uric Acid Biochemistry Of Adult Albino Wistar Rat
Kingsley AO1, Dic-Ijiewere EO2*, Charles II1, Osarobo E3, Aigbomian OJ1
1 Department of Medical Laboratory Science, Ambrose Alli University, Ekpoma, Nigeria.
2 Department of Chemical Pathology, Ambrose Alli University, Ekpoma, Nigeria.
3 Department of Haematology, Ambrose Alli University, Ekpoma, Nigeria.
*Corresponding Author
Dic-Ijiewere Ebenezer O,
Department of Chemical Pathology,
Ambrose Alli University, Ekpoma, Nigeria.
Email: labheth@gmail.com
Received: March 08, 2018; Accepted: July 19, 2018; Published: July 23, 2018
Citation: Kingsley AO, Dic-Ijiewere EO, Charles II, Osarobo E, Aigbomian OJ. Effects Of Marijuana On Serum Calcium, Phosphate And Uric Acid Biochemistry Of Adult Albino Wistar Rat. Int J Bioinform Biol Syst. 2018;2(2):30-35.
Copyright: Dic-Ijiewere EO© 2018. This is an open-access article distributed under the terms of the Creative Commons Attribution License, which permits unrestricted use, distribution and reproduction in any medium, provided the original author and source are credited.
Abstract
Marijuana also called weed, herb, pot, grass, bud, ganja, Mary Jane, and a vast number of other slang terms is a greenish-gray mixture of the dried, shredded leaves and flowers of Cannabis sativa the hemp plant. The aim of the study is to investigate the effect of marijuana on the calcium, phosphate and uric acid of adult albino wistar rat. A total of twenty four (24) Albino wistar rats were used. The rats were divided into four groups with six rats each as follows: Group A (control: only feed with normal feed for the same number of days); Group B (0.3ml marijuana + feed); Group C (0.6ml of marijuana + feed); Group D (0.9ml marijuana + feed) for 21 days. Blood specimen were collected into lithium heparin containers, plasma was separated and used for the estimation of calcium, phosphate and uric acid spectrophotometrically. We observe an increase in calcium levels of group B (8.93 ± 0.45), group C (9.77 ± 1.16), group D (10.53 ± 0.74) when compared with the control (8.22 ± 0.44). There was an increase in phosphate levels of group B (4.85 ± 0.39), group C (5.25 ± 0.39), group D (5.60 ± 0.43) when compared to the control (4.36 ± 0.31). There was also an increase in uric acid levels of group B (6.11 ± 0.49), group C (8.02 ± 0.24), group D (9.89 ± 0.94) compared to control (5.07 ± 0.36). There was an increase in weight of the different rats after experiment compared to the weight before the experiment. Conclusively, increasing dosage of marijuana had a high effect on calcium, phosphate and uric acid level of albino wistar rat.
2.Introduction
3.Calcium
4.Uric Acid
5.Phosphate
6.Methods
6.1. Study Area
6.2. Research Design
6.3. Fundamental Animal Housing Condition
6.4. Animal Grouping
6.5. Study Duration
6.6. Substance of Study
7.Analytical Techniques
7.1. Substance Preparation
7.2. Substance Administration
7.3. Sample Collection
7.4. Statistical Analysis
8.Results
9.Discussion
10.Conclusion
11.References
Abbreviations
THC: Tetrahydrocannabinol; NSDUH: National Survey on Drug Use and Health; DAWN: Drug Abuse Warning Network; UA: Uric Acid; CPC: Cresolphthalein Complexone; SPSS: Statistical Package for Social Science; ANOVA: Analysis Of Variance.
Introduction
Marijuana is a greenish-gray mixture of the dried, shredded leaves and flowers of Cannabis sativa the hemp plant also called weed, herb, pot, grass, bud, ganja, Mary Jane, and a vast number of other slang terms. Some users smoke marijuana in hand-rolled cigarettes called joints; many use pipes, water pipes (sometimes called bongs), or marijuana cigars called blunts (often made by slicing open cigars and replacing some or all of the tobacco with marijuana) [1]. Marijuana can also be used to brew tea and, particularly when it is sold or consumed for medicinal purposes, is frequently mixed into foods (“edibles”) such as brownies, cookies, or candies. The main psychoactive (mind-altering) chemical in marijuana, responsible for most of the intoxicating effects sought by recreational users, is delta-9-tetrahydrocannabinol (THC). The chemical is found in resin produced by the leaves and buds primarily of the female cannabis plant. The plant also contains more than 500 other chemicals, including over 100 compounds that are chemically related to THC, called cannabinoids [2]. Marijuana is the most commonly used illicit drug (19.8 million past-month users) according to the 2013 National Survey on Drug Use and Health (NSDUH) [3]. That year, marijuana was used by 81.0 percent of current illicit drug users (defined as having used a drug at some time in the 30 days before the survey) and was the only drug used by 64.7 percent of them. Marijuana use is widespread among adolescents and young adults. According to the Monitoring the Future survey - an annual survey of drug use and attitudes among the Nation’s middle and high school students - most measures of marijuana use by 8th-, 10th-, and 12th- graders have held steady in the past few years following several years of increase in the previous decade. Teens’ perceptions of the risks of marijuana use have steadily declined over the past decade, possibly related to increasing public debate about legalizing or loosening restrictions on marijuana for medicinal and recreational use. In 2014, 11.7 percent of 8thgraders reported marijuana use in the past year and 6.5 percent were current users. Among 10th- graders, 27.3 percent had used marijuana in the past year and 16.6 percent were current users. Rates of use among 12th- graders were higher still: 35.1 percent had used marijuana during the year prior to the survey and 21.2 percent were current users; 5.8 percent said they used marijuana daily or near-daily [4].
Cannabis has psychoactive and physiological effects when consumed. The immediate desired effects from consuming cannabis include relaxation and euphoria (the "high" or "stoned" feeling), a general alteration of conscious perception, increased awareness of sensation, increased libido and distortions in the perception of time and space. At higher doses, effects can include altered body image, auditory and/or visual illusions, pseudohallucinations and ataxia from selective impairment of polysynaptic reflexes. In some cases, cannabis can lead to dissociative states such as depersonalization [5, 6] and derealization [7]. Some immediate undesired side effects include a decrease in short-term memory, dry mouth, impaired motor skills and reddening of the eyes [8]. Aside from a subjective change in perception and mood, the most common short-term physical and neurological effects include increased heart rate, increased appetite and consumption of food, lowered blood pressure, impairment of short-term and working memory [9], psychomotor coordination, and concentration. Some users may experience an episode of acute psychosis, which usually abates after 6 hours, but in rare instances, heavy users may find the symptoms continuing for many days [10]. Epidemiological studies have found a strong correlation between cannabis use and the risk of psychosis, and found the risk is higher for with strains higher in THC [11]. However, not all researchers consider this association to reflect a cause-and-effect relationship between cannabis use and psychosis [12]. It is not clear whether cannabis use affects the rate of suicide.
Medical emergencies possibly related to marijuana use have also increased. The Drug Abuse Warning Network (DAWN), a system for monitoring the health impact of drugs, estimated that in 2011, there were nearly 456,000 drug-related emergency department visits in the United States in which marijuana use was mentioned in the medical record (a 21 percent increase over 2009).
Calcium
Calcium is one of the most abundant mineral components (i.e. the fifth of the common elements) in the body. Dietary sources include: animal milk and its products such as cheese, yoghurt; canned sardines, soya milk, orange juice. Other important sources include animal bones. Cereals (in form of whole grains) contain small quantity of calcium. However, being consumed frequently makes them a significant source of calcium [13]. In the body of a normal healthy adult subject, the total calcium level is about 1 to 2 kilograms [14]. Total plasma concentration (i.e. total ionized fraction plus the unionized fractions) is about 2.2 to 2.62 mmol per litre (8.8 to 10.4 mg per decilitre). Calcium is found in the plasma in three forms - protein bound (primarily to albumin but is also bound to some degree to alpha, beta, and gamma globulins), complexed as undissociated salts; and free ionized form. About 45% of calcium in plasma is ionized or free calcium, another 45% is protein-bound and the remaining 10% is complexed. Only the free ionized form of calcium ions is biologically active [15]. About 99 % of free calcium is found in the skeletal system in form of hydroxyapatite and in small quantity as amorphous calcium salts. The activity of biologically active calcium is seen in three of the body’s major compartments: the skeletal system, soft tissues, and the extracellular fluid. Calcium phosphate in the bone is not an inert part of the skeletal system but is in constant active balance with the calcium ion and phosphate ion of the body fluids. Only 1% of total body calcium is in the extracellular fluid, while 0.1% is in the intracellular fluid [15].
Hypercalcaemia is said to occur when the total plasma calcium is greater than 10.5 mg per decilitre or 2.60 mmol per litre (>2.60 mmol per litre) in the presence of normal plasma protein concentration [14]. Blood calcium levels may be elevated in cases of thyroid disorder, multiple myeloma, and metastatic cancer, multiple bone fractures, milk-alkali syndrome, and Paget's disease. Excessive use of calcium-containing supplements and certain medications like antacids, thiazide, spironolactone, vitamin D analogues and lithium administration may also cause hypercalcaemia. In infants, lesser known causes may include blue diaper syndrome, Williams’s syndrome, secondary hyperparathyroidism from maternal hypocalcaemia, and dietary phosphate deficiency [16]. Symptoms include; Fatigue, constipation, depression, confusion and muscle pain [17], Nausea and vomiting, dehydration, increased urination and irregular heartbeat (arrhythmia) [18], hypercalciuria and Hypertension [19].
Uric Acid
Uric acid (UA) is the end-product of purine nucleotide metabolism in humans. In contrast to many lower vertebrates, human lack UA oxidase (uricase), an enzyme which further catalyses UA to allantoin, more soluble end product. Humans have higher serum UA levels when compared to other mammals due to the lack of uricase. UA is primarily excreted via the urine. The balance between dietary intake, endogenous metabolism of purines and the urinary excretion rate of UA determines plasma UA levels [20]. Purines of humans are metabolized into uric acid and then excreted in the urine. Intake of some kind of purine rich foods, such as meat and seafood, increases gout risk [21]. Gout may arise from regular consumption of meats, such as liver, kidney, and sweetbreads, and certain types of seafood including anchovies, herring, sardines, mussels, scallops, trout, haddock, mackerel and tuna [22]. Small intake of purine-rich vegetables, however, is not associated with an increased risk of gout [21]. A study has shown that Saturation levels of uric acid in blood may result in one form of kidney stones when the urate crystallizes in the kidney and these uric acid stones are radiolucent so do not appear on an abdominal plain X-ray and also Uric acid crystals can also promote the formation of calcium oxalate stones, acting as "seed crystals" [23].
Increase risk for cardiovascular disease may be seen in hyperuricaemia [24], An emergency condition known as Tumor lysis syndrome may result from blood cancers, which produces high uric acid levels in blood when tumor cells release their contents into the blood, either spontaneously or following chemotherapy [25]. One study showed high serum uric acid was associated with higher risk of type-2-diabetes, independent of obesity, dyslipidaemia, and hypertension [26].
Phosphate
The element Phosphorus occurs in the body as phosphate, since it is in complexes with oxygen. Phosphorus makes up about 12 gm per kilogram of the body weight in an adult. It is very essential with calcium in the support of bone formation. A large proportion of the ingested phosphate is precipitated as insoluble salts and so is not absorbed in the gastrointestinal tract. About 85% of the total body phosphate content is found in the body skeleton, 10% of the total body phosphate is found intracellularly in form of organic phosphate esters. The organic phosphate esters are associated with nucleoproteins, hexoses (e.g. Glucose-6-phosphate), deoxygenated haemoglobin in erythrocytes (2, 3-diphosphoglycerate) and purines. DNA and RNA are complex organic phosphate. It is a very important ion in the maintenance of acidbase balance of the body. The plasma inorganic phosphate ions (H2PO4- and HPO4) serve as one of the physiological buffer system of the blood and intracellular space and it takes part in Lipid, glucose and protein metabolism. Hyperphosphataemia is increased serum phosphate levels above 1.45 mmol per litre [27]. Skeletal fractures or disease, Excessive oral intake (administration of phosphate-containing enemas), kidney failure, hypoparathyroidism, haemodialysis, diabetic ketoacidosis (Navarro et al., 1994), acromegaly, systemic infection, and intestinal obstruction can all cause phosphate retention and build-up in the blood. The disorder occurs concurrently with hypocalcaemia [28]. Individuals with mild hyperphosphataemia are typically asymptomatic, but signs of severe hyperphosphataemia include: tingling in hands and fingers, muscle spasms and cramps, convulsions and cardiac arrest [29].
This research was carried out in Histopathology Laboratory, College of Medicine, Ambrose Alli University Ekpoma, Edo state, Nigeria. Edo state lies longitudinally at 04ºE and 43ºE and Latitude 05º44ºN and 07º34ºN [30].
In this study, a total of twenty four (24) Albino rats were used. The rats was divided into four groups with six rats each as follows: Group A (control group receiving equal volume of phosphate buffered saline for the same number of days); Group B (administered with 0.3ml of marijuana and feed); Group C (administered with 0.6ml of marijuana and feed); Group D (administered with 0.9ml of marijuana and feed). This lasted for a period of 21days and the experiments was conducted between the hours of 9.00 am and 11.00 pm daily. The 0.3ml, 0.6ml and 0.9ml marijuana doses were chosen and extrapolated in this experiment based on the previous work done by [31]. All the animal experiments were carried out in accordance with the guidelines of the Institution’s Animal Ethical Committee.
Twenty four (24) Adult Albino rats of comparable sizes and weights ranging from 150-300g was procured from the Animal Farm, College of Medicine, Ambrose Alli University Ekpoma, Nigeria and transferred to the Histopathology Laboratory where they were allowed one (1) week of acclimatization. They were kept in wire mesh cages with tripod that separates the animal from its faeces to prevent contamination. During this period of acclimatization, the rats were maintained in accordance with the standard guide for the care and use of Laboratory animals.
The rats were divided into four groups with six rats each, as follows: Group A (control group receiving equal volume of phosphate buffered saline for the same number of days); Group B (administered with 0.3ml of marijuana and feed); Group C (administered with 0.6ml of marijuana and feed); Group D (administered with 0.9ml of marijuana and feed).
The preliminary study, animal acclimatization, substance (marijuana) preparation, actual animal experiment and evaluation of results was for a period of three months (February, 2017 - April, 2017). However, the actual administration of marijuana on the animals lasted for 3 weeks.
The strongest chemical in marijuana, which comes from the cannabis plant, is delta-9-tetrahydrocannabinol (THC). When you smoke marijuana, THC binds to cannabinoid receptors in the brain.
Plant Extract: Six hundred grams of dried leaves of Cannabis sativa was milled to obtain a fine powder. 100 g of the powder was dissolved in 1000 ml of distilled water for 72 hours and filtered after 72 hours with Whatman’s Nọ 1 filter paper to yield 800 ml of filtrate. The filtrate was oven-dried at a temperature of 60°C for 7days to obtain a deep brown paste of 10 g which was dissolved in 50 ml of phosphate buffered saline to make a 200 mg/ml aqueous solution of C. sativa.
The administration of C. sativa (marijuana) was primarily by the following:
Group A: Was Fed with normal diet and phosphate buffered saline as control for 21days.
Group B: was administered with feed and marijuana (0.3ml) for 21days.
Group C: Was administered with feed and marijuana (0.6ml) for 21days.
Group D: Was administered with feed and marijuana (0.9ml) for 21days.
Five millilitres (5mls) of venous blood was collected from the subject animals in a sequestrinated (Lithium heparin) container. It was mixed properly to avoid clotting and centrifuged to separate the plasma. The plasma was obtained and stored at -20°.
Determination of total Calcium was done spectrophotometrically with the use of o-cresolphthalein complexone (CPC) alkaline solution. CPC formed a red chromophore with calcium, which was measured at 570 to 580 nm.
Uric acid is converted by uricase to allantoin and hydrogen peroxide, which under the catalytic influence of peroxidase, oxidizes 3, 5-dichloro-2-hydroxybenessulfic acid and 4-aminophenazone to form a red-violet quinoneimine compound.
Determination of phosphate was based on the reaction of phosphate ions with ammonium molybdate to form a phosphomolybdate complex that was then measured spectrophotometrically.
Statistical Package for Social Science (SPSS) version 20.0 software (SPSS Inc., Chicago, IL USA) windows was used to carry out analysis of variance (ANOVA), P-value <0.05 was considered as statistically significant.
Results
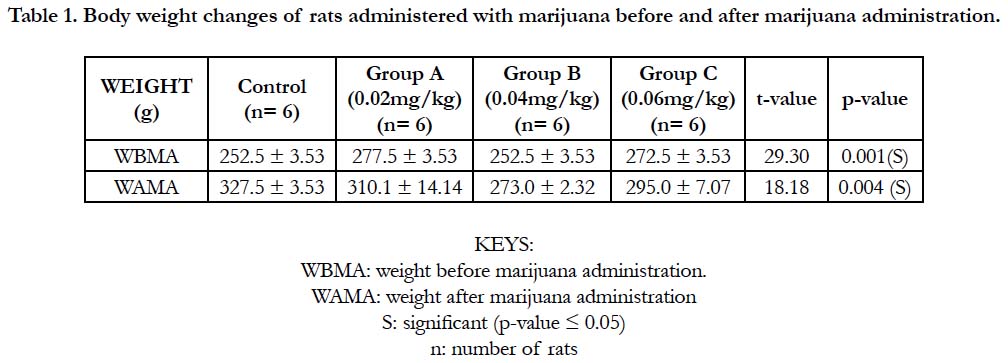
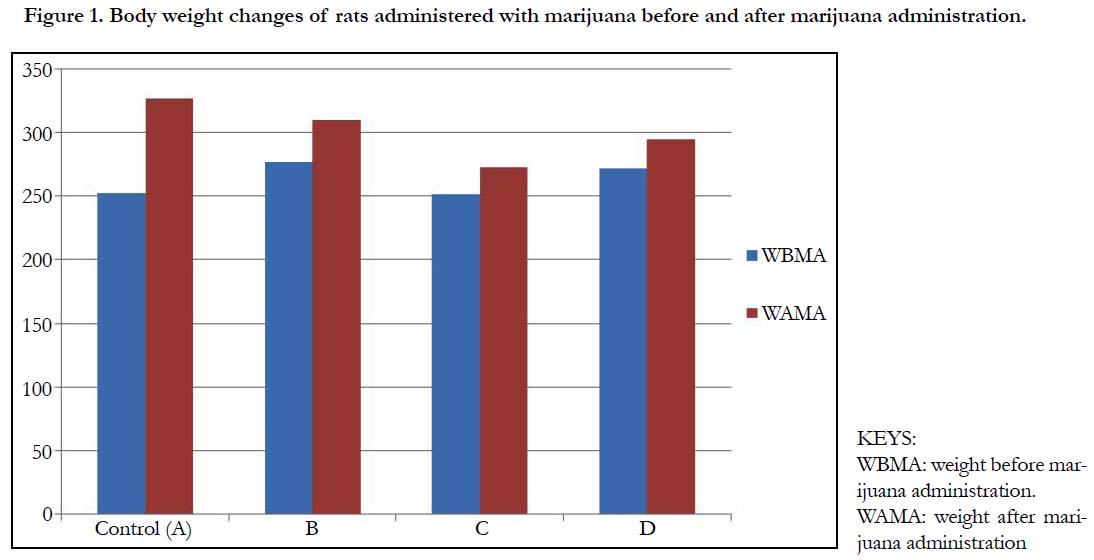
Table 1 and Figure 1 below, shows the body weights (mean ± standard deviation) of wistar rats. The mean ± standard deviation of the rats before the administration of marijuana for group A (control), group B, C and D were 252.5 ± 3.53, 277.5 ± 3.53, 252.5 ± 3.53 and 272.5 ± 3.53 respectively. After the administration of marijuana, the mean ± standard deviation of the rats were 327.5 ± 3.53, 310.1 ± 14.14, 273.0 ± 2.32 and 295.0 ± 7.07. There was a significant increase in the weights of the rats after administration of marijuana (p-value = 0.004).

In Table 2 and Figure 2 below, the mean and standard deviation of calcium for Group B, Group C and Group D recorded 8.92 ± 0.45, 9.77 ± 1.16 and 10.53 ± 0.74 respectively when compared with control which recorded 8.22 ± 0.44 with a p-value of 0.000. This shows that there was a significant change in all the groups when compared with control (p ˂ 0.05).
The mean and standard deviation of inorganic phosphate for Group B, Group C and Group D recorded 4.85 ± 0.39, 5.25 ± 0.39 and 5.60 ± 0.43 respectively when compared with control which recorded 4.36 ± 0.31 with a p-value of 0.000. This shows that there was a significant change in all the groups when compared with control (p ˂ 0.05).
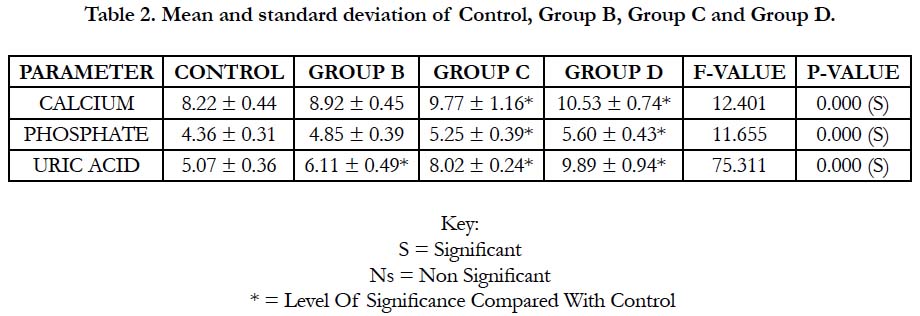
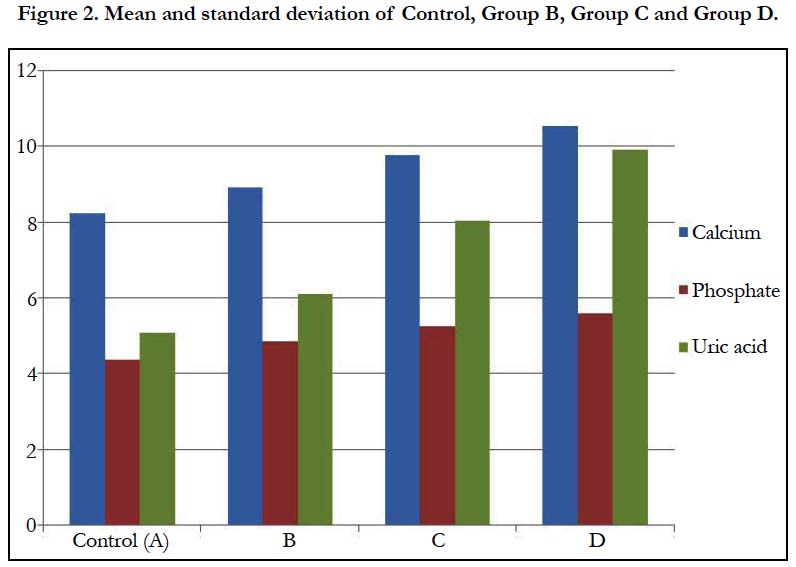
The mean and standard deviation of uric acid for Group B, Group C and Group D recorded 6.11±0.49, 8.02±0.24 and 9.89±0.94 respectively when compared with control which recorded 5.07±0.36 with a p-value of 0.000. This shows that there was a significant change in all the groups when compared with control (p ˂ 0.05).
Discussion
Calcium test measures the amount of Calcium in the blood, not the calcium in the bones. The body needs it to build and fix bones and teeth, help nerves work, make muscles contraction, help blood clot, and help the heart to work. Calcium test screens for problems with the parathyroid glands or kidneys, certain types of cancers and bone problems, inflammation of the pancreas (pancreatitis), and kidney stones. Same goes to uric acid and inorganic phosphate. In this study, it was observed that the test groups (the groups exposed to marijuana) had significantly increased values as compared to the control. This is agrees with the work carried out by Ebuehi et al., [32]. In table 1, it was recorded that the level of calcium on the test group B (8.92 ± 0.45), group C (9.77 ± 1.16), group D (10.53 ± 0.74) shows a significant increase as compared with the control (8.22 ± 0.44). This may be due to parathyroid disease, lung disease and cancers. Granulomatous diseases such as tuberculosis are lung diseases that can cause vitamin D levels to rise. Hence causes more calcium absorption which increases the calcium level in the blood, this is in concordance with the work of Marvin and Gilbert [33], who reported increase of calcium in marijuana users and attributed the increase to the effect marijuana has on the bone. The uric acid levels of the test group B (6.11 ± 0.49), group C (8.02 ± 0.24), group D (9.89 ± 0.94) shows a significant increase as compared with the control (5.07 ± 0.36). This may occur when the kidneys do not eliminate uric acid efficiently [32]. Marijuana has been implicated in deteriorative changes in the kidney and this can impair the kidney to properly function, and hence the kidney cannot eliminate uric acid efficiently, a possible reason for the increase in plasma uric acids in marijuana treated rats. This is in cognizance with the works of Wardener [34], who reported increase in uric acids and attributed the increase to renal dysfunction associated with marijuana use. The phosphate levels of the test group B (4.85 ± 0.39), group C (5.25 ± 0.39), group D (5.60 ± 0.43) showed a significant increase as compared with the control (4.36 ± 0.31). There was an increase in weight of the different rat after experiment, compared to the weight before experiment. The kidneys helps control the amount of phosphate in the blood [32]. Extra phosphate is filtered by the kidneys and passes out of the body in the urine. The high level of phosphate in the blood is usually caused by a kidney problem. This finding is in agreement with the work of Hubbard [35].
In table 2, group B, C and D were increased respectively as compared with the control. This indicates that as the doses are increased, the mean values increased as well. This is seen in table 2 with a p-value of 0.000. This shows that as the dosage increase, the effects on the individual rat also increased.
Conclusion
It was observed in this study that marijuana had a high effect on the calcium, phosphate and uric acid of the rats used as well as on the weights of the rats administered with marijuana. The effects of marijuana on the levels of calcium, uric acid and phosphates were increased as the dosages were being increased. Marijuana therefore had significant changes (increase) on the weights of the rats administered with marijuana.
References
- Timberlake DS. A comparison of drug use and dependence between blunt smokers and other cannabis users. Subst Use Misuse. 2009;44(3):401-15. doi: 10.1080/10826080802347651. PubMed PMID: 19212929.
- Mehmedic Z, Chandra S, Slade D, Denham H, Foster S, Patel AS, et al. Potency trends of Δ9‐THC and other cannabinoids in confiscated cannabis preparations from 1993 to 2008. J Forensic Sci. 2010 Sep;55(5):1209-17. doi: 10.1111/j.1556-4029.2010.01441.x. PubMed PMID: 20487147.
- Rockville MD. U.S. Department of Health and Human Services, Substance Abuse and Mental Health Services Administration. Cent Behav Health Stat Qual. 2014.
- Miech RA, Johnston LD, O’malley PM, Bachman JG, Schulenberg JE. Monitoring the Future national survey results on drug use, 1975-2015: Volume I, Secondary school students.
- Johnson BA. Psychopharmacological effects of cannabis. British journal of hospital medicine. Br J Hosp Med. 1990 Feb;43(2):114-6. PubMed PMID: 2178712.
- Shufman E, Lerner A, Witztum E. Depersonalization after withdrawal from cannabis usage. Harefuah. 2005 Apr;144(4):249-51. PubMed PMID: 15889607.
- Hall W, Pacula RL. Cannabis use and dependence: public health and public policy. Cambridge university press; 2003 Nov 28.
- Mary Lynn Mathre RN, editor. Cannabis in medical practice: A legal, historical and pharmacological overview of the therapeutic use of marijuana. McFarland; 2012 Nov 12.
- Riedel G, Davies SN. Cannabinoid function in learning, memory and plasticity. Handb Exp Pharmacol. 2005;(168):445-77. PubMed PMID: 16596784.
- Barceloux DG. Medical toxicology of drug abuse: synthesized chemicals and psychoactive plants. John Wiley & Sons; 2012 Mar 20.
- [11]. Borges G, Bagge CL, Orozco R. A literature review and meta-analyses of cannabis use and suicidality. J Affect Disord. 2016 May;195:63-74. doi: 10.1016/j.jad.2016.02.007. PubMed PMID: 26872332.
- van Holst RJ, Schilt T. Drug-related decrease in neuropsychological functions of abstinent drug users. Curr Drug Abuse Rev. 2011 Mar;4(1):42-56. PubMed PMID: 21466500.
- Straub DA. Calcium supplementation in clinical practice: a review of forms, doses, and indications. Nutr Clin Pract. 2007 Jun;22(3):286-96. PubMed PMID: 17507729.
- Carl AB, Edward RA. Tietz fundamentals of clinical chemistry. Saunders an imprint of Elsevier. 2008:496-507.
- Bolarin DM. Bolarin’s Aids to Chemical pathology. Q & A Publications. 2010.
- Springate JE. Additional causes of hypercalcemia in infants. Am Fam Physician. 2004 Jun 15;69(12):2766. PubMed PMID: 15222642.
- Navarro JF, Teruel JL, Montalban C, Gallego N, Ortuno J. Hypercalciuria secondary to chronic hypophosphatemia. Miner Electrolyte Metab. 1994;20(5):255-8. PubMed PMID: 7700212.
- Elisaf M, Milionis H, Siamopoulos KC. Hypomagnesemic hypokalemia and hypocalcemia: clinical and laboratory characteristics. Miner Electrolyte Metab. 1997;23(2):105-12. PubMed PMID: 9252977.
- Rose BD, Post TW, Narins R. Clinical physiology of acid-base and electrolyte disorders. New York: McGraw-Hill; 2001 Jan 12.
- Tausche AK, Unger S, Richter K, Wunderlich C, Grässler J, Roch B, et al. Hyperuricemia and gout: diagnosis and therapy. Internist (Berl). 2006 May;47(5):509-20. PubMed PMID: 16586130.
- Choi HK, Atkinson K, Karlson EW, Willett W, Curhan G. Purine-rich foods, dairy and protein intake, and the risk of gout in men. N Engl J Med. 2004 Mar 11;350(11):1093-103. PubMed PMID: 15014182.
- Schrauzer GN. Lithium: occurrence, dietary intakes, nutritional essentiality. J Am Coll Nutr. 2002 Feb;21(1):14-21. PubMed PMID: 11838882.
- Pak CY. Medical stone management: 35 years of advances. J Urol. 2008 Sep;180(3):813-9. doi: 10.1016/j.juro.2008.05.048. PubMed PMID: 18635234.
- Borghi C, Verardi FM, Pareo I, Bentivenga C, Cicero AF. Hyperuricemia and cardiovascular disease risk. Expert Rev Cardiovasc Ther. 2014 Oct;12(10):1219-25. doi: 10.1586/14779072.2014.957675. PubMed PMID: 25192804.
- Howard SC, Jones DP, Pui CH. The tumor lysis syndrome. N Engl J Med. 2011 May 12;364(19):1844-54. doi: 10.1056/NEJMra0904569. PubMed PMID: 21561350.
- Dehghan A, Van Hoek M, Sijbrands EJ, Hofman A, Witteman JC. High serum uric acid as a novel risk factor for type 2 diabetes. Diabetes Care. 2008 Feb;31(2):361-2. PubMed PMID: 17977935.
- Kaplan A, Jack R, Opheim KE, Toivola B, Lyon AW, Kahn SE. Clinical chemistry: interpretation and techniques. Malvern: Williams & Wilkins; 1995.
- Walton RJ, Bijvoet OL. Nomogram for derivation of renal threshold phosphate concentration. Lancet. 1975 Aug 16;2(7929):309-10. PubMed PMID: 50513.
- Sherwood L. Human physiology: from cells to systems. Cengage learning; 2015.
- World Gazetteer. Population of Cities, news, divisions. 2007.
- Adekomi AT. Neurotoxic Effects of Aqueous Leaf Extract of Cannabis Sativa On The Visual Cortex Of Adult Wistar Rats. Trop J Health Sci. 2011 Jul;18(2):44-49.
- Ebuehi OA, Akinwande AI, Famuyiwa OO, Uzodinma EO, Adebayo OA, Onwumere OA, et al. Effect of marijuana smoking on blood chemistry and serum biogenic amines concentrations in humans. Niger J Health Biomed Sci. 2005;4(1):20-4.
- Reitman S, Frankel S. A colorimetric method for the determination of serum glutamic oxalacetic and glutamic pyruvic transaminases. Am J Clin Pathol. 1957 Jul;28(1):56-63. PubMed PMID: 13458125.
- De Wardener HE. The kidney: An outline of normal and abnormal structure and function. Churchill Livingstone; 1973.
- Hubbard JR, France SE, Onaivi E. Marijuana medical implication. Am Fam Physician J. 1999;1:12-15.


