Myelin Area and Axon Diameter Relation in Renal Nerve Myelinated Fibers of Acute and Chronic Diabetic Rats
Sato KL1#, Fazan FS2#, Sanada LS3#, Ferreira Rda S4#, Castania JA5, Salgado HC5, Fazan VPS4,6*
1 Professor, Department of Physical Therapy, José Aloísio de Campos, Federal University of Sergipe (UFS), Av. Marechal Ronson s/n, Aracaju, Sergipe, Brazil.
2 Department of Physiology, Paulista School of Medicine, Federal University of São Paulo (UNIFESP), Rua Botucatu, São Paulo, Capital, Brazil.
3 Department of Physical Therapy, State University of Santa Catarina (UESC), Rua Pascoal Simone 358, Florianópolis Santa Catarina, Brazil.
4 School of Medicine of Ribeirão Preto (FMRP-USP), Department of Neurosciences and Behavioral Sciences, University of São Paulo, Ribeirão Preto, São Paulo, Brazil.
5 School of Medicine of Ribeirão Preto (FMRP-USP), Department of Physiology, University of São Paulo, Ribeirão Preto, São Paulo, Brazil.
6 School of Medicine of Ribeirão Preto (FMRP-USP), Department of Surgery and Anatomy, University of São Paulo, Ribeirão Preto, São Paulo, Brazil.
# Indicates that authors contributed equally to the manuscript.
*Corresponding Author
Valéria Paula Sassoli Fazan, M.D., Ph.D,
Department of Surgery and Anatomy, Medical School of Ribeirão Preto (USP),
Av. Bandeirantes 3900, 14049-900, Ribeirão Preto, São Paulo, Brazil.
Tel/Fax: + 55 16 3633-0017
E-mail: vpsfazan@yahoo.com.br
Received: August 13, 2018; Accepted: August 22, 2018; Published: August 23, 2018
Citation: Sato KL, Fazan FS, Sanada LS, Ferreira Rda S, Castania JA, Fazan VPS, et al., Myelin Area and Axon Diameter Relation in Renal Nerve Myelinated Fibers of Acute and Chronic Diabetic Rats. Int J Anat Appl Physiol. 2018;S1:001:1-7. doi: dx.doi.org/10.19070/2572-7451-S101001
Copyright: Fazan VPS© 2018. This is an open-access article distributed under the terms of the Creative Commons Attribution License, which permits unrestricted use, distribution and reproduction in any medium, provided the original author and source are credited.
Abstract
The positive relation between the axon size and its respective myelin sheath has long been known. We tested the hypothesis that the expected correlation between myelin sheath area (Mya) and the axonal diameter (Dax) of myelinated fibers in the renal nerves is altered by diabetes, using a regression analysis study. Male Wistar rats were used after 15 days or 12 weeks of diabetes induction by a single injection of streptozotocin (STZ i.v.). Control rats received vehicle. Insulin-treated animals received a single subcutaneous injection of insulin on a daily basis. Then, the left renal nerves were dissected, removed and prepared for light microscopy. Morphometry of the myelinated fibers was carried out with computer software. The Mya and the Dax of all myelinated fibers in each nerve were automatically measured. Regression lines were calculated for all nerves in each group. Differences between the regression lines were tested for slope and intercept as well as differences between the correlation coefficients. The regression lines were coincident between the three acute groups. Also, there was a coincidence between the regression lines from control and insulin-treated chronic groups. The chronic diabetic group showed a significant slope reduction on the regression lines, as well as a reduced correlation coefficient when compared to all other experimental groups. These results show that there are morphological alterations on the renal nerve myelinated fibers in STZ induced diabetes consisting of axonal atrophy and/or demyelinating-remyelinating processes. These results may be useful in the understanding of the renal dysfunctions found in diabetic nephropathy.
2.Abbreviations
3.Introduction
4.Materials and Methods
4.1 Experimental Groups
4.2 Renal Nerve Identification and Recording
4.3 Nerve Histology and Myelinated Fibers Morphometry
4.4 Data Analysis and Statistical Analysis
5.Results
5.1 Metabolic and Physiological Data
5.2 Myelinated Fibers Counting and Axon and Myelin Sheath Morphometry
5.3 Relationship between Axonal Diameter and Myelin Sheath Area
6.Discussion
7.Acknowledgements & Declarations
8.References
Keywords
Experimental Diabetes; Renal Nerve; Myelin Sheath; Regression Lines; Diabetic Renal Dysfunction.
Abbreviations
Mya: Myelin Sheath Area; Dax: Axonal Diameter; STZ: Streptozotocin; PAP: Pulsatile Arterial Pressure; SEM: Standard Error of Mean; MAP: Mean Arterial Pressure; HR: Heart Rate.
Introduction
The relationship, ratios and proportions between three important structural variables in myelinated nerve fibers - axon size, myelin thickness and intermodal length - have interested and is being investigated by neuroscientists for more than a century [1]. The evaluation of the myelin sheath thickness and its relation to the axon diameter in the peripheral nerve has gained attention, since it allows discriminating the pathological condition of a peripheral nerve myelinated fiber from a morphologically-physiologically intact nerve [2-4]. In general, for normal myelinated fibers, linear correlation between the myelin cross sectional area and the circumference of the axon is expected and described as normal [1], despite some reports of a non-linear ratio of axon diameter to myelin sheath thickness [5].
Generally, axon diameter is thought to be the most important parameter of conduction velocity [6]. Gillespie and Stein [7] demonstrated that, in mammalian peripheral nerve fiber atrophy, the change in conduction velocity is similar to or somewhat less than the change in axon diameter. These authors also showed that there was a decrease in the slope of the fitted lines for axon size and total fiber size with increasing time after nerve injury. They also showed that conduction velocity was more closely related to axon diameter than to total fiber diameter during the course of atrophy [7].
Diabetes is a metabolic disease coursing with multiple organs damage being the peripheral neuropathy one of the most common complications of the disease, occurring in up to 45-50% of diabetic patients [8]. Among other complications of diabetes, the prevalence of diabetic nephropathy is described as only 20% [8-10], compared to the high percentage of the neuropathy.
Since 1960’s it has been clearly established, that an axonal loss occurs in the peripheral nerves altered by diabetes [11-13], affecting myelinated and unmyelinated axons [14], being more evident in the distal segments of the nerves [15].
Alterations in the peripheral nervous system of genetic or experimentally induced models of diabetes have been extensively investigated and a large amount of data was obtained from the streptozotocin (STZ)-induced diabetic rat model [16]. In addition, it is well documented that not only the metabolic alterations but also axonal atrophy of large myelinated fibers can be corrected by means of the insulin treatment [17-19].
Despite the large amount of literature on renal structure alterations experimental diabetes [20-22], the morphology of the renal nerves and its myelinated fibers alterations to the diabetic neuropathy remains to be closely investigated. Thus, we tested the hypothesis that the renal nerves myelinated fibers from diabetic animals do not show the expected relation between the myelin sheath area and the axonal diameter by means of regression analysis.
Diabetes Induction and Insulin Treatment Experiments were performed on male adult Wistar rats, from the animal care facility of the Campus of Ribeirão Preto (University of São Paulo), weighing 190-210g at the beginning of the experiments, housed in plastic cages with free access to tap water and rat chow throughout the experiment. The animals were born and raised in a carefully regulated environment maintained at 21°C - 23°C, 40% - 70% relative air humidity, and a 12/12 h light/dark cycle. All procedures adhered to “The ARRIVE guidelines: Animal Research: Reporting In Vivo Experiments, originally published in PLoS Biology, June 2010” and were approved by the Institutional Ethics Committee for Animal Research (CETEA-Comitê de Ética em Experimentacão Animal, protocol number 001/2004). A conscious effort was done to minimize the number of animals used.
At the beginning of the experiments, rats were randomly assigned to 6 experimental groups: acute (N=10) and chronic control (N=10), acute (N=10) and chronic diabetic (N=10) and acute (N=8) and chronic (N=8) treated animals. Diabetic rats received a single intravenous (penile vein) injection of STZ (40mg/kg, Sigma Chemical Co., St. Louis, MO, USA) 15 days (acute) or 12 weeks (chronic) before the nerve biopsy. Control animals received vehicle (citrate buffer, pH5.2) and confirmed diabetic animals from the treated group received a single subcutaneous injection of 9 IU/kg of NPH (highly purified mixed) insulin (Biolin U-100, Biobra´s) in the evening, always at the beginning of the dark cycle, from the 3rd day after STZ injection until the final experimental day. The animals were weighed every 3 days and, when necessary, the insulin dose was adjusted according to the weight gain.
On the STZ injected animals, the onset of diabetes occurred rapidly and was identified by polydipsia and polyuria. Non-fasting blood glucose (mg/dl) was determined with a glucose analyzer (Beckman Instruments, Inc., Brea, CA, USA) 3 days after STZ injection and immediately before the experiments, in blood droplets collected from an incision at the tip of the tail. The animals were considered diabetic when the blood glucose levels were higher than 350 mg/dl. Details of this experimental model of diabetes induction and insulin treatment were previously described [10, 23-27].
On the final experimental day (15 days or 12 weeks after STZ or citrate buffer injection), animals were anesthetized with sodium thiopenthal (40 mg/kg, i.p.) and a polyethylene catheter was inserted into the right carotid artery and connected to a pressure transducer (Statham PB23Gb) for direct measurement of pulsatile arterial pressure (PAP, expressed as mmHg). Heart rate (HR, expressed as beats per minute - bpm) was estimated from the acquired PAP track. Left extrinsic renal nerves (the major branch from the aortorenal plexus entering the kidney) were exposed and their activity was recorded simultaneously with PAP as previously described [10, 28]. The characteristic recording pattern of the sympathetic nerve activity throughout the cardiac cycle was obtained for all nerves studied.
The methods for dissection [10, 28] and histological preparation of the nerves were described elsewhere [27, 29, 30]. Briefly, approximately 0.5 cm of the nerve was removed and fixed overnight in a 2.5% glutaraldehyde solution in 0.1 M cacodilate buffer, pH 7.4. Nerve segments were postfixed in 1% OsO4 in cacodilate buffer solution for two hours in room temperature, washed in cacodilate buffer and dehydrated in graded ethanol (from 25 to 100% concentrated solutions, 5 minutes in each solution). Before embedding in epoxy resin (EMbed 812®, Electron Microscopy Sciences, Hatfield, PA, USA), the nerves were oriented in silicone molds to permit semi-thin (0.5 μm thick) transverse sections of the fascicles and fibers, which were stained with 1% toluidine blue and observed under the oil immersion lens of an Axiophot II photo-microscope (Carl Zeiss, Jena, Germany). The fascicle images were transmitted via a digital camera (TK- 1270, JVC, Victor Company of Japan, Ltd., Tokyo, Japan) to an IBM PC where they were digitized. With the aid of image analysis software (KS 400, Kontron 2.0, Eching Bei Müchen, Germany) the total numbers of myelinated fibers present in each fascicle were identified by visual inspection and counted. For each myelinated axon present in the digitized images, both axonal diameters (defined by the inner limit of the myelin lamellae) and total fiber diameters (defined by the outer limit of the myelin lamellae) were automatically measured and the myelin sheath area was calculated for each myelinated fiber measured. The total area of the endoneurial space of each nerve fascicle was investigated thus including 100% of myelinated fibers from each nerve in this study.
Metabolic and physiological data are presented as mean ± standard error of mean (SEM). The Kolmogorov-Smirnov test was applied to verify the normal distribution for weight, biochemical and physiological data, using Sigma Stat software, version 3.01 (Jandel Scientific), followed by the Levene test of medians for variance equivalence. Body weight, blood glucose level, mean arterial pressure (MAP - obtained from the PAP recordings, using the LabChart® software, AD Instruments, USA) and heart rate (HR) data were compared between the injection day, 3rd day after injection and the final experimental day by the unpaired Student’s t-test and among groups by the one-way ANOVA, followed by Holm-Sidak post-test, between experimental times in the same group, when a normal distribution was found. Otherwise, parameters in different groups were compared by the nonparametric Mann-Whitney test and by the one-way ANOVA on Ranks, followed by Dunn’s post-test between experimental times.
The relationship between axonal diameter (Dax) and myelin sheath area (Mya) was investigated by plotting the data on scatter diagrams (y=Dax and x=Mya), using the Sigma Plot® 13 (Systat Software Inc. (SSI), San Jose, California, USA). A regression line was fitted by the least squares method for the plotted data of each nerve segment for each experimental group as described [31]. The equation of the straight line relating these two variables was: y = mx+b, where b is the intercept (linear coefficient) and m is the slope (angular coefficient). All linear regression lines were tested for normality using the Shapiro-Wilk test. A constant variance test was also applied to each regression.
The regression lines were tested for both slope and intercept. The slope (m in the equation y = mx+b) represents the change in the mean of the distribution of y produced by a unit change in x. If y is a linear function of x, then the coefficient of x is the slope of the line created by plotting the function.
The Pearson product moment correlation (r, to measure the degree of association between the two investigated variables) and the coefficient of determination (r2, to measure the proportion of the variance in the dependent variable that is predictable from the independent variable) were calculated for each scatter diagrams [32].
The comparison between the slopes (sum of squares method) of the obtained regressions was used together with the comparison between the intercept to test the hypothesis of the regression lines being coincident between nerve segments from different experimental groups.
Body weight and blood glucose level for acute and chronic experimental groups are shown in Figures 1 and 2 respectively. No differences were observed either on body weight or blood glucose level on the injection day between animals allocated for different experimental times. Three days after the injections, body weight was not different between experimental groups but STZinjected animals showed high blood glucose level compared to vehicle injected animals on acute and chronic groups. Body weight increased significantly on acute (Figure 1) and chronic (Figure 2) animals throughout the experiments and was higher compared to injection day and 3 days after injection on acute (15 days) and chronic (12 weeks) diabetic animals. Chronic diabetic animals showed smaller body weight compared to controls and insulintreated animals 12 weeks after STZ injection (Figure 2). Blood glucose level on insulin-treated animals was lower compared to diabetic animals and similar to control values on both acute (Figure 1) and chronic (Figure 2) groups on the final experimental day (15 days or 12 weeks).
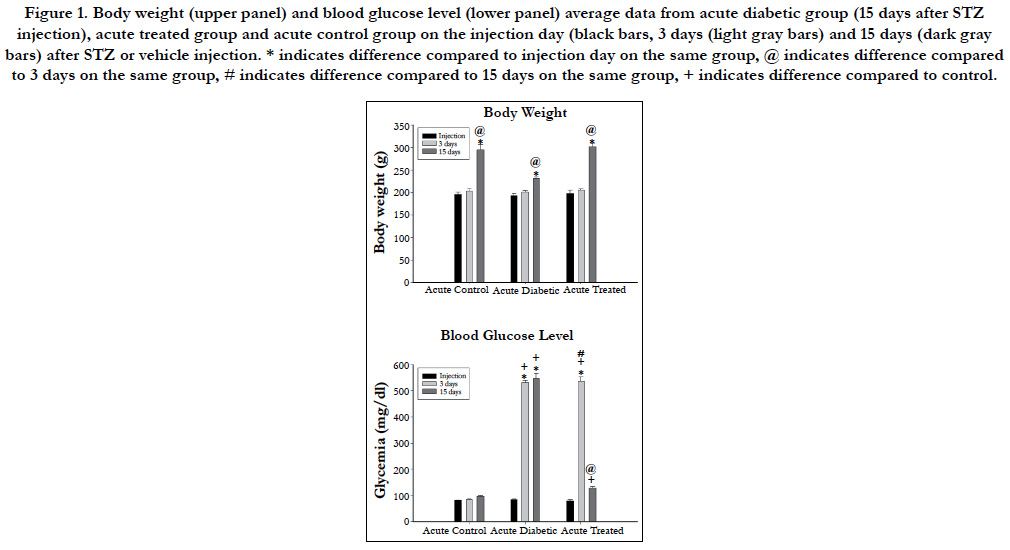
Figure 1. Body weight (upper panel) and blood glucose level (lower panel) average data from acute diabetic group (15 days after STZ injection), acute treated group and acute control group on the injection day (black bars, 3 days (light gray bars) and 15 days (dark gray bars) after STZ or vehicle injection. * indicates difference compared to injection day on the same group, @ indicates difference compared to 3 days on the same group, # indicates difference compared to 15 days on the same group, + indicates difference compared to control.
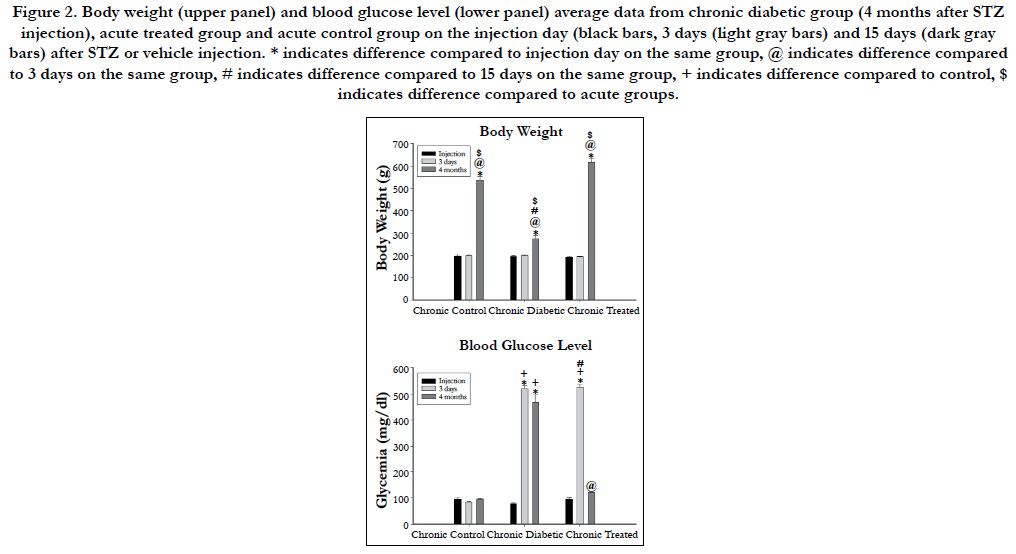
Figure 2. Body weight (upper panel) and blood glucose level (lower panel) average data from chronic diabetic group (4 months after STZ injection), acute treated group and acute control group on the injection day (black bars, 3 days (light gray bars) and 15 days (dark gray bars) after STZ or vehicle injection. * indicates difference compared to injection day on the same group, @ indicates difference compared to 3 days on the same group, # indicates difference compared to 15 days on the same group, + indicates difference compared to control, $ indicates difference compared to acute groups.
Mean arterial pressure (MAP) on the experimental day was significantly lower in both diabetic groups (70 ± 7 mmHg versus 111 ± 3 mmHg for acute and chronic diabetic groups, respectively) compared to controls (96 ± 2 mmHg versus 140 ± 6 mmHg for acute and chronic diabetic groups, respectively) and to treated (87 ± 3 versus 116 ± 6 mmHg for acute and chronic, respectively) animals (One-way ANOVA, p < 0.001), and also on acute compared to chronic diabetic groups (Mann-Whitney test, p<0.001). Chronic controls showed higher MAP than acute controls (unpaired student’s t-test, p<0.001).
Heart rate (HR) was lower on acute (291 ± 20 bpm) and chronic (299 ± 7bpm) diabetic groups, compared to controls (315 ± 10 bpm versus 338 ± 7 bpm for acute and chronic diabetic groups, respectively) and treated (307 ± 5 bpm versus 327 ± 4 bpm for acute and chronic groups, respectively) groups (One=way ANOVA on Ranks, p = 0.007). Also, chronic controls and chronic treated groups showed higher HR than chronic diabetic animals but this was not observed between acute groups.
The histological analysis of the myelinated fibers of the renal nerves in rats did not differ from those described previously [10, 28]. Differences between groups, when present, were not visually identified. The total numbers of myelinated fibers present in all nerves from all experimental groups are shown in Figure 3. This was a significant decrease of this number in the chronic diabetic group when compared to all other groups. The average myelinated axon diameter was slightly increased in the acute diabetic animals (2.23 ± 0.11 μm) compared to acute controls (1.88 ± 0.07 μm) and acute treated (2.18 ± 0.15 μm) animals. Data for myelin sheath area followed this trend and reached significant difference (One-way ANOVA, p = 0.016) being larger on acute diabetic (10.67 ± 1.00 μm2) compared to controls (8.06 ± 0.64 μm2) and to insulin-treated (9.90 ± 1.02 μm2) acute groups. For chronic diabetic groups, a reduction on both, myelinated axon diameter (2.06 ± 0.09 μm) and myelin sheath area (7.94 ± 0.50 μm2) was observed compared to control (2.60 ± 0.23 μm for axon diameter and 13.90 ± 1.69 μm2 for myelin sheath area) and insulin-treated (2.60 ± 0.27 μm for axon diameter and 15.01 ± 3.76 μm2 for myelin sheath area) animals (One-way ANOVA, p = 0.017 for axon diameter and p < 0.001 for myelin sheath area).
The scatter diagrams for Dax and Mya, together with the regression lines (Figure 3), showed that, as Mya increased in value, there was an increase the Dax values, indicating that this variable pair tends to increase together, independently of the experimental group or time.
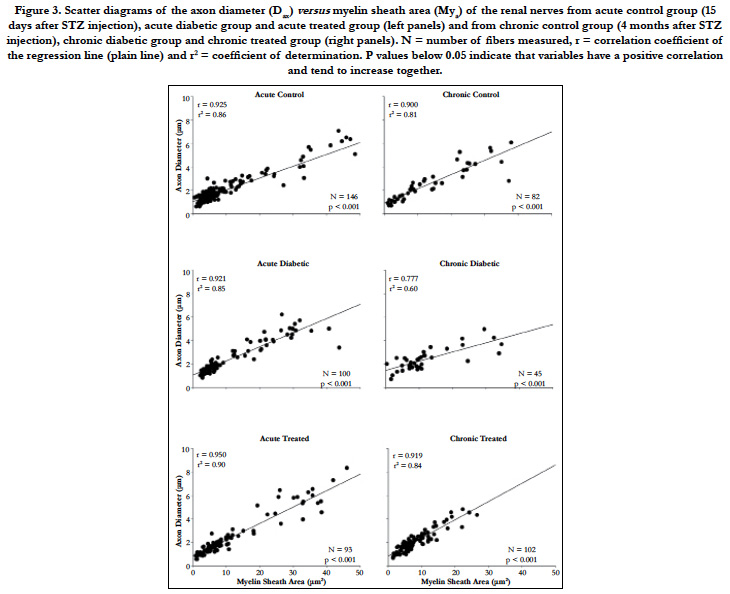
Figure 3. Scatter diagrams of the axon diameter (Dax) versus myelin sheath area (Mya) of the renal nerves from acute control group (15 days after STZ injection), acute diabetic group and acute treated group (left panels) and from chronic control group (4 months after STZ injection), chronic diabetic group and chronic treated group (right panels). N = number of fibers measured, r = correlation coefficient of the regression line (plain line) and r2 = coefficient of determination. P values below 0.05 indicate that variables have a positive correlation and tend to increase together.
Figure 3 shows that the chronic diabetic line increases more gradually in slope, start at a higher point and terminate at a lower level, indicating that some smaller myelinated fibers have thick myelin sheath (characteristic of axonal atrophy) while larger fibers have thin sheaths (characteristic of a demyelinating-remyelinating process).
The comparison of the slope between the three acute groups showed no significant difference as the comparison between the curves intercept. Hence, the regression lines for the renal nerves of these groups were coincident, showing a constant relationship between the myelin sheath area and the axonal diameter.
The comparison of the slope between the three chronic groups showed a significant difference between the regressions, so that they were not parallel and, by definition, not coincident.
As shown in Figure 3, the chronic diabetic renal nerves scatter plot showed a concentration of the Mya values around 10 μm with Dax values between 1-4 μm. It is known that the disposition of the x values plays an important role in the least squares fit, and the slope is more strongly influenced by the remote values of x [33]. Since there are almost no remote values for Mya in the chronic diabetic scatter plot, the slope is smaller than that for the chronic control and chronic treated animal’s regression line.
The Pearson product moment correlation (r) and the coefficient of determination (r2) are also shown for each regression in Figure 3. Both values are smaller on the chronic diabetic group compared to all other acute and chronic groups.
Discussion
This study confirms that chronic experimental diabetes alters morphometric parameters of renal nerves myelinated fibers, particularly those related to these fibers conduction velocity. We suggest that the renal nerve neuropathy may play a role in the development of diabetic nephropathy.
The experimental model used in this study has been used in our laboratory for decades [19, 23-27] and has proven to be a good experimental model of acute and chronic diabetes mellitus, not only for describing the morphological alterations on several peripheral nerves due to diabetes mellitus [16], but also to investigate physiological alterations on nerve function and cardiovascular regulation deficits in diabetes mellitus [26, 27].
In this model, high blood glucose levels were associated with weight loss, polydipsia and polyuria. These signs and symptoms confirmed the efficacy of a single injection of STZ in inducing diabetes mellitus in rats. Also, the reduced MAP in diabetic rats was observed, confirming previous results from our laboratory [23, 26] and others [34, 35].
The decrease in MAP in acute and chronic diabetic rats, as described in this study and others [10, 23, 24, 26, 27], could be related to a decreased cardiac output due to the hypovolemia caused by osmotic diuresis and negative sodium balance [36], or even a myocardial dysfunction in consequence of a reduced myocardial contractility [37]. A peripheral resistance decrease might also be a part of the reduced MAP [38]. Nevertheless, the possibility of changes in MAP due to poor baroreceptor information reaching the central nervous system cannot be excluded since baroreceptor dysfunction was previously described in this experimental model of diabetes [26, 27].
Nerve morphometry is used to describe biological regularities and point out their dependence. Even small deviation from normal can indicate developmental tendencies or reveal pathological processes [39]. The determination of the myelin sheath-axon ratios can be used not only for describing pathological processes in peripheral nerves but also as a measure of the nerve damage progression [39].
We performed an automatic evaluation of axon diameter and myelin sheath area. This technique has the advantage of eliminating the subjective analysis and interpretation of the examiner and allows a precise determination of both these parameters.
In experimental models of nerve fiber regeneration [2] it was shown a deviation of the regression line for the ratio between axon diameter and myelin sheath thickness as compared to the normal regression lines, even when there is a considerable scatter in individual fibers in normal nerves. After the crush injury, those authors showed that axons had grown thick whereas the myelin sheaths of the largest nerve fibers remained relatively thin. On the other hand, a large proportion of nerve fibers had an extremely thin axon and the myelin sheath was relatively thick. Previous findings from our laboratory [31] showed that a systemic disease (hypertension) caused an alteration of the axon-myelin sheath relation in autonomic nerves. Hypertensive animals’ nerves showed a change on the slope of the calculated regression, showing that the regression line rose more gradually than the normal nerve lines. This is similar to observations in regenerated nerve fibers [2] and is now being described for the renal nerve fibers for the first time in an experimental model of diabetes.
Schröder [2] calculated regression lines for myelin sheath thickness versus axon diameter and observed that the slope of the calculated regression lines for the rose more gradually than did the slope of the line for the normal fibers. Due to a proportion of thin axons with relatively thick myelin sheaths the regression line started at a higher point, and due to a reduction of the myelin sheath thickness of the thicker axons it terminated at a lower level. The correlation coefficients (r) observed by Schröder [2] for the regenerated nerve fibers tended to be smaller than for the normal nerves and this was the case for our results on chronic diabetic rats.
Sanders [40] showed that in regenerating nerve fibers the decrease in fiber diameter in the proximal nerve segment is accompanied by an absolute increase in their myelin sheath thickness. This takes place first of all without any alteration in the total diameter of the fibers concerned, the increase in thickness of the myelin compensating for the decrease in axon diameter. This agrees with the observations of Gillespie and Stein [7] on the relation between conduction velocity impairment and reduction in fiber diameter. In our morphometric observations of the renal nerves, fibers with small axons and thick myelin sheaths were observed. The renal nerve moprhometry for diabetic nerve fibers evidenced here agree with our previous results of a shift on the G-ratio distribution towards the axon atrophy values [10] associated with the shift on the myelinated fibers distribution toward smaller vales.
Despite advances on the pathogenesis of the glomerular lesions in diabetic nephropathy, there is still a lot to be understood. Our results indicate that a neuropathy of the extrinsic renal nerve could impair glomerular function very early in this diabetes and could be involved, at least in part, in some degree to the development of the diabetic nephropathy.
Finally, it is important to mention that several authors demonstrated that insulin treatment prevents or corrects the axonal atrophy caused by STZ-diabetes in the large myelinated fibers [18, 41-43] as well as the axonal diameter and their distributions [19]. Our results confirmed these previous findings, hence the regression line from diabetic animals are coincident to those of controls.
Thus, the present study adds useful information for further investigations on morphological basis of nerve function in diabetes and also supports the possible role of the renal nerve neuropathy on the development of the diabetic nephropathy.
Acknowledgements & Declarations
The authors thank Mr. Antônio Renato Meirelles e Silva, Experimental Neurology Laboratory and Ms. Maria Tereza P. Maglia, Electron Microscopy Laboratory, School of Medicine of Ribeirão Preto, for their excellent technical support. GRANTS: Grant sponsor: FAPESP (Fundação de Amparo à Pesquisa do Estado de São Paulo); Grant numbers 2004/01390-8, 2009/50389- 6, 2009/16748-9, 2010/12518-6, 2012/00321-0, 2013/20549-7 and 2018/10474-3; Grant sponsor: CNPq (Conselho Nacional de Pesquisa e Tecnologia); Grant number: 301333/2017-3; Grant Sponsor: FAEPA (Fundação de Apoio ao Ensino e Pesquisa do Hospital das Clínicas da Faculdade de Medicina de Ribeirão Preto); Grant number: 393/2005. There is no conflict of interest to declare.
References
- Berthold C. Morphology of normal peripheral axon. In: Waxman SG, Kocsis JD, Stys PK, editors. The Axon - Structure, Function and Pathophysiology. New York: Oxford University Press; 1995.
- Schro JM. Altered ratio between axon diameter and myelin sheath thickness in regenerated nerve fibers. Brain Res. 1972 Oct 13;45(1):49-65. PubMed PMID: 4561629.
- Lindemuth R, Ernzerhof C, Schimrigk K. Comparative morphometry of myelinated nerve fibres in the normal and pathologically altered human sural and tibial nerve. Clin Neuropathol. 2002 Jan-Feb;21(1):29-34. PubMed PMID: 11846042.
- Scharpf J, Meirer R, Zielinski M, Unsal M, Ramineni P, Nair D, Siemionow M. A novel technique for peripheral nerve repair. Laryngoscope. 2003 Jan;113(1):95-101. PubMed PMID: 12514390.
- Sunderland S, Roche AF. Axon-myelin relationships in peripheral nerve fibres. Acta Anat (Basel). 1958;33(1-2):1-37. PubMed PMID: 13532246.
- Minwegen P, Friede RL. Conduction velocity varies with osmotically induced changes of the area of the axon's profile. Brain Res. 1984 Apr 9;297(1):105-13. PubMed PMID: 6609740.
- Gillespie MJ, Stein RB. The relationship between axon diameter, myelin thickness and conduction velocity during atrophy of mammalian peripheral nerves. Brain Res. 1983 Jan 17;259(1):41-56. PubMed PMID: 6824935.
- Shaw JE. The epidemiology of diabetic neuropathy. Diabetes Rev. 1999;7:245-52.
- Yagihashi S, Yamagishi SI, Wada R. Pathology and pathogenetic mechanisms of diabetic neuropathy: correlation with clinical signs and symptoms. Diabetes Res Clin Pract. 2007 Sep;77 Suppl 1:S184-9. PubMed PMID: 17462777.
- Sato KL, Sanada LS, da Silva Ferreira R, De Barros MC, de Marco O, Castania JA, et al. Renal nerve ultrastructural alterations in short term and long term experimental diabetes. BMC Neurosci. 2014 Jan 5;15:5. doi: 10.1186/1471-2202-15-5. PubMed PMID: 24387617.
- Chopra JS, Hurwitz LJ, Montgomery DA. The pathogenesis of sural nerve changes in diabetes mellitus. Brain. 1969;92(2):391-418. PubMed PMID: 4182949.
- Greenbaum D, Richardson PC, Salmon MV, Urich H. Pathological observations on six cases of diabetic neuropathy. Brain. 1964 Jun;87:201-14. PubMed PMID: 14188272.
- Thomas PK. Diabetic neuropathy: morphological aspects. Proc R Soc Med. 1967 Feb;60(2):145. PubMed PMID: 6018836.
- Behse F, Buchthal F, Carlsen F. Nerve biopsy and conduction studies in diabetic neuropathy. J Neurol Neurosurg Psychiatry. 1977 Nov;40(11):1072- 82. PubMed PMID: 599355.
- Knopp M, A Rajabally Y. Common and less common peripheral nerve disorders associated with diabetes. Curr Diabetes Rev. 2012 May;8(3):229-36. PubMed PMID: 22283678.
- Fazan VP, de Vasconcelos CA, Valenca MM, Nessler R, Moore KC. Diabetic peripheral neuropathies: a morphometric overview. Int J Morphol. 2010 Mar 1;28(1).
- Jakobsen J. Early and preventable changes of peripheral nerve structure and function in insulin-deficient diabetic rats. J Neurol Neurosurg Psychiatry. 1979 Jun;42(6):509-18. PubMed PMID: 469558.
- Sharma AK, Duguid IG, Blanchard DS, Thomas PK. The effect of insulin treatment on myelinated nerve fibre maturation and integrity and on body growth in streptozotocin-diabetic rats. J Neurol Sci. 1985 Mar;67(3):285-97. PubMed PMID: 3989572.
- Rodrigues Filho OA, Fazan VP. Streptozotocin induced diabetes as a model of phrenic nerve neuropathy in rats. J Neurosci Methods. 2006 Mar 15;151(2):131-8. PubMed PMID: 16125783.
- Seyer-Hansen K, Hansen J, Gundersen HJ. Renal hypertrophy in experimental diabetes. Diabetologia. 1980 Jun;18(6):501-5. PubMed PMID: 7418959.
- Wehner H, Petri M. Glomerular alterations in experimental diabetes of the rat. Pathol Res Pract. 1983 Mar;176(2-4):145-57. PubMed PMID: 6856514.
- O'donnell MP, Kasiske BL, Keane WF. Glomerular hemodynamic and structural alterations in experimental diabetes mellitus. FASEB J. 1988 May;2(8):2339-47. PubMed PMID: 3282959.
- Fazan VP, Salgado HC, Barreira AA. Aortic depressor nerve myelinated fibers in acute and chronic experimental diabetes. Am J Hypertens. 2006 Feb;19(2):153-60. PubMed PMID: 16448885.
- Oliveira FS, Nessler RA, Castania JA, Salgado HC, Fazan VP. Ultrastructural and morphometric alterations in the aortic depressor nerve of rats due to long term experimental diabetes: effects of insulin treatment. Brain Res. 2013 Jan 23;1491:197-203. doi: 10.1016/j.brainres.2012.10.054. PubMed PMID: 23123208.
- Oliveira FS, Amorin MM, Castania JA, Salgado HC, Nessler RA, Fazan VP. Acute experimental diabetes and aortic depressor nerve ultrastructural morphometry: Effects of insulin treatment. Anat Physiol. 2014;4(153):2161-0940.
- do Carmo JM, Huber DA, Castania JA, Fazan VP, Fazan Jr R, Salgado HC. Aortic depressor nerve function examined in diabetic rats by means of two different approaches. J Neurosci Methods. 2007 Mar 30;161(1):17-22. PubMed PMID: 17084904.
- do Carmo JM, Júnior RF, Salgado HC, Fazan VP. Methods for exploring the morpho-functional relations of the aortic depressor nerve in experimental diabetes. J Neurosci Methods. 2011 Jan 30;195(1):30-5. doi: 10.1016/j. jneumeth.2010.11.009. PubMed PMID: 21108968.
- Sato KL, do Carmo JM, Fazan VP. Ultrastructural anatomy of the renal nerves in rats. Brain Res. 2006 Nov 13;1119(1):94-100. PubMed PMID: 16962078.
- Fazan VP, Salgado HC, Barreira AA. A descriptive and quantitative light and electron microscopy study of the aortic depressor nerve in normotensive rats. Hypertension. 1997 Sep;30(3 Pt 2):693-8. PubMed PMID: 9323007.
- Fazan VP, Junior RF, Salgado HC, Barreira AA. Morphology of aortic depressor nerve myelinated fibers in normotensive Wistar–Kyoto and spontaneously hypertensive rats. J Auton Nerv Syst. 1999 Sep 24;77(2-3):133-9. PubMed PMID: 11130957.
- Fazan VP, Salgado HC, dos Reis GC, Barreira AA. Relation between myelin area and axon diameter in the aortic depressor nerve of spontaneously hypertensive rats. J Neurosci Methods. 2005 Oct 30;148(2):130-6. PubMed PMID: 15978670.
- Steel RG, Torrie JH. Principles and procedures of statistics: with special reference to the biological sciences. New York: McGraw-Hill; 1960.
- Montgomery DC, Peck EA, Vining GG. Introduction to linear regression analysis. John Wiley & Sons; 2012 Apr 9.
- Fazan Jr R, Ballejo G, Salgado MC, Moraes MF, Salgado HC. Heart rate variability and baroreceptor function in chronic diabetic rats. Hypertension. 1997 Sep;30(3 Pt 2):632-5. PubMed PMID: 9322994.
- Fazan Jr R, da Silva VJ, Ballejo G, Salgado HC. Power spectra of arterial pressure and heart rate in streptozotocin-induced diabetes in rats. J Hypertens. 1999 Apr;17(4):489-95. PubMed PMID: 10404950.
- Kohler L, Boillat N, Lüthi P, Atkinson J, Peters-Haefeli L. Influence of streptozotocin-induced diabetes on blood pressure and on renin formation and release. Naunyn Schmiedebergs Arch Pharmacol. 1980 Sep;313(3):257-61. PubMed PMID: 7001256.
- Hebden RA, Gardiner SM, Bennett T, MacDonald IA. The influence of streptozotocin-induced diabetes mellitus on fluid and electrolyte handling in rats. Clin Sci (Lond). 1986 Jan;70(1):111-7. PubMed PMID: 3943274.
- Low PA, Walsh JC, Huang CY, McLeod JG. The sympathetic nervous system in diabetic neuropathy: a clinical and pathological study. Brain. 1975 Sep;98(3):341-56. PubMed PMID: 810214.
- Adhami H, Sawatzky KH, Hornung J. Morphometric studies on the relationship between myelin sheath and axon area in the sciatic nerve of adult rats. Anat Anz. 1976;140(1-2):52-61. PubMed PMID: 984461.
- Sanders FK. The thickness of the myelin sheaths of normal and regenerating peripheral nerve fibres. Proc Roy Soc. 1948 Oct 26;135(880):323-57.
- Britland ST, Sharma AK, Duguid IG, Thomas PK. Ultrastructural observations on myelinated fibres in the tibial nerve of streptozotocin-diabetic rats: effect of insulin treatment. Life Support Syst. 1985;3 Suppl 1:524-9. PubMed PMID: 3916617.
- McCallum KN, Sharma AK, Blanchard DS, Stribling D, Mirrlees DJ, Duguid IG, et al. The effect of continuous subcutaneous insulin infusion therapy on morphological and biochemical abnormalities of peripheral nerves in experimental diabetes. J Neurol Sci. 1986 Jun;74(1):55-67. PubMed PMID: 3522807.
- Bhoyrul S, Sharma AK, Stribling D, Mirrlees DD, Peterson RG, Farber MO, et al. Ultrastructural observations on myelinated fibres in experimental diabetes: effect of the aldose reductase inhibitor ponalrestat given alone or in conjunction with insulin therapy. J Neurol Sci. 1988 Jun;85(2):131-47. PubMed PMID: 2968441.


