Allometric and Phylogenic Comparisons of Hematological Parameters between and within Birds and Mammals
Scanes CG
Department of Biological Science, University of Wisconsin Milwaukee, Milwaukee, USA.
*Corresponding Author
Colin G. Scanes
Department of Biological Science, University of Wisconsin Milwaukee, 3209 N. Maryland Avenue, Milwaukee, WI 53211, WI53211, USA.
Tele : 1-414-229-3641
E-mail: scanes@uwm.edu
Received: April 05, 2016; Accepted: June 06, 2016; Published: June 07, 2016
Citation:Scanes CG (2016) Allometric and Phylogenic Comparisons of Hematological Parameters between and within Birds and Mammals. Int J Vet Health Sci Res. 4(4), 123-129.DOI : dx.doi.org/10.19070/2332-2748-1600026
Copyright: Scanes CG © 2016. This is an open-access article distributed under the terms of the Creative Commons Attribution License, which permits unrestricted use, distribution
and reproduction in any medium, provided the original author and source are credited.
Abstract
As has been observed previously, there are no differences between class Mammalia and Aves for either packed cell volume (PCV)/Hematocrit (HCT) or hemoglobin concentrations using a much larger data-base - data from 357 mammalian and 323 avian species. However, the erythrocyte concentrations and size were respectively higher and smaller in mammals. There were marked differences for hematological parameters between taxa within both the Mammalia and Aves. For instance in mammals, PCV/HCT is low in both Afrotheria and Xenarthra. In contrast, PCV/HCT is highest in the order Chiroptera and greater in marine mammals (Cetacea and Pinnipedia) than in their respective related taxa, Artiodactylia and non-marine carnivores. In birds, there were differences between taxa for PCV/HCT, for examples between orders Anseriformes and Galliformes but none for the blood concentration of hemoglobin. There marked differences between mammalian and avian taxa for both erythrocytes concentration and MCV. Allometric relations are observed for PCV/HCT, blood concentration of hemoglobin, erythrocyte concentration and MCV across both birds and mammals. However, allometric relationships for PCV/HCT and MCV are seen in only some but not other mammalian and avian taxa.
2.Materials and Methods
2.1.Databases
2.2.Analyses
2.3.Statistics
3.Results
4.Discussion
5.References
Introduction
Both the overall packed cell volume/hematocrit (PCV/HCT) and the blood concentration of hemoglobin are reported to be identical between class Mammalia and Aves (Hawley et al., 1991). This suggests a tight level of control for these hematological parameters. However, what is not known is whether there are differences for hematological parameters for taxa within classes Mammalia and Aves. This is examined in the present study with data from a large sample size of species (357 mammalian and 323 avian species). Moreover, data from livestock, poultry and companion animals is excluded from the analyses as domestication/selective breeding may have had effects on these parameters.
In addition, negative allometric relationships for both PCV/HCT and blood concentrations of hemoglobin have been previously reported for mammals [1] and for birds [2]. This is consistent with a relationship between basal metabolic rate being proportional to the body weight to the power two thirds (reviewed: [3]). Metabolic rate, and hence a physiological parameter such as erythrocyte size, scales with body weight follow either a 2/3 or ¾ power relationship (discussed e.g. [4-6]). Erythrocyte size has been used as a proxy for somatic cell size [7] and it correlates well with the cell size of other tissues in passerine birds together with amphibians; calculated both with and without phylogenic correction [8]. In contrast, erythrocyte volume does not correlate well with the cell size of other tissues either uniformly with different tissues or to the same extent (accounting for less than 80% of the variance) in mammals [8].
What is not clear is whether the relationships between hematological parameters and log10 body weight are real reflecting an allometric relationship and the reduced needs for energy in larger animals or represents an artifact of species included in the analysis and the inclusion of domesticated animals in the analyses. The present study re-examines the relationship between hematological parameters and body weight in mammals and birds employing a large sample size of species (357 mammalian and 323 avian species) but with domestic animals excluded from the analyses.
Materials and Methods
A series of databases were assembled for hematological parameters using the published or calculated mean for the species based on rigorous and systematic series of searches of the literature. The databases for hematological parameters are shown for the following: mammals (Supplementary Table A) and birds [9]. For birds, information on body weights was from [10] while for mammals, these were was predominantly from Animal Diversity Web.
Data were analyzed by taxonomic groups based on the following for birds [11-14] and for mammals [15,16]. However, for the latter, it should be noted that recent studies support the grouping Laurasiathera but do not support the Euarchontoglires encompassing the Glires (rodents/lagomorphs) and Euarchonta (including primates and tree shrews)[17]. Moreover, while the Cetacea (marine mammals such a whales and dolphins) are generally viewed as a branch of the Artiodactylans [14,18], the Artiodactyla and Cetacea will be considered separately in the present study due to ecological, size and other differences.
Data were analyzed by taxa using one-way analysis of variance, with mean separated by Tukey’s range test or, when comparisons are limited to between two taxa, by Student’s t test. The relationship between hematological parameters and log10 body weights were compared by linear regression for mammals and birds.
Results
Table 1 compares hematological parameters in mammals and birds across multiple species. There were no differences between either the mean packed cell volume (PCV)/hematocrit (HCT) or hemoglobin concentrations between mammals and birds. Similarly, there were no differences PCV/HCT or hemoglobin concentrations between marsupial and placental mammals (Table 2).
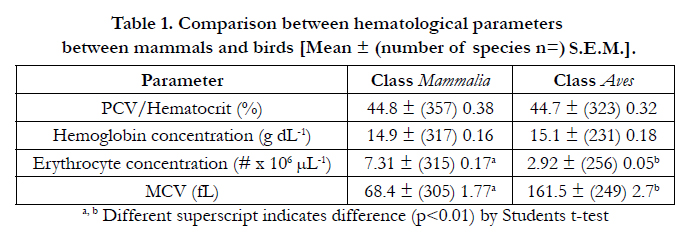

Table 1. Comparison between hematological parameters between mammals and birds [Mean ± (number of species n=) S.E.M.].
Table 2 summarizes hematological parameters in mammalian taxa (where there were sufficient number of species for adequate analyses. There were marked differences between mammals and birds in erythrocyte concentration and mean erythrocyte cell or corpuscular volume (MCV). The concentration of erythrocytes was 60.2% lower in birds (p<0.001) than mammals (Table 1). In contrast, erythrocytes are much, 57.6%, smaller (p<0.001) in mammals than birds (Table 1) with a concomitant, 56.1 %, reduction (p<0.001) in hemoglobin content. Comparing placental to marsupial mammals, there was a small (18.1 %) elevation (p<0.001) in the erythrocyte concentration in the former (Table 3).
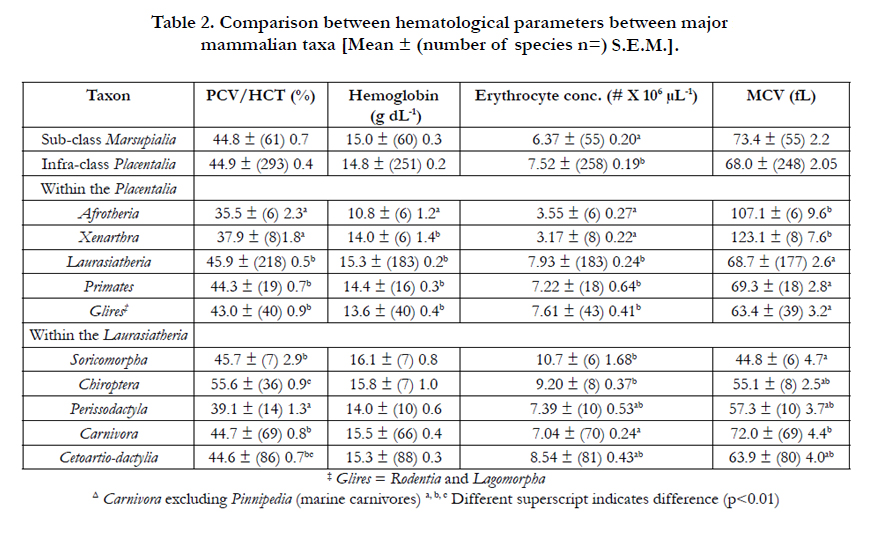
Table 2. Comparison between hematological parameters between major mammalian taxa [Mean ± (number of species n=) S.E.M.].
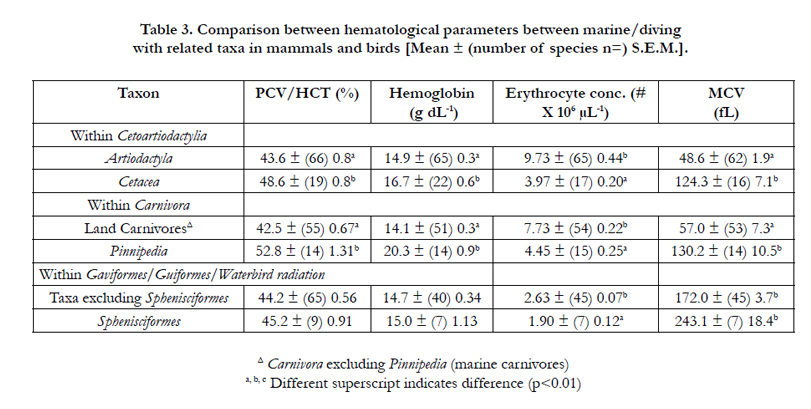
Table 3. Comparison between hematological parameters between marine/diving with related taxa in mammals and birds [Mean ± (number of species n=) S.E.M.].
Within placental mammals, PCV/HCT are similar in the taxa:Laurasiatheria, Primates and Glires but are 21.0 % higher than those in the Afrotheria and Xenarthra (Table 2). Moreover, the blood concentration of hemoglobin are similar in the taxa: Laurasiatheria, Primates, Glires and Xenarthra but 24.6 % lower than in the Afrotheria (Table 3). There were fewer (55.1%) (p<0.001) and larger erythrocytes (71.4%)(p<0.001) in the taxa: Afrotheria and Xenarthra than in Laurasiatheria, Primates and Glires (Table 3). Within the Laurasiatheria, PCV/HCT was highest in the Order Chiroptera and lowest in the Order Perissodactyla (Table 2). Moreover, PCV/HCT were higher the marine taxa – Cetacea and Pinnipedia than respectively the Artiodactylia and the Carnivora excluding marine taxa. The only differences in the blood hemoglobin concentration within Laurasiatherian taxa were the higher concentrations in the marine taxa – Cetacea and Pinnipedia than respectively the Artiodactylia and the Carnivora.
There were marked differences between mammalian taxa in erythrocyte number per unit blood volume and MCV (Table 2). Some of these such as the differences in MCV between Afrotheria plus Xenarthra and Glires plus Primates plus Laurasiatheria might be explicable by differences in body weight. However, if log10 body weight were critically, the lack of differences between MCV between Glires and Laurasiatheria would be surprising given large difference in log10 body weight [Glires - 2.49 ± S.E.M. 0.22 and Laurasiatheria 4.84 ± 0.065]. Moreover, the MCV was markedly higher (p<0.001) in the marine taxa – Cetacea and Pinnipedia than the Artiodactylia and the Carnivora by respectively 2.56 and 2.28 fold (Table 2). In view of the taxa differences in both PCV/HCT and hemoglobin concentrations, the mean corpuscular hemoglobin concentration (MCHC) was calculated. There were few differences in the MCHC between mammalian taxa except that the MCHC were lower (p < 0.01) in Primates [32.8 ± (16) 0.3 g dL-1] and Glires [31.6 ± (40) 0.6 g dL-1] than in Laurasiatheria [34.6 ± (176) 0.3 g dL-1] and higher (p < 0.001) Pinnipedia [38.5 ± (12) 1.54 g dL-1] than in non-marine Carnivora [33.3 ± (52) 0.3 g dL-1].
In contrast, the absence of differences in PCV/HCT and blood hemoglobin concentrations between mammals and birds, there were differences in PCV/HCT but not in blood hemoglobin concentrations in avian taxa (shown in Table 3). PCV/HCT was higher in the Order Anseriformes than in Order Galliformes (p<0.05), in the Order Charadriiformes together with “Landbird assemblage” than in the Gaviformes/Guiformes Waterbird radiation (p<0.05) and in the Australaves than in Afroaves (p<0.001). There were also marked differences in erythrocyte number, volume and size with, for instance, higher MCV and erythrocyte area in Gaviformes/Guiformes Waterbird radiation than in either the “Landbird assemblage” species or the Order Charadriiformes. The MCV and erythrocyte areas were respectively 32.6 and 43.8 % greater (p<0.001) in Palaeognathae than in Neognathae avian species (Table 3). There were a few differences in the MCHC between avian taxa in the Neoaves with MCHC greater in birds of the “Landbird assemblage” [35.1 ± (n=110) S.E.M 0.8 g dL-1] than in the order Charadriiformes [30.5 ± (16) 0.7] (p<0.05) and in the Afroaves [38.6 ± (50) 1.4 g dL-1] than the Australaves [32.1 ± (60) 0.5 g dL-1] (p<0.01).
There were negative (allometric) relationships between PCV/HCT, erythrocyte concentration and MCV versus log10 body weight in both birds and mammals (Table 4). In addition, there were negative relationships between hemoglobin concentrations and erythrocyte area versus log10 body weight in birds. The positive relationship between blood hemoglobin concentrations versus log10 body weight in mammals (Table 4) may reflect the taxa differences in blood hemoglobin concentrations (Table 2). While no allometric relationship for PCV/HCT was seen in marsupial mammals (adjusted R2 -0.006; p = 0.435), there is some allometric relationship in placental mammals (adjusted R2 0.057; p = 1.97E-05)(Table 5). Moreover, allometric relationships for PCV/HCT are observed in some mammalian taxa (such as the orders Chiroptera and Primates) but not others including Rodentia and Perissodactylia (Table 5). The relationship between erythrocyte size and log10 body weight was present when analyzed within taxa, for instance, in the orders Cetacea, Perissodactylia, Rodentia and Primates together the Pinnipedia (Table 6). No allometric relationship was observed in Order Carnivora excluding the Pinnipedia (marine carnivores) and both Chiroptera and Artiodactylia (Table 6).
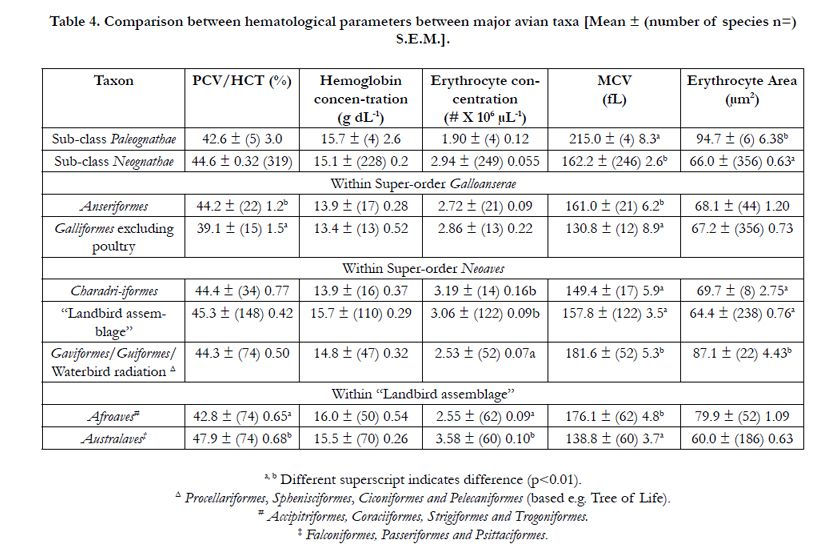
Table 4. Comparison between hematological parameters between major avian taxa [Mean ± (number of species n=) S.E.M.].
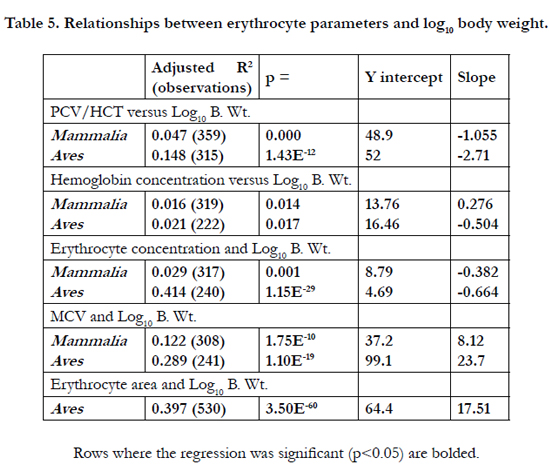
Table 5. Relationships between erythrocyte parameters and log10 body weight.
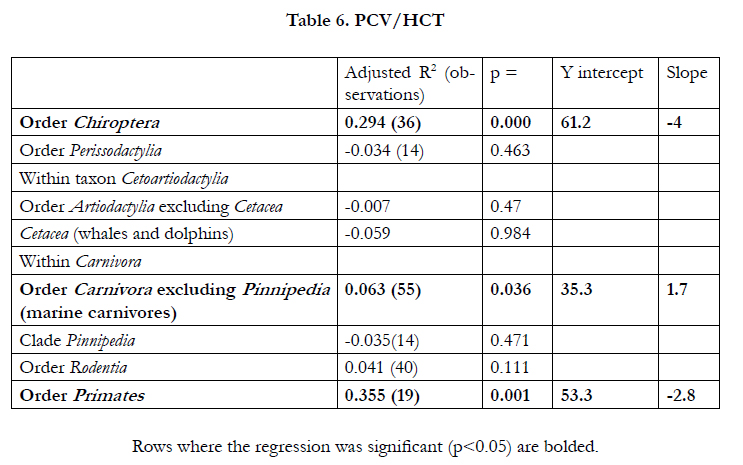
Table 6. PCV/HCT
Strong allometric relationships were observed for erythrocyte size (area and MCV) in some avian taxa such as Columbiformes and to a less extent Galliformes (Table 7). There is no relationship between erythrocyte size and log10 body weight in some avian taxa such as the carnivorous Accipitriformes (Table 7).
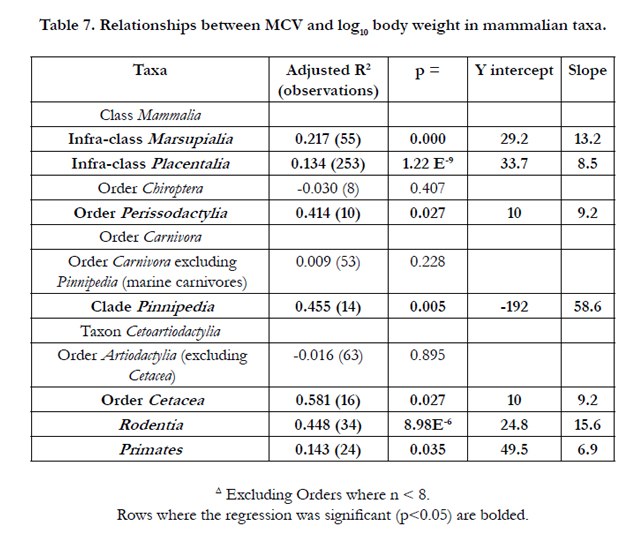
Table 7. Relationships between MCV and log10 body weight in mammalian taxa.
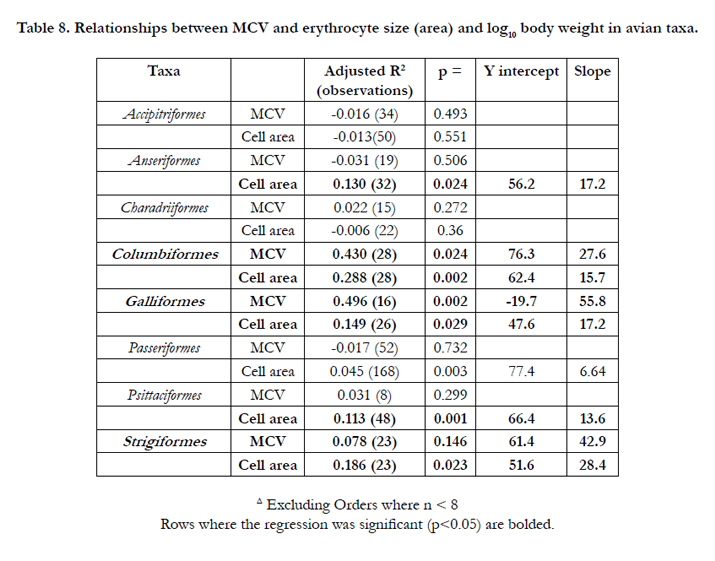
Table 8. Relationships between MCV and erythrocyte size (area) and log10 body weight in avian taxa.
Discussion
There was no difference between the overall PCV/HCT between the Classes Mammalia and Aves (Table 1). This is identical to a previous report [19]. The mean PCV/HCT in birds was 44.7% (Table 1). This broadly agrees with a previous mega-analysis in birds [2] that reported a PCV/HCT of 46.3 % across about 100 avian species, principally passeriform species of birds. In contrast to the lack of differences between PCV/HCT in birds and mammals, there were differences between taxa within both the Classes Mammalia and Aves. For instance, PCV/HCT was lower in the Afrotheria and Xenarthra than in the other major taxa of placental mammals, namely Glires, Euarchontoglires or Supraprimates (Primates) plus Laurasiatheria. Within the Laurasiatheria, PCV/HCT was highest in the order Chiroptera and lowest in the order Perissodactylia. The oxygen needs for flight by bats might account for the high PCV/HCT. However, if the high HCT in bats (Table 2) is related to the oxygen requirements of flight, a differences between PCV/HCT in birds and mammals would be expected. No such difference for PCV/HCT is observed (Table 1). The PCV/HCT was greater in marine mammals, order Cetacea (whales and dolphins) and clade Pinnipedia (seals, sea-lions and walruses) than in related taxa respectively Artiodactylia [18] and non-marine Carnivora. This elevated PCV/HCT in marine mammals may again be accounted for by the energetic/oxygen needs of these large marine mammals. However, there was no such difference between the marine/diving birds. The magnitude of the differences in PCV/HCT in mammalian taxa [35.5 % (Afrotheria) to 55.6 % (Chiroptera)] was greater than that for avian taxa [39.1 % (Galliformes) to 47.9 % (Australaves)].
The blood concentrations of hemoglobin reported in the present communication (Table 1)(mammals - 14.9 g dL-1 and birds - 15.1 g dL-1) were somewhat higher than those reported previously [20]; viz. mammals 12.9 g dL-1 and birds 13.1 g dL-1. There are not difference between the overall blood concentrations of hemoglobin between the Classes Mammalia and Aves (Table 1) as has been previously observed [19]. Similarly, no differences in blood concentrations of hemoglobin were observed between avian taxa and for predominantly for mammalian taxa (Tables 2 and 4). The exceptions were the low blood concentrations of hemoglobin in Afrotheria and the higher blood concentrations of hemoglobin in in marine mammals, viz. order Cetacea and clade Pinnipedia (Table 3). Elevated blood concentrations of hemoglobin have been noted in diving animals [21] but they were no observed in avian marine birds in the Order Sphenisciformes (penguins). It is interesting that there were more difference between taxa for PCV/HCT than for blood concentrations of hemoglobin. For instance, while the PCV/HCT was 21.1 % higher in the Order Chiroptera than in the Super-order Laurasiatheria in general, there was no difference in the blood concentrations of hemoglobin (Table 2). In contrast comparing marine mammals with related taxa, the changes in PCV/HCT and blood concentrations of hemoglobin are broadly similar (Table 3). Similarly, artic species of mammals have elevated blood concentrations of hemoglobin size [22].
Both HCT/PCV and blood hemoglobin are related to log body weight in birds and mammals (Table 6). This is similar to the relationship reported by Bishop and Butler [2] who established a relationship between HCT and log body weight in birds [Hct=61Mb20.07±0.01, R2=0.31, P<0.001]. While it has been argued that hematocrit and blood concentration of hemoglobin or “oxygen-carrying capacity of the blood is highly conserved in birds and mammals” [19], the present analyses lend support the conservation of the same specific set-point for hematocrit and blood concentration of hemoglobin in birds and mammals.
Erythrocytes are larger and less numerous in birds than in mammals (Table 1). This is similar to previous reports [19]. Moreover, erythrocyte size is related to log body weight (Table 5, 7, 8). Although erythrocyte size has been used as a proxy for somatic cell size [7], the difference in erythrocyte size between birds and mammals might be assumed to reflect at least in part the volume of a nucleus in avian erythrocytes. In fish, the log nucleus area was strongly linearly related to log erythrocyte area [7]. The present strong link between erythrocyte size and log body weight in birds are consistent with previous reports. There is a strong positive correlation between log erythrocyte size (area) and log genome size in birds as in mammals, amphibians and reptiles [23-26]. Moreover, genome size is positively correlated with log body weight in birds [27].
It might be argued that differences in PCV/HCT and other hematological parameters in mammalian and avian taxa reflect an artifact of sampling of large versus small animals and the allometic relationship for PCV/HCT and MCV (Tables 5-8). It is argued that not only are there some taxonomic differences in PCV/HCT and other hematological parameters in the Classes Mammalia and Aves but also in the relationship between PCV/HCT with log10 body weight. For instance while there is an overall allometric relationship PCV/HCT in mammals (Table 5), it is only seen in some mammalian taxa (Chiroptera and Primates) but not others (Perissodactylia, Pinnipedia and Rodentia) (Table 6). Conversely there is an overall allometric relationship for MCV in both mammals and birds (Table 5), it is only seen in some mammalian taxa (Chiroptera and Primates) but not others (Perissodactylia, Pinnipedia and Rodentia) (Table 6).
References
- Kjeld M, Ólafsson Ö (2008) Allometry (scaling) of blood components in mammals: connection with economy of energy. Can J Zool 86(8): 890-899.
- Bishop CM, Butler PJ (1995) Physiological modelling of oxygen consumption in birds during flight. J Exp Biol 198(10): 2153-2163.
- White CR, Seymour RS (2005) Allometric scaling of mammalian metabolism. J Exp Biol 208(9): 1611-1619.
- Glazier DS (2005) Beyond the '3/4-power law': variation in the intra- and interspecific scaling of metabolic rate in animals. Biol Rev Camb Philos Soc 80(4): 611-662.
- Glazier DS (2010) A unifying explanation for diverse metabolic scaling in animals and plants. Biol Rev Camb Philos Soc 85(1): 111-138.
- Starostová Z, Konarzewski M, Kozłowski J, et al. (2013) Ontogeny of Metabolic Rate and Red Blood Cell Size in Eyelid Geckos: Species Follow Different Paths. PLoS One 8(5): e64715.
- Maciak S, Janko K, Kotusz J, et al. (2011) Standard metabolic rate (SMR) is inversely related to erythrocyte and genome size in allopolyploid fish of the Cobitis taenia hybrid complex. Functional Ecology 25(5):1072-1078. doi:10.1111/j.1365-2435.2011.01870.
- Kozłowski J, Czarnołeski M, François-Krassowska A, et al. (2010) Cell size is positively correlated between different tissues in passerine birds and amphibians, but not necessarily in mammals. Biol Lett 6(6): 792–796.
- Scanes CG (2015) Blood. In: Sturkie’s Avian Physiology. (6th edn), Elsevier, New York. 167-191.
- Del Holo J, Elliot A, Sargatal J (1992-2012) Handbook of the birds of the World. Lynx Edicions, Barcelona. Volumes 1-16.
- Livezey B C, Zusi RL (2007) Higher-order phylogeny of modern birds (Theropoda, Aves: Neornithes) based on comparative anatomy. II. Analysis and discussion. Zool J Linn Soc 149(1): 1-95.
- Hackett SJ, Kimball RT, Reddy S, et al. (2008) A phylogenomic study of birds reveals their evolutionary history. Science 320(5884): 1763-1768.
- Fjeldso J (2013) Handbook of the birds of the World, Special volume: New species and global index. Lynx Edicions, Barcelona, 77.
- Tree of Life http://tolweb.org/ Accessed 8/12/15
- Lindblad-Toh K (2004) Genome sequencing: threes company. Nature 428(6982): 475-476.
- Morgan CC, Foster PG, Webb AE, et al. (2013) Heterogeneous models place the root of the placental mammal phylogeny. Mol Biol Evol 30(9): 2145-2156.
- Elhaik, E, Graur D (2014) A comparative study and a phylogenetic exploration of the compositional architectures of Mammalian nuclear genomes. PLoS Comput. Biol. 10(11): e1003925.
- Spaulding, M., O'Leary, M.A. and Gatesy, J (2009) Relationships of Cetacea (Artiodactyla) among mammals: increased taxon sampling alters interpretations of key fossils and character evolution. PLoS One 4(9): e7062.
- Hawkey CM, Bennett PM, Gascoyne SC, et al., (1991) Erythrocyte size, number and haemoglobin content in vertebrates. Brit J Haematol 77(3): 392-397.
- Snyder GK, Sheafor BA (1999) Red Blood Cells: Centerpiece in the Evolution of the Vertebrate Circulatory System. Am Zool 39(2): 189-198.
- Kooyman GL (1989) Diverse divers: physiology and behavior. (1st edn), Springer-Verlag Berlin Heidelberg. 23: 1–200.
- Withers PC, Casey TM, Casey KK (1979) Allometry of respiratory and haematological parameters of arctic mammal. Comp Biochem Physiol A 64(3): 343–350.
- Gregory TR (2001) The bigger the C-Value, the larger the cell: genome size and red blood cell size in vertebrates. Blood Cells Mol Dis 27(5): 830–843.
- Gregory TR (2001) Coincidence, coevolution, or causation? DNA content, cell size, and the C-value enigma. Biol Rev 76(1): 65-101.
- Gregory TR, Animal genome size database. 2001; http://www.genomesize. com/cellsize/birds.htm Accessed January 31, 2015.
- Gregory TR (2002) A bird’s eye view of the C value enigma: Genome size, cell size, and metabolic rate in the class Aves. Evolution 56(1): 121–130.
- Wright NA, Gregory TR, Witt CC (2014) Metabolic ‘engines’ of flight drive genome size reduction in birds. Proc Biol Sci 281(1779): 20132780.


