Venous Ocular Blood Flow in Primary Open Angle Glaucoma
Natalia I. Kurysheva1*, Tatiana N. Kiseleva2, Elena Y. Irtegova1, Olga A. Parshunina1
1 Ophthalmological Center of the Federal Medical and Biological Agency, Moscow, Russia.
2 The Helmholtz Moscow Research Institute of Eye Diseases, Moscow, Russia.
*Corresponding Author
Natalia I. Kurysheva,
Ophthalmological Center of the Federal Medical and Biological Agency,
Malaya Naberezhnaya, 15/1-7, Moscow, 125362, Russia.
Tel: +7 916 664 23 13
Fax: +7 499 196 65 17
E-mail: e-natalia@list.ru
Received: May 17, 2015; Accepted: June 03, 2015; Published: June 08, 2015
Citation: Natalia I. Kurysheva, Tatiana N. Kiseleva, Elena Y. Irtegova, Olga A. Parshunina, (2015) Venous Ocular Blood Flow in Primary Open Angle Glaucoma. Int J Ophthalmol Eye Res. S3:001, 1-7. doi: dx.doi.org/10.19070/2332-290X-SI03001
Copyright: Natalia I. Kurysheva© 2015. This is an open-access article distributed under the terms of the Creative Commons Attribution License, which permits unrestricted use, distribution and reproduction in any medium, provided the original author and source are credited.
Abstract
Purpose: To study venous blood flow of the eye and the correlation between clinical data and ocular blood flow in primary open angle glaucoma (POAG).
Methods: Color Doppler imaging of arterial and venous blood flow was performed in 78 patients with normal tension glaucoma (NTG), 80 patients with high pressure glaucoma (HPG) and 60 control subjects. The statistical analysis included the calculation of correlation between clinical data and ocular blood flow parameters as well as Pearson’s correlation coefficient. The threshold P value for statistical significance was 0.05.
Results: Ocular blood flow (both arterial and venous) was significantly reduced in NTG and HTG in comparison to the control group. While arterial blood flow reduction was more significant in HTG than in NTG, venous blood flow decrease was more marked in NTG. In contrast to the control group, POAG patients showed a correlation between clinical data and venous blood flow. The correlation was higher in NTG patients.
Conclusions: The obtained results indicate the potential importance of venous blood flow in glaucoma pathogenesis, especially in NTG.
2.Introduction
3.Materials and Methods
3.1 Subject groups
3.2 Measuring devices
3.3 Statistical analysis
4.Results
5.Discussion
7.References
Keywords
Ocular Blood Flow; Optical Coherence Tomography; Primary Open Angle Glaucoma; Retinal Ganglion Cell Complex; Venous Blood Flow; Primary Open-Angle Glaucoma; Normal Tension Glaucoma; Optical Coherence Tomography; Structural Changes; Ocular Blood Flow.
Introduction
Reduced and/or unstable ocular blood flow leading to chronic ischemia and reperfusion of deep retinal layers and optic nerve head is considered to be an important risk factor in primary open angle glaucoma (POAG) development and progression [1]. More than 30 years ago Quigley and co-workers, performed histological analysis in post mortem eyes comparing the optic disc capillary bed in patients with early and advanced glaucoma. The authors reported the amount of capillaries remained at a normal level, while there was a significant thinning of the retinal nerve fiber layer (RNFL) in advanced glaucoma [2]. On this basis, the author concluded that the development of glaucomatous optic neuropathy is not associated with vascular disorders of the optic nerve. This conclusion was, however, criticized by Hayreh, who emphasized that the state of capillary bed does not necessarily reflect the level of ocular perfusion since capillaries are more resistant to ischemia than nervous tissue [3]. In humans longitudinal studies are required to investigate whether such perfusion changes in glaucoma are cause or consequence of the disease, which is difficult in the absence of a gold standard method for measuring ocular blood flow. Color Doppler imaging (CDI) has been proposed for glaucoma diagnosis showing relatively good sensitivity and specificity [4-23]. Moreover several longitudinal studies using color Doppler imaging (CDI) indicate that reduced blood velocities in retrobulbar vessels are indeed a risk factor for glaucoma progression [4-10].
However few of them mention the role of venous blood flow in glaucoma and explore its link to disk hemorrhages, retinal vein occlusion [18] and retinal venous pulsation [14, 15].
The purpose of our study was to evaluate venous blood flow in glaucoma patients and determine the correlation between local blood flow and clinical data in POAG patients.
Materials and Methods
The study was approved by the ethical committee (Institutional Review Board) at the Institution of Federal Medical and Biological Agency of Russian Federation and was conducted in accordance with Good Clinical Practice within the tenets of the Helsinki agreement. Each patient/subject was required to sign an informed consent form before being enrolled in the study and prior to any measurements being taken.
The study included 156 patients (73 male and 83 female) with POAG aged 46 to 67 years. 78 patients had normal tension glaucoma (NTG), and 80 had high pressure glaucoma (HPG). 60 healthy individuals (22 males and 38 females) of the same age constituted the control group. Glaucoma was diagnosed on the basis of characteristic changes in the optic disc detected by ophthalmoscopy, which was performed by one glaucoma specialist (NK; pathological deviation from the normal neuroretinal rim, glaucomatous optic disc cupping, peripapillary atrophy, wedgeshaped defects of RNFL adjacent to the edge of optic disc, hemorrhages on the optic disc boundary). Standard automated perimetry (SAP) was done by means of the Humphrey perimeter (Carl Zeiss Meditec, Dublin, CA) using the 30-2 threshold test program with the SITA-Standard algorithm (threshold was studied at 176 points within the central 30° using Goldmann III white stimulus and presentation duration of 100 ms, with background illumination of 31.5 abs). Mean deviation (MD) and pattern standard deviation (PSD) were determined. Results of the SAP had to be normal defined as: the pattern deviation plot has less than 3 contiguous points significantly different from normal (P<0.05) with at least one at the P<0.01 level on the same side of the horizontal meridian. For the diagnosis of HTG an untreated intraocular pressure (IOP) above 21 mm Hg was required. Patients using eye drops prior to being enrolled in the study were recommended to discontinue treatment for up to 3 weeks (the washout period). Other patients were newly diagnosed with glaucoma. Diagnostic criteria for NTG were the same as for the HTG patients, however an IOP was not above 21 mmHg.
The control group consisted of persons with no first-degree relatives with glaucoma, IOP<22 mm Hg, normal optic disc appearance, normal RNFL and absence of visual field defects.
In all subjects an ophthalmologic examination was performed including determination of visual acuity, biomicroscopy, applanation tonometry, gonioscopy, pachymetry, measurement of axial length and anterior chamber depth, and imaging of the anterior segment of the eye using OCT. Inclusion criteria were the ametropia≤ 0.5 diopters and an open anterior chamber angle (not less than 30°).
Exclusion criteria were the presence of the following: systemic administration of beta-blockers and calcium-channel blockers, concomitant ocular disease (except early stage cataract), chronic autoimmune diseases, diabetes mellitus, acute circulatory disorders in past medical history and any concomitant disease involving administration of steroid drugs. A history of ocular arterial or venous obstruction (branch or central occlusion) or systemic conditions associated with venous congestion (e.g. heart failure) were also considered as exclusion criteria. Only patients who had not been previously undergone ocular surgery were included.
In glaucoma patients the eye with more advanced glaucoma stage (determined via perimetry) was included in the study. The control group had their right eye hemodynamics examined.
Information regarding functional and structural damage was collected from glaucoma patients during examinations undertaken on the day of the study visit.
Patients with suspected intracranial abnormalities underwent brain magnetic resonance imaging (MRI). Doppler imaging was used to exclude any neck blood vessels pathology. Blood pressure measurement was taken from subject’s right arm using an electronic sphygmomanometer (Omron, Schaumburg, USA).
Intraocular pressure was measured using the Ocular Response Analyzer (ORA) (Reichert Ophthalmic Instruments, Depew, NY). The device uses a direct burst of air directed towards the cornea and uses tow applanation pressure measurements, one during the depression of the cornea and another during the recovery. The corneal hysteresis (CH) measure allows for the calculation of a corneal compensated IOP (IOPcc), which appear to be less affected by properties of the cornea than conventional applanation tonometry.
Mean ocular perfusion pressure (MOPP) was calculated based on measurements of IOP and systemic blood pressure (BP) immediately before the OCT scanning and investigation of retrobulbar blood flow, after a 10-minute resting period in the sitting position. Systemic BP was measured using the Riva Rocci technique. MOPP was calculated using the formula: MOPP= ([2/3diastolicBP + 1/3systolicBP] x 2/3-IOP).
OCT was performed using the RTVue-100 OCT (Optovue, Inc., Fremont, CA) in the optic disc area (ONH protocols and 3D Disc) and macular area (GCC protocol) in tracking mode. In the ONH (optic nerve head) study protocol, retinal nerve fiber layer thickness (RNFLT) was investigated.
The method used for investigating blood flow velocity in retrobulbar vessels included gray-scale ultrasound, Color Doppler Imaging (CDI) and pulsed-wave Doppler (PWD). The ultrasound examinations were performed with a VOLUSON 730 Pro ultrasound system (GE Medical Systems Kretztechnik GmbH & Co OHG, Austria) and a SP 10-16 transducer. With the patient in supine position, sterile ophthalmic gel was applied as a coupling to the closed eyelid, and the probe was positioned gently with minimal pressure. Application of gray-scale ultrasound enabled us to obtain the image of the globe and orbit. The CDI-method was used to display directly the fine orbital vessels, including the ophthalmic artery (OA) and its branches, the central retinal artery (CRA), the lateral and medial posterior ciliary arteries (PCAs). It was done according to expected anatomical position of the vessels and its color code. The blood flow in the OA was evaluated at a depth of 35 mm. The CRA blood flow velocity was examined in the canal of optic nerve at the distance of 5-6 mm from the posterior wall of the globe. The PCAs were identified on either side of the optic nerve, about the same distance from the fundus as the central retinal artery and vein. With using PWD we measured the blood flow spectrum of vessels and its main indices: peak systolic velocity (PSV), end-diastolic velocity (EDV), mean velocity (Vmean), resistive index (RI), and the pulsatility index (PI).
Patients were instructed to avoid caffeine intake, smoking and exercise for 5 hours prior to the study visit.
Analyses were performed with “SPSS 11.0 for Windows” software. The statistical analysis included the calculation of means, standard deviation, standard error as well as Pearson’s correlation coefficient. The threshold P value for statistical significance was 0.05.
Since a number of parameters (GCC, CDI parameters of vortex vein, the mean velocity and RI in superior ophthalmic vein and corneal hysteresis) depended on the axial length (AL) and age of the subjects, they were adjusted on a linear regression model basis with allowance for AL and age.
Results
Table 1 summarizes patient characteristics in the observed groups. Significant difference was detected between POAG patients and healthy control subjects in all studied parameters except age, visual acuity and blood pressure. However there was no difference between glaucoma patients, except in IOP and mean ocular perfusion pressure, which was significantly lower in NTG patients than in HTG group and healthy subjects.
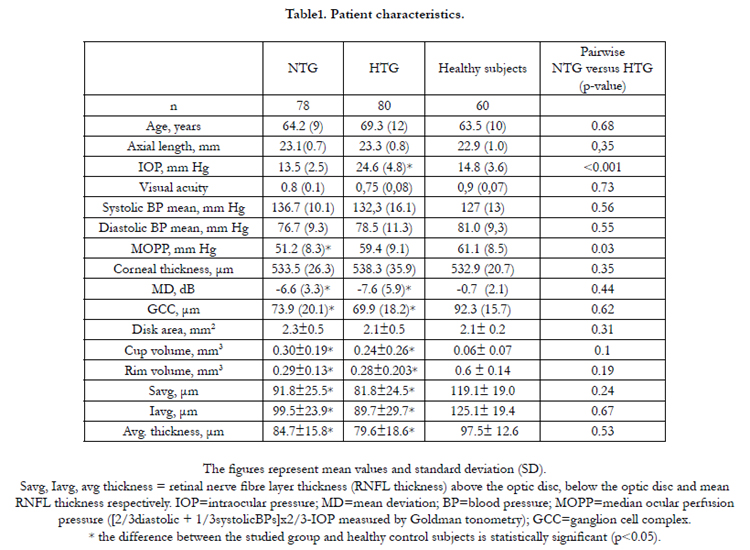

Table1. Patient characteristics.
CDI variables of the retrobulbar vessels in the studied groups are given in Table 2. Blood flow was significantly reduced in all vessels supplying blood to the retina and optic disc in NTG and HTG compared to the healthy subjects. Arterial blood flow velocity parameters were higher in NTG than in HTG; some parameters showed a statistically significant difference (p<0.05). Conversely, venous blood flow deficiency was more marked (p<0.05) in NTG than in HTG patients.
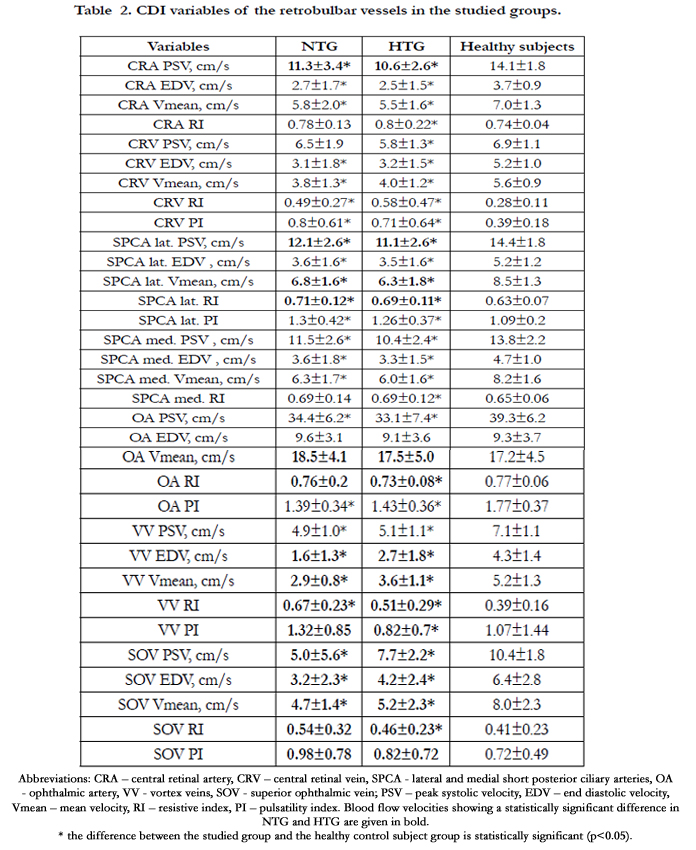
Table 2. CDI variables of the retrobulbar vessels in the studied groups.
Correlation between morphology, function and blood flow parameters in POAG patients and healthy control subjects is summarized in Table 3. The control group only showed a correlation between clinical parameters and blood flow in short posterior ciliary arteries. In glaucoma patients a stronger correlation was found between clinical data and venous blood flow (especially in NTG) rather than between the former and arterial blood flow. It concerns the correlation between ganglion cell complex thickness and blood flow in central retinal vein and vortex veins.
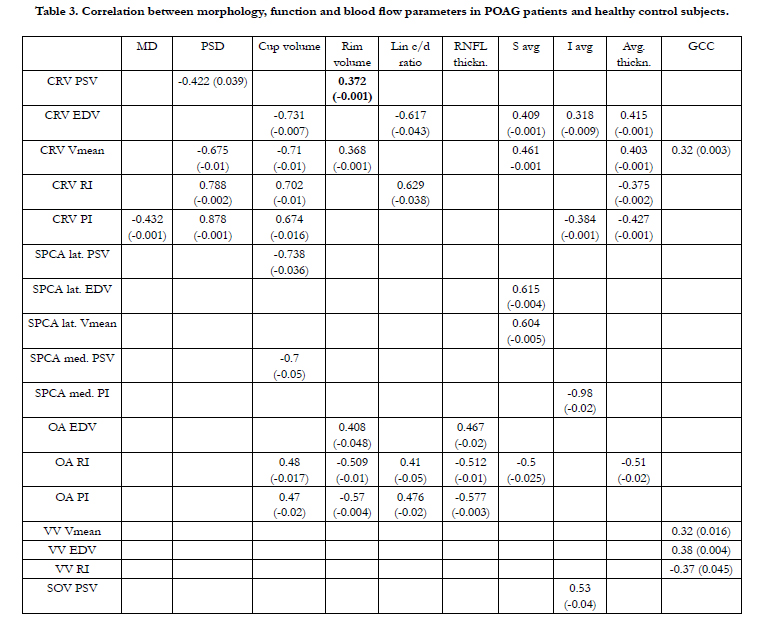
Table 3. Correlation between morphology, function and blood flow parameters in POAG patients and healthy control subjects.
Discussion
Our results indicate that ocular blood flow deficiency might be present in glaucoma in general, which has already been reported in numerous studies [14, 16, 17, 20]. Blood flow in NTG is not more impaired than in HTG. It wasn’t unexpected for it had previously been described in literature [22].
The most important results concern venous blood flow, which previously has been studied poorly in glaucoma. This is mainly due to the lack of precise and reliable ocular blood flow evaluation methods [1, 24]. CDI of ocular blood vessels is regarded as a trusted classic method, which has been a well-validated tool in ocular blood flow research. However it cannot be considered precise, especially if used to study small vessels and venous blood flow. This is stated in a recent study by R. Ehrlich and A. Harris who noted however that high skilled professionals are nevertheless able to visualize small blood vessels [25]. In a recent metanalysis Rusia et al. CDI data of 3061 glaucoma patient were compared with 1072 healthy subjects. The authors concluded that CDI parameters can be used as a diagnostic criterion for distinguishing glaucomatous patients from healthy individuals [26]. Our results show decreased blood flow in CRV as well as in vortex veins and superior ophthalmic vein in both POAG groups. Moreover blood flow in NTG turned out to be lower than in HTG in several veins. Is it somehow linked to glaucomatous optic neuropathy development? It is possible to assume that it is true. High correlation between clinical data and venous blood flow parameters in glaucoma – especially in NTG – and no such correlation with arterial blood flow support this theory.
Ocular venous outflow pathway is composed of CRV, vortex veins and superior ophthalmic vein, as well as several small orbital veins. It is important to keep in mind that the venous system anatomy may vary. The central retinal vein exits the eye through the lamina cribrosa along with the optic nerve. Narrowing of CRV past the lamina cribrosa is a typical anatomical trait, and 4 out of 5 patients have an intraorbital part of the CRV 43-116% wider than that which runs through the lamina cribrosa [17]. Thus narrow lamina cribrosa opening combined with its certain anatomical features may severely limit the venous outflow. Apparently there are 3 options: 1) the narrowing is significant, 2) insignificant or 3) moderate. If the segment of the CRV that goes through the lamina cribrosa is significantly narrowed, the pressure in the intraocular part of the CRV is greatly higher than IOP. Therefore, the actual ocular perfusion pressure (OPP) in such cases is much lower than that calculated by using the standard formula (see above), where IOP is thought to be equal to BP in CRV.
However it should be kept in mind that even a minor increase in IOP, which lowers OPP by a small 4 – 5 % may double the pressure difference between the prelaminar and postlaminar parts of CRV. As adequately noted by А. Bill, if we suppose that the pressure in the intraocular part of the CRV equals IOP, it is always slightly higher than that in the postlaminar part of the CRV [27]. This results in turbulent blood flow. If IOP becomes higher than the pressure in CRV, the turbulence increases putting the vein wall at risk of mechanical damage. Notably, it can also happen in cases of minor IOP increase, for instance in NTG. The situation is worsened by enlargement of CRA, which might compress the vein situated below it. Thus CRA enlargement does not lead to OPP increase, decreasing it instead due to higher pressure in the CRV. Severe pressure increase may lead to CRV thrombosis, which is basically characteristic of glaucoma.
A new theory has recently been proposed to explain the origin of retinal vein thrombosis. It is based on certain similarities between the pathogenesis of vein thrombosis and glaucoma [28]. The matter is that the inner vein wall – like the endothelium of arteries and capillaries – responds to various vasoconstrictive and vasodilatory factors. What do CRV thrombosis and glaucoma have in common? On the molecular level it is the overproduction of the following substances: hypoxia-inducible factor (HIF-1α), endothelin-1 (ЕТ-1), vascular endothelial growth factor (VEGF) and erythropoietin. The aforementioned chemical stimuli may lead to vasospasm and increased vascular permeability. These factors are thought to be able to diffuse through the permeable wall of choroidal blood vessels into the optic nerve head. This is the first location to become affected by vasospasm and increased permeability, which in severe cases manifest with optic disc hemorrhage [23]. It is notable that in both phenomena venous blood pressure is increased [29].
Short-term IOP increase results in capillary stasis due to microstructural damage of arterioles (which can occur in vessels adjacent to the lamina cribrosa or be caused by spasm of arterioles) [21]. Capillary stasis immediately leads to stasis in the adjacent venule which spreads to the CRV. The reason is the aforementioned blood flow turbulence in the retrolaminar part of the CRV due to IOP increase and pressure drop in the vein below IOP. The period of IOP increase might be too short to activate blood flow autoregulation. As a result it leads to OPP decrease [16] followed by the release of inflammatory mediators, arrival of leukocytes and other thrombosis-inducing factors.
According to published data, blood flow decrease itself is not as important in POAG pathogenesis as vascular dysregulation [1]. It is suggested that it is characteristic of both glaucoma and retinal vein occlusion for it affects the venous system as well [28].
We have recently discovered that ocular blood flow is dependent on heart rate variability, especially in NTG [19]. Other authors note that OPP is not as relevant as its fluctuation which may be caused by blood flow instability in the setting of vascular dysregulation. The latter is believed to be one of the mechanisms of glaucomatous optic neuropathy progression (due to ocular blood flow autoregulation failure) in patients with normal IOP [20].
The aforementioned factors may be the cause of venous blood flow impairment revealed in both groups of POAG patients and especially marked in NTG. It is known that short-term IOP and OPP fluctuation does not immediately lead to axonal injury: the retina can even withstand increased IOP for an hour, and axons – weeks and months after the development of local ischemia. In contrast to that, ocular microcirculation becomes impaired several minutes after moderate IOP fluctuation [18]. This is the exact mechanism that triggers other pathologic processes leading to neuron apoptosis. It may be assumed that microvasculature (arterioles, venules, and capillaries) involvement is just as important in GON development as venous outflow impairment in larger ocular blood vessels. Another assumption is that CRV architectonics – mainly in the part that goes through the lamina cribrosa – may also be an underlying cause of venous stasis in patients with IOP fluctuation. Moreover, these factors may be hereditary.
As mentioned above, there are three possible anatomical features of CRV. The first one is significant narrowing of CRV past the lamina cribrosa. In this case IOP increase in systole leads to higher blood inflow, which in turn results in dramatic pressure increase in the part of CRV passing through the lamina cribrosa. The blood is pushed through the narrow space creating turbulence in the intraorbital segment of the vein and ultimately resulting in venous stasis and OPP drop.
The second option is completely different with insufficient CRV narrowing in the lamina cribrosa. In such instance CRV starts to pulsate intensely with each systole leading to pressure drop below IOP followed by collapse in the prelaminar part of CRV and venous stasis. In both scenarios the vein wall is at risk of mechanical damage. Only in the third scenario – moderate (adequate) CRV narrowing – the systolic pressure in this blood vessel equals IOP and the diastolic pressure is slightly higher than that. In this case no turbulence is observed. Apparently the abovementioned clinical situation is not common in glaucoma. Whether it is true or not is yet to be determined with the help of morphological studies of the eye made available due to modern visualization systems.
Only in a few studies devoted to the blood flow in glaucoma, the authors studied venous blood flow velocities using CDI. Plange et al. (2006) observed that end diastolic blood flow velocity in CRV had high correlation with the optic disc retinal rim volume (r = 0.56) and RNFLT (r = 0.49). It is noteworthy that the authors have not observed any correlation with the arterial blood flow parameters. Interestingly, the velocity of blood flow in CRV correlated neither with the age of patients nor with the level of IOP [30].
Reduced blood flow velocity in CRV in POAG (including NTG) was also noted in other studies [31, 32]. Furthermore, an increase in pressure in the CRV was observed in glaucoma associated with reduced blood flow velocities in this vessel [33]. The spontaneous CRV pulsation, a sign of increased venous blood flow, correlates with visual field defects [34]. In some studies an influence of increased venous pressure on the POAG progression has been noted [35].
In a recent study by means of Doppler OCT a significant decrease in retinal blood flow and retinal venous blood flow velocity in patients with glaucoma as compared with healthy subjects was reported [36]. Regression analysis carried out by these authors showed that lower values of retinal blood flow and morphometric (structural) parameters were independent predictors of the occurrence of visual field defects.
Venous blood flow features found in the current study (decreased venous blood flow and its correlation with clinical data) as well as previously discovered signs of vascular dysregulation in POAG, more pronounced in NTG, are important proof of the role of vascular disorders – mainly the venous system – in GON pathogenesis. These findings warrant further research and development of novel treatment options.
References
- Weinreb R, Harris A (2009) Ocular blood flow in glaucoma: the 6th consensus report of the world glaucoma association. Kugler Publications, Amsterdam,the Netherlands. 1-159.
- Quigley H, Addicks E (1981) Optic nerve damage in human glaucoma. The sit of injury and susceptibility to damade. Arch Ophthalmol. 99(4): 635-649.
- Hayreh S.S (2011) Ischemic Optic Neuropathies. Springer. 456.
- Yamazaki Y, Drance SM (1997) The relationship between progression of visual field defects and retrobulbar circulation in patients with glaucoma. Am J Ophthalmol. 124(3):287-95.
- Galassi F, Sodi A, Ucci F, Renieri G, Pieri B, et al. (2003) Ocular hemodynamics and glaucoma prognosis: a color Doppler imaging study. Arch Ophthalmol.121(12):1711-5.
- Satilmis M, Orgül S, Doubler B, Flammer J (2003) Rate of progression of glaucoma correlates with retrobulbar circulation and intraocular pressure. Am J Ophthalmol. 135(5): 664-9.
- Janulevičiene I, Ehrlich R, Siesky B, Nedzelskienė I, Harris A (2011) Evaluation of hemodynamic parameters as predictors of glaucoma progression. J Ophthalmol. 2011:164320.
- Jimenez-Aragon F, Garcia-Martin E, Larrosa-Lopez R, Artigas-Martín JM, Seral-Moral P, et al. (2013) Role of color Doppler imaging in early diagnosis and prediction of progression in glaucoma. Biomed Res Int. 2013:871689.
- Suprasanna K, Shetty CM, Charudutt S, Kadavigere R (2014) Doppler evaluation of ocular vessels in patients with primary open angle glaucoma. J Clin Ultrasound. 42(8): 486-91.
- Calvo P, Ferreras A, Polo V, Güerri N, Seral P, et al. (2012) Predictive value of retrobulbar blood flow velocities in glaucoma suspects. Invest Ophthalmol Vis Sci. 53(7): 3875-84.
- Plange N, Kaup M, Weber A, Harris A, Arend KO, et al. (2009) Performance of colour Doppler imaging discriminating normal tension glaucoma from healthy eyes. Eye (Lond). 23(1):164-70.
- Meng N, Zhang P, Huang H, Ma J, Zhang Y, et al. (2013) Color Doppler imaging analysis of retrobulbar blood flow velocities in primary open-angle glaucomatous eyes: a meta-analysis. PLoS One. 8(5):e62723.
- Jimenez-Aragon F, Garcia-Martin E, Larrosa-Lopez R, Artigas-Martín JM, Seral-Moral P, et al. (2013) Biomed Role of color Doppler imaging in early diagnosis and prediction of progression in glaucoma. Res Int. 2013:871689.
- Abegao Pinto L, Vandewalle E, Stalmans I (2012) Disturbed correlation between arterial resistance and pulsatility in glaucoma patients. Acta Ophthalmol. 90: 214–20.
- Balaratnasingam C, Morgan WH, Hazelton ML (2007) Value of retinal vein pulsation characteristics in predicting increased optic disc excavation. Br J Ophthalmol. 91: 441–4.
- Flammer J, Mozaffarieh M (2008) Autoregulation, a balancing act between supply and demand. Can. J. Ophthalmol. 43: 317-21.
- Francois J, Neetens A (1964) Vascularity of the eye and optic nerve in glaucoma. Arch. Ophthalmol. 71: 219-25.
- Krakau CE (1994) Disk hemorrhages and retinal vein occlusions in glaucoma. Surv Ophthalmol. 38(1): 18–21.
- Kurysheva N, Tsaregorodtseva M, Irtegova E, Ryabova T, Shlapak V (2011) Ocular perfusion pressure and primary vascular dysregulation in normal tension glaucoma. Glaucoma. 3:11-7.
- Nicolela MT (2008) Clinical clues of vascular dysregulation and its association with glaucoma. Can. J. Ophthalmol. 43(3): 337-41.
- Pillunat L, Anderson DR, Knighton R (1997) Autoregulation of human optic nerve head circulation in response to increased intraocular pressure. Exp. Eye Res. 64(6): 737-44.
- Shields M (2008) Normal-tension glaucoma: is it different from primary open-angle glaucoma? Current Opinion in Ophthalmology. 19( 2): 85-8.
- Rankin SJ, Drance SM (1996) Peripapillary focal retinal arteriolar narrowing in open angle glaucoma. J. Glaucoma. 5(1): 22-8.
- Goepfert C, Ifune C, Tempelhoff R (2010) Ischemic optic neuropathy: are we any further? Current Opinion in anaesthesiology. 23(12): 582-7.
- Ehrlich R, Harris A, Seisky B (2011) Repeatability of retrobullbar blood flow velocity measured using color Doppler imaging in the Indianappolis Glaucoma Progression Study. J.Glaucoma. 20(9): 540-8.
- Rusia D, Harris A, Pernic A (2010) Feasibility of creating a normative database of colour doppler imaging parameters in glaucomatous eyes and controls (Review). Br J of Ophthalmol 95(9):1193-1198.
- Bill A (1984) Circulation in the eye. The handbook of physiology: cardiovascular system. American Physiological Society. 1001-34.
- Fraenkl S, Mozaffarieh M, Flammer J (2010) Retinal vein occlusions: the potential impact of a dysregulation of the retinal veins. European association for predictive, preventive and personalized medicine Journal. 1(3): 253-61.
- Jonas J (2003) Ophthalmodynamometric assessment of the central retinal vein collapse pressure in eyes with retinal vein stasis or occlusion. Graefe’s archive fur kiln. Und exper. Ophthalmologie. 241(19): 367-70.
- Plange N, Kaup M, Weber A, Arend K, Remky A (2006) Retrobulbar haemodynamics and morphometric optic disc analysis in primary openangle glaucoma. Br J Ophthalmol. 90(12): 1501-1504.
- Wolf S, Arend O, Sponsel W.E, Schulte K, Cantor L.B, et al. (1993) Retinal Hemodynamics Using Scanning Laser Ophthalmoscopy and Hemorheology in Chronic Open-angle Glaucoma. Ophthalmology [Internet]. Elsevier BV.100(10): 1561-6.
- Pinto L, Vandewalle E, De Clerck E, Marques-Neves C, Stalmans I (2012) Lack of spontaneous venous pulsation: possible risk indicator in normal tension glaucoma? Acta Ophthalmologica [Internet]. 91(6): 514-20.
- Meyer-Schwickerath R, Kleinwächter T, Papenfuв H-D, Firsching R (1995) Central retinal venous outflow pressure. Graefe’s Arch Clin Exp Ophthalmol [Internet]. 233(12):783-8.
- Morgan W.H, Hazelton M.L, Azar S.L, House P.H, Yu D.Y, et al. (2004) Retinal venous pulsation in glaucoma and glaucoma suspects. Ophthalmology. 111: 1489-1494.
- Morgan WH, Balaratnasingam C, Hazelton ML, House PH, Cringle SJ, et al. (2005) The force required to induce hemi- vein pulsation is associated with the site of maximal field loss in glaucoma. Invest Ophthalmol Vis Sci. 46: 1307-1312.
- Hwang J, Konduru R, Zhang X, Tan O, Francis B, et al. (2012) Relationship among Visual Field, Blood Flow, and Neural Structure Measurements in Glaucoma. Invest Ophthalmol Vis Sci. 53: 3020-3026.


