Photoacoustic Imaging in Ophthalmology
Hu Z1,2, Wang X3, Liu Q2, Paulus YM1,3*
1 Department of Ophthalmology and Visual Sciences, University of Michigan, Ann Arbor, MI, USA.
2 Department of Ophthalmology, The First Affiliated Hospital of Nanjing Medical University, Nanjing, China.
3 Department of Bioengineering, University of Michigan, Ann Arbor, MI, USA.
*Corresponding Author
Yannis M. Paulus MD,
Department of Ophthalmology and Visual Sciences,
University of Michigan, 1000 Wall Street,
Ann Arbor, MI 48105, USA.
Tel: +1-734-763-8122
Fax: +1-810-694-5295
E-mail: ypaulus@med.umich.edu
Article Type : Review Article
Received: July 27, 2015; Accepted: September 04, 2015; Published: September 09, 2015
Citation: Hu Z, Wang X, Liu Q, Paulus YM (2015) Photoacoustic Imaging in Ophthalmology. Int J Ophthalmol Eye Res 03(8), 126-132. doi: dx.doi.org/10.19070/2332-290X-1500027
Copyright: Paulus YM© 2015. This is an open-access article distributed under the terms of the Creative Commons Attribution License, which permits unrestricted use, distribution and reproduction in any medium, provided the original author and source are credited.
Abstract
Photoacoustic (PA) imaging is a rapidly developing new biomedical imaging modality. Unlike existing ophthalmic imaging technology such as fundus photography, optical coherence tomography, fluorescein and indocyanine green angiography, and ultrasound, photoacoustic imaging combines the advantages of optical excitation and acoustic detection. The lightabsorbing hemoglobin and melanin can be detected noninvasively and sensitively by photoacoustic imaging. This paper reviews recent developments of photoacoustic imaging in ophthalmological research, from basic principles to applications. Emphasis is given to the photoacoustic ophthalmoscopy and its multimodal imaging capability.
2.Introduction
3.Fundamentals of photoacoustic imaging
4.PA imaging of anterior segment of eye
5.PA imaging of posterior segment of eye
6.Multimodal PA imaging system
7.PA in retinal metabolism
8.Prospects
9.Acknowledgements
10.References
Keywords
Photoacoustic Imaging; Photoacoustic Ophthalmoscopy (PAOM); Ultrasound; Multimodal Imaging; Functional Imaging.
Introduction
Retinal imaging technology is rapidly advancing in parallel with new pharmacotherapies to treat neovascularization along with stem cell and gene therapies. Well-established imaging instruments include color fundus photography, optical coherence tomography (OCT) [1], fluorescein and indocyanine green angiography (FA and ICGA) [2, 3], fundus autofluorescence [4], and B scan ultrasonography. Spectral-domain OCT (SD-OCT) and swept-source OCT can achieve cross-sectional images to determine the layer of the retina involved with high axial-resolution. However, OCT uses interferometry and the contrast is based on the photons backscattered from the biological tissue. Thus, OCT mainly provide the information about scattering properties of retina. In clinic, ophthalmic OCT often creates an anatomic image but does not give physiologic or functional information, such as hemoglobin oxygen saturation (sO2) in fundus vessels and melanin concentration in retinal pigment epithelium (RPE) and choroid. Newly developed OCT angiography allows for visualization of the vasculature but without allowing for determination of vessel leakage. Though microvascular circulation is visualized by angiography, the limitations of FA and ICGA are the need of an intravenous injection of a contrast agent. The extrinsic contrast agent makes angiography an invasive imaging method and it is not considered for patients with allergic concerns. In addition, there is usually a limited function period for the contrast agent after injection.
Photoacoustic (PA) imaging, as a hybrid biomedical imaging method, exploits both optical and acoustical properties and provides functional and structural information. With technical advances in laser sources, computer signals processing, and ultrasonic detectors, PA imaging has been drawing increasing attention in biological research and clinical practice in the last decade. Since Wang et al [5] first mapped the vascular structure and functional cerebral hemodynamic changes in the rat brain with PA imaging, remarkable achievements have been made in the fields of cardiology [6-8], musculoskeletal [9, 10], sentinel lymph nodes [11, 12] and oncology [13, 14], particularly in breast cancer [15, 16]. The eye is considered very suitable for the application of PA imaging due to its accessibility, optical properties, and endogenous light absorbing molecules. As photoacoustic signals are generated by the absorption of pulsed laser illumination, images of the physiologically specific optical absorption contrast in eye can thus be provided, which is not available in all existing ophthalmic imaging modalities. Additional advantages over other imaging modalities are that PA imaging can provide images with relatively high spatial resolution non-invasively. Photoacoustic microscopy (PAM), one of the major branches of PA imaging, has found its application in in vivo imaging of retinal and choroid vessels [17, 18], and RPE cells [19, 20], as well as the metabolism of the retina [21, 22].
This review focuses on the PA application in ophthalmology and is organized in the following order:
(1) fundamentals of photoacoustic imaging,
(2) PA in the anterior segment,
(3) PA in the retina,
(4) multimodal PA imaging system,
(5) PA in retinal metabolism, and
(6) prospects and challenges for PA development in the future.
Fundamentals of photoacoustic imaging
Alexander Graham Bell first described the photoacoustic effect in 1880 [23]. Typically, a nanosecond pulse laser beam is used to irradiate the target tissue(s) of interest causing photons to propagate inside. Absorption of these photons leads to a slight localized transient temperature rise of the tissue, followed by a transient thermoelastic expansion. Ultrasonographic pressure waves, called PA waves, can be induced by the transient thermoelastic expansion and detected by broadband ultrasonic transducers, and imaged. Different biologic tissues generate different PA signals due to their unique light-absorbing attributes. Melanin and hemoglobin are the two primary optically absorbing molecules in the eye. Hemoglobin localizes to blood vessels and neovascularization while melanin is found in the iris, ciliary body, choroid, and retinal pigment epithelium (RPE). Thus, illuminating a laser on them will provide the functional and anatomical imaging of the blood vessels and the pigmented issue in the eye. Depending on the application fields, achievable spatial resolution, and technique used, PA imaging is divided into optical-resolution photoacoustic microscopy (OR-PAM), acoustic-resolution microscopy (AR-PAM), photoacoustic computed tomography (PACT), and photoacoustic endoscopy (PAE). AR-PAM and OR-PAM were mainly applied in ophthalmology. For AR-PAM, a diffusive illumination laser is needed to deliver to deep tissue and a scanning focused ultrasound transducer is used to detect the PA signals. For OR-PAM, the optical illumination laser is strongly focused while the detective ultrasound transducer is focused or unfocused. Thus, the lateral resolution of AR-PAM and OR-PAM is determined by the ultrasonic focal spot and optical focal spot respectively. The axial resolution of both PAM is determined by the ultrasonic center frequency and bandwidth. At a depth of 1 mm, OR-PAM was reported to generate resolution down to 0.2 μm (subcellular level) [24]. Table 1 shows the main characteristics of PAI, OCT, ultrasound, fundus angiography, autofluorescence, and ultrasound. Photoacoustic ophthalmoscopy (PAOM) is developed based on OR-PAM but with a scanning laser to increase the speed of acquisition [17, 25]. Figure 1 shows a schematic of the experimental system of POAM [20]. POAM system is consisted of PAM and OCT. The two technologies can operate with different light sources or with a single light source, which is firstly reported by Zhang et al [26]. A pulsed laser pumped by a laser system with certain repetition rate and optical wavelength is used as the irradiation source. The output laser light is firstly attenuated by a neutral density filter to the desired energy and the beam size is reduced with a beam reducer to fit the aperture of the optical components. In Figure 1, the laser pulses are coupled into the source arm of a 2 × 2 single-mode optical fiber coupler to form the basis of a fiber-based Michelson interferometer for OCT imaging. If OCT uses different laser source, another light beam is required for simultaneous OCT imaging. The induced PA waves are detected by a commercial ultrasonic transducer, amplified by an amplifier and then digitized and streamed to the computer by a high-speed digitizer.
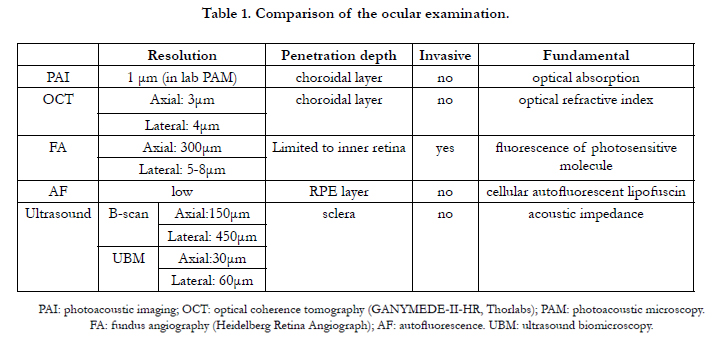

Table 1. Comparison of the ocular examination.
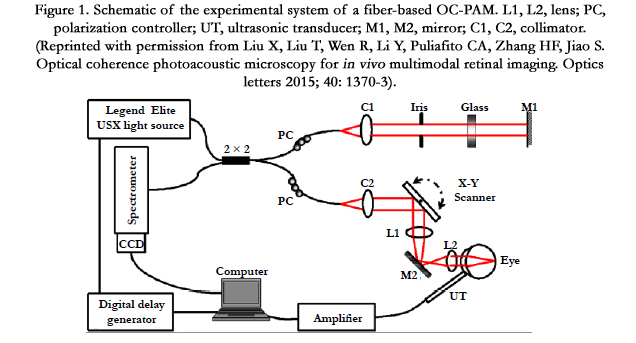
Figure 1. Schematic of the experimental system of a fiber-based OC-PAM. L1, L2, lens; PC, polarization controller; UT, ultrasonic transducer; M1, M2, mirror; C1, C2, collimator. (Reprinted with permission from Liu X, Liu T, Wen R, Li Y, Puliafito CA, Zhang HF, Jiao S. Optical coherence photoacoustic microscopy for in vivo multimodal retinal imaging. Optics letters 2015; 40: 1370-3).
Of note, photoacoustic signals from iris vascular and corneal neovascularization can transmit coaxially with the illumination laser light through a plano-concave lens, and then be detected by an ultrasonic transducer [27, 28]. As for the posterior segment, because crystalline lens is a strong acoustic absorber, usually an ultrasound transducer with low frequency is a choice to reduce the signal attenuation on the premise not affecting the axial resolution [29]. In addition, a tilted transducer, which has an angle to laser beam, was used to detect the photoacoustic signals through a path avoiding the lens [30]. Similarly, PA signals from fundus can also be detected with an unfocused needle ultrasound transducer placed in contact with the eyelid [17, 18]. Different from conventional PAM, where the illuminating light is focused in the focal zone of a focused ultrasonic transducer, the imaging target in POAM is placed in the far-field of an unfocused transducer to provide an field of view (FOV) as large as possible [31].
In addition to the imaging function, multiwavelength PAOM can non-invasively measure the concentration of deoxygenated and oxygenated hemoglobin inside the retinal blood vessels to determine the oxygen saturation and the retinal metabolic rate.
PA imaging of anterior segment of eye
In 2010, Silverman et al. [30] demonstrated PA imaging and pulse/echo ultrasound of the anterior segment in whole ex vivo pig eye. With a 20-MHz ultrasound transducer, the pulse/echo image showed reflections from the corneal surfaces and that of the lens, as well as backscatter from the iris. PA imaging showed the anterior surfaces of the cornea and the lens, and the pigmented iris. The sharpness of these surfaces seemed far superior in the PA image to that of the 20-MHz pulse/echo image. Silverman et al. postulated that visualization of the anterior surface of cornea might be due to an unknown chromophore or some post-mortem changes occurring in the thin tissue layer of the cornea and lens surface, leading to the photoacoustic signal. Hu et al used ORPAM to image the peripheral ciliary processes, major iris circle, radial iris arteries, and even a single red blood cell with resolution down to a few micrometers [27, 32]. In the same year, Jiang et al. [33] imaged the details of ciliary body with adaptive optics photoacoustic microscopy.
PA imaging of posterior segment of eye
Using acoustic resolution microscopy, de la Zerda et al. [34] used a pulsed laser (740 nm) combined with a movable ultrasound transducer (25MHz) to mechanically scan the eyes of living rabbits and visualized the cornea, lens, iris, and posterior pole (Figure 2 and Figure 3). However, due to the system’s limited resolution, signals from retina, choroid, and sclera could not be resolved. Later, Silverman et al. in 2010 [30] used 1064-nm near-infrared laser with high penetration to provide a clear depiction of the choroid. Jiao et al. [17] was the first to visualize the rat fundus imaging using OCT-guided PAOM in 2010. The combined system consisted of an OCT for alignment and a PAOM for acquisition. Retinal blood vessels and RPE layer were acquired, and it only took 2.7 seconds for the volumetric PAOM images consisting of 256 B-scans. Different from the OCT B-scan images, the retinal vessels demonstrated higher signals with PAOM, and the blood vessels inside the optic disc were much clearer than that in the OCT image. Furthermore, Jiao et al. [17] developed an algorithm to automatically segment or combine the layers of retinal and sub- RPE vessels. Wei et al. [18] firstly applied OCT-guided PAOM in the imaging of choroidal vessels in albino rats and it has been also demonstrated by Song et al. [19] in albino and pigmented rats (Figure 4). The distance from the retinal vessel layer to the choroid is around 200 μm [35] and the axial resolution of PAOM in their study was 23 μm, so the retinal and choroidal vessels could be well resolved along the axial direction. PAOM revealed much richer features of the choroidal vasculature than SD-OCT due to the optical absorption and comparable lateral resolution of SD-OCT. However, PAOM was limited to albino animals when imaging the choroidal vessels due to the high PA signal of the RPE. Near infrared (NIR) light has been suggested as a solution to penetrate the RPE layer in pigmented animals. In 2015, Liu et al. [20] developed an optical coherence photoacoustic microscopy (OC-PAM) system. They adopted a 800 nm laser to reduce the absorption of hemoglobin and to have the major light absorber as melanin in the RPE and choroid. In the PAM fundus image, the choroidal vessels appeared as shadows in areas between the major retinal blood vessels, which was verified in OCT B-scans and histological analysis. In addition to the imaging of retinal and choroidal vessels, Jiang et al. [33] used adaptive optics (AO) to correct the wavefront errors of the illuminating light of PAM, and the PAM system had a lateral resolution better than 2.5 μm. Using the AO-PAM, Jiang et al. [33] clearly visualized single RPE cells with high melanin signals inside the cell body and no or weak signals among the boundaries of the RPE cells (Figure 5).
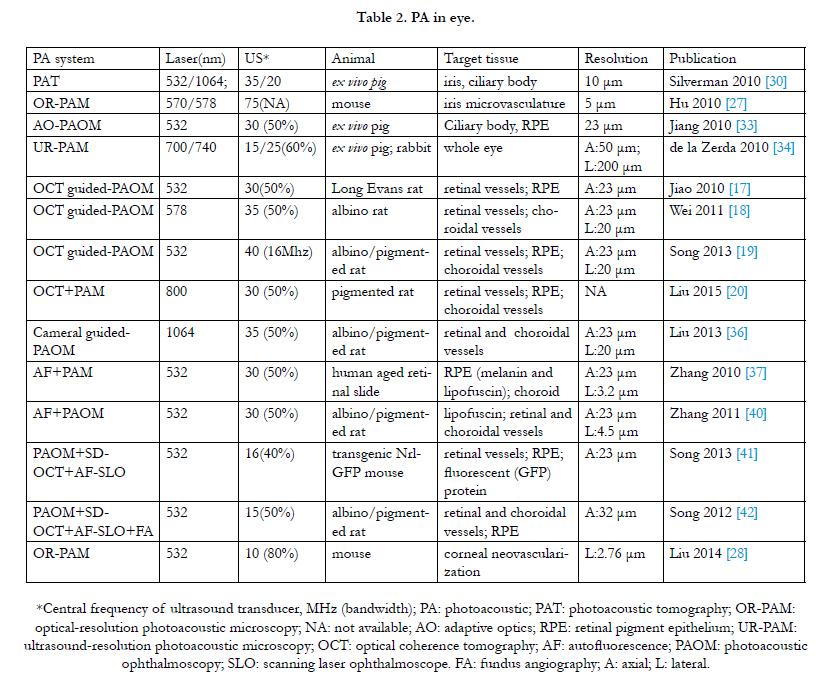
Table 2. PA in eye.
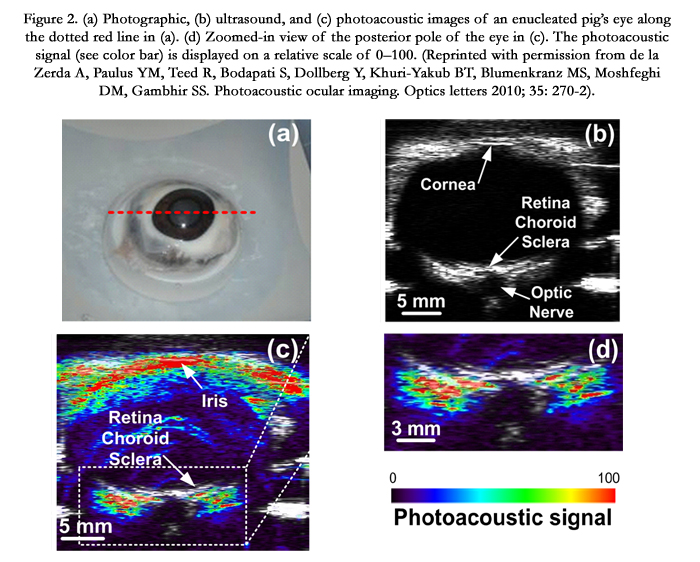
Figure 2. (a) Photographic, (b) ultrasound, and (c) photoacoustic images of an enucleated pig’s eye along the dotted red line in (a). (d) Zoomed-in view of the posterior pole of the eye in (c). The photoacoustic signal (see color bar) is displayed on a relative scale of 0–100. (Reprinted with permission from de la Zerda A, Paulus YM, Teed R, Bodapati S, Dollberg Y, Khuri-Yakub BT, Blumenkranz MS, Moshfeghi DM, Gambhir SS. Photoacoustic ocular imaging. Optics letters 2010; 35: 270-2).
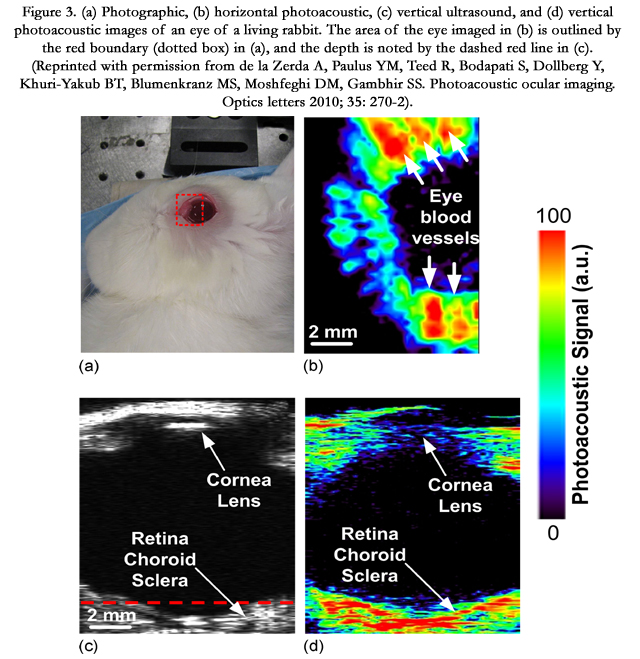
Figure 3. (a) Photographic, (b) horizontal photoacoustic, (c) vertical ultrasound, and (d) vertical photoacoustic images of an eye of a living rabbit. The area of the eye imaged in (b) is outlined by the red boundary (dotted box) in (a), and the depth is noted by the dashed red line in (c). (Reprinted with permission from de la Zerda A, Paulus YM, Teed R, Bodapati S, Dollberg Y, Khuri-Yakub BT, Blumenkranz MS, Moshfeghi DM, Gambhir SS. Photoacoustic ocular imaging. Optics letters 2010; 35: 270-2).
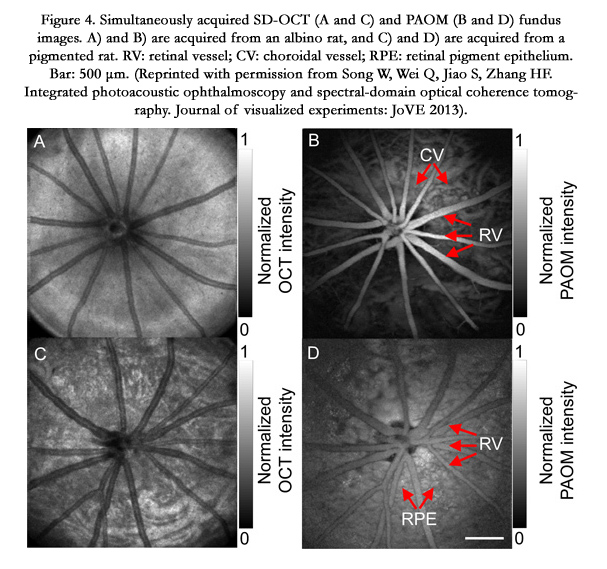
Figure 4. Simultaneously acquired SD-OCT (A and C) and PAOM (B and D) fundus images. A) and B) are acquired from an albino rat, and C) and D) are acquired from a pigmented rat. RV: retinal vessel; CV: choroidal vessel; RPE: retinal pigment epithelium. Bar: 500 μm. (Reprinted with permission from Song W, Wei Q, Jiao S, Zhang HF. Integrated photoacoustic ophthalmoscopy and spectral-domain optical coherence tomography. Journal of visualized experiments: JoVE 2013).
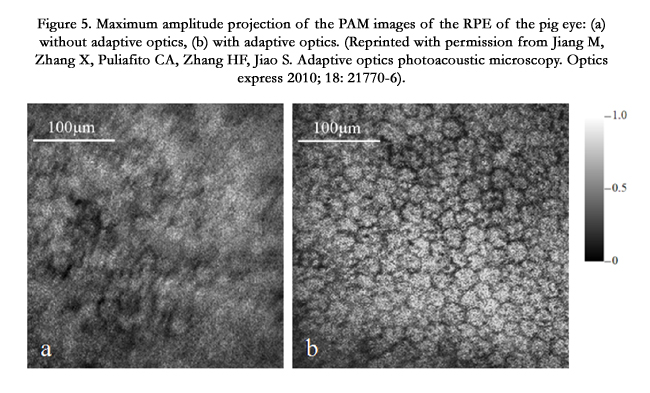
Figure 5. Maximum amplitude projection of the PAM images of the RPE of the pig eye: (a) without adaptive optics, (b) with adaptive optics. (Reprinted with permission from Jiang M, Zhang X, Puliafito CA, Zhang HF, Jiao S. Adaptive optics photoacoustic microscopy. Optics express 2010; 18: 21770-6).
Multimodal PA imaging system
PA imaging can provide more comprehensive information of the target tissue when combined with other ocular imaging methods such as ultrasound, OCT, fluorescence, and scanning laser ophthalmoscope (SLO). These combined modalities provide realtime images simultaneously and compensate the weaknesses of each other. The multimodal imaging begins with the development of OCT-guided PAOM [17-20]. Liu et al. [36] used fundus camera to replace OCT and found the camera captured both retinal anatomy and PAOM illumination at the same time. The fundus camera helped reduce the PAOM alignment time from several minutes to 30 seconds. PAOM and autofluorescence (AF) [37] have also been integrated. In RPE cells, apart from the highly light-absorbing pigment melanin, there is another major pigment called lipofuscin. Lipofuscin is autofluorescent, photoreactive, and is believed as a risk factor to exacerbate visible light stress, while melanin acts as an antioxidant and protects against light stress. Thus, measuring the concentration and spatial distribution of the two types of pigments provides important information in the research and diagnosis of degenerative retinopathies such as dry age-related macular degeneration (AMD) [38, 39]. As reported in a human aged retinal slide by Zhang et al. [37], AF only detected the lipofuscin inside the RPE cells, while PAOM specifically detected the melanin in choroid and RPE. In in vivo albino and pigmented rats, AF and PAOM imaging modes were perfectly registered [40]. In albino rats, POAM visualized retinal vessels and choroidal vessels. In pigmented rats, PAOM only visualized retinal vessels and RPE layer. AF images indicated that lipofuscin concentration in the RPE layer increased with age and was higher in albino rat RPE than that from the pigmented rat. Such optimized imaging system which integrated PAOM, SD-OCT, and autofluorescence-scanning laser ophthalmoscopy (AF-SLO) has also been reported[41]. The multimodal capability was demonstrated by imaging the green fluorescent protein (GFP) in photoreceptors from transgenic Nrl-GFP mice41. Based on previous work, Songet al. [42] further developed the multimodal imaging platform integrating PAOM with SD-OCT, SLO, and FA to provide optical absorption, optical backscattering, and fluorescence properties of the albino and pigmented rat retina.
PA in retinal metabolism
Retinal oxygenation plays an important role in several of the leading causes of visual impairment and blindness worldwide. Oxygenation is associated with ocular disorders such as retinal artery and venous occlusion, hypertension, diabetic retinopathy, and glaucoma. As essential parameters, vascular hemoglobin oxygen saturation (sO2) and retinal oxygen metabolic rate (rMRO2) can be critical in investigating these blinding diseases. Researchers have mainly focused on multi-spectral fundus photography based on oximetry [43-45]. However, fundus photography is sensitive to light scattering and is easily affected by such retinal local parameters as vessel size, melanin concentration. Optical coherence tomography (OCT) has been reported with the potential to measure retinal sO2 measurement noninvasively [46, 47]. The in vivo retinal oximetry study of Yi et al. [47] was mainly performed on vessels with diameters between 30 and 130 μm. Challenges exit for larger vessels because light is strongly attenuated through longer optical path and therefore little can be reflected from the bottom vessel wall. On the other hand, it is also difficult for quantification in capillaries, which are close to 10μm, due to low optical absorption. Therefore there is still a long way before OCT can be verified to precisely measure sO2 at various anatomical sites. Photoacoustic (PA) imaging provides a new method to accurately sense oxygen saturation through direct measurement of light absorption within blood [48]. In 2010, Hu et al. [27] firstly mapped the oxygen saturation in the iris microvasculature in a living adult mouse. Song et al. [21] and Liu et al. [22] quantified retinal blood flow by Doppler SD-OCT and retinal oxygen saturation by multiwavelength PAOM. With the blood flow and retinal oxygen saturation, the retinal oxygen metabolic rate (rMRO2) could then be calculated.
Prospects
Photoacoustic imaging, especially PAOM, has made great achievements in the imaging of retinal vessels, RPE, and choroid. While this appealing method is still in its infancy, it has extensive potential in the field of ophthalmology. Although most reports have focused on the PAOM, photoacoustic tomography (PAT) is also a potentially promising modality and may provide more information for the conventional ophthalmic B-scan. In future research, PAT can be applied in the visualization of ocular tumor such as retinoblastoma and melanoma. The capability to measure microvasculature including neovascularization with high-resolution is important for the study and diagnosis of angiogenesis. Most existing reports focus on the imaging of larger ocular vessels, except one which visualized corneal neovascularization by OR-PAM [28]. More attention should be paid to the application of PAOM in the research of in vivo animal models of retinal neovascularization and choroidal neovascularization. The retinal pigment epithelium (RPE) plays a key role in the support of photoreceptor function and is associated with several retinal diseases, including macular degeneration. PAOM may be a good choice for studying the pathophysiology and early screening of diseases of the RPE. In addition, photoacoustic imaging is ideally suited to image the choroidal vessels due to the higher depth of penetration. While studies have reported PA systems less than the ANSI laser safety regulations [49], monitoring the short- or long-term effect still merits investigation. Photoacoustic imaging is rapidly developing and optimization of parameters is rapidly improving image quality and speed of acquisition. Continuous innovations in photoacoustic technology make us believe that photoacoustic imaging will play an indispensable role in the future of ophthalmology.
Acknowledgements
The work was sponsored by and the University of Michigan Department of Ophthalmology and the Jiangsu Provincial Special Program of Medical Science (BL2014089).
References
- Huang D, Swanson EA, Lin CP, Schuman JS, Stinson WG, et al. (1991) Optical coherence tomography. Science 254(5035): 1178-1181.
- Stanga PE, Lim JI, Hamilton P (2003) Indocyanine green angiography in chorioretinal diseases: indications and interpretation: an evidence-based update. Ophthalmology 110(1): 15-21.
- Kang SW, Park CY, Ham DI (2004) The correlation between fluorescein angiographic and optical coherence tomographic features in clinically significant diabetic macular edema. Am J Ophthalmol 137(2): 313-322.
- Greenberg JP, Duncker T, Woods RL, Smith RT, Sparrow JR, et al. (2013) Quantitative fundus autofluorescence in healthy eyes. Invest Ophthalmol Vis Sci 54(8): 5684-5693.
- Wang X, Pang Y, Ku G, Xie X, Stoica G, et al. (2003) Noninvasive laserinduced photoacoustic tomography for structural and functional in vivo imaging of the brain. Nat Biotechnol 21(7): 803-806.
- Razansky D, Harlaar NJ, Hillebrands JL, Taruttis A, Herzog E, et al. (2012) Multispectral optoacoustic tomography of matrix metalloproteinase activity in vulnerable human carotid plaques. Mol Imaging Biol 14(3): 277-285.
- Hu S, Wang LV (2010) Photoacoustic imaging and characterization of the microvasculature. J Biomed Opt 15(1): 011101-15.
- Li L, Maslov K, Ku G, Wang LV (2009) Three-dimensional combined photoacoustic and optical coherence microscopy for in vivo microcirculation studies. Opt Express 17(19): 16450-16455.
- Kaiplavil S, Mandelis A, Wang X, Feng T (2014) Photothermal tomography for the functional and structural evaluation, and early mineral loss monitoring in bones. Biomed Opt Express 5(8): 2488-2502.
- Biswas SK, van Es P, Steenbergen W, Manohar S (2015) A method for delineation of bone surfaces in photoacoustic computed tomography of the finger. Ultrason imaging 0161734615589288.
- Luke GP, Myers JN, Emelianov SY, Sokolov KV (2014) Sentinel lymph node biopsy revisited: ultrasound-guided photoacoustic detection of micrometastases using molecularly targeted plasmonic nanosensors. Cancer Res 74(19): 5397-5408.
- Luke GP, Emelianov SY (2015) Label-free Detection of Lymph Node Metastases with US-guided Functional Photoacoustic Imaging. Radiology 141909.
- Levi J, Kothapalli SR, Bohndiek S, Yoon JK, Dragulescu-Andrasi A, et al. (2013) Molecular photoacoustic imaging of follicular thyroid carcinoma. Clin Cancer Res 19(6): 1494-1502.
- Bhattacharyya S, Wang S, Reinecke D, Kiser W Jr, Kruger RA, et al. (2008) Synthesis and evaluation of near-infrared (NIR) dye−herceptin conjugates as photoacoustic computed tomography (PCT) probes for HER2 expression in breast cancer. Bioconjug Chem 19(6): 1186-1193.
- Kitai T, Torii M, Sugie T, Kanao S, Mikami Y, et al. (2014) Photoacoustic mammography: initial clinical results. Breast Cancer 21(2): 146-153.
- Heijblom M, Piras D, Xia W, van Hespen JC, Klaase JM, et al. (2012) Visualizing breast cancer using the Twente photoacoustic mammoscope: what do we learn from twelve new patient measurements? Opt Express 20(11):11582-11597.
- Jiao S, Jiang M, Hu J, Fawzi A, Zhou Q, et al. (2010) Photoacoustic ophthalmoscopy for in vivo retinal imaging. Opt Express 18(4): 3967-3972.
- Wei Q, Liu T, Jiao S, Zhang HF (2011) Image chorioretinal vasculature in albino rats using photoacoustic ophthalmoscopy. J Mod Opt 58(21): 1997-2001.
- Song W, Wei Q, Jiao S, Zhang HF (2013) Integrated photoacoustic ophthalmoscopy and spectral-domain optical coherence tomography. J Vis Exp (71): e4390.
- Liu X, Liu T, Wen R, Li Y, Puliafito CA, et al. (2015) Optical coherence photoacoustic microscopy for in vivo multimodal retinal imaging. Opt Lett 40(7): 1370-1373.
- Song W, Wei Q, Liu W, Liu T, Yi J, et al. (2014) A combined method to quantify the retinal metabolic rate of oxygen using photoacoustic ophthalmoscopy and optical coherence tomography. Scientific reports 4.
- Liu W, Zhang HF (2014) Noninvasive in vivo imaging of oxygen metabolic rate in the retina. Conf Proc IEEE Eng Med Biol Soc 2014: 3865-3868.
- Bell AG (1880) On the production and reproduction of sound by light. Am J Sci 20(3): 305-324.
- Zhang C, Maslov K, Wang LV (2010) Subwavelength-resolution label-free photoacoustic microscopy of optical absorption in vivo. Opt Lett 35(19):3195-3197.
- Xie Z, Jiao S, Zhang HF, Puliafito CA (2009) Laser-scanning optical-resolution photoacoustic microscopy. Opt lett 34(12): 1771-1773.
- Zhang X, Zhang HF, Jiao S (2012) Optical coherence photoacoustic microscopy: accomplishing optical coherence tomography and photoacoustic microscopy with a single light source. J Biomed Opt 17(3): 030502.
- Hu S, Rao B, Maslov K, Wang LV (2010) Label-free photoacoustic ophthalmic angiography. Opt Lett 35(1): 1-3.
- Liu W, Schultz KM, Zhang K, Sasman A, Gao F, et al. (2014) In vivo corneal neovascularization imaging by optical-resolution photoacoustic microscopy.Photoacoustics 2(2): 81-86.
- Ma T, Zhang X, Chiu CT, Chen R, Shung KK, et al. (2014) Systematic study of high-frequency ultrasonic transducer design for laser-scanning photoacoustic ophthalmoscopy. J Biomed Opt 19(1): 16015.
- Silverman RH, Kong F, Chen YC, Lloyd HO, Kim HH, et al. (2010) Highresolution photoacoustic imaging of ocular tissues. Ultrasound Med Biol 36(5): 733-742.
- Zheng F, Zhang X, Chiu CT, Zhou BL, Shung KK, et al. (2012) Laserscanning photoacoustic microscopy with ultrasonic phased array transducer. Biomed Opt Express 3(11): 2694-2699.
- Rao B, Li L, Maslov K, Wang L (2010) Hybrid-scanning optical-resolution photoacoustic microscopy for in vivo vasculature imaging. Opt Lett 35(10): 1521-1523.
- Jiang M, Zhang X, Puliafito CA, Zhang HF, Jiao S (2010) Adaptive optics photoacoustic microscopy. Opt Express 18(21): 21770-21776.
- de La Zerda A, Paulus YM, Teed R, Bodapati S, Dollberg Y, et al. (2010) Photoacoustic ocular imaging. Opt Lett 35(3): 270-272.
- Srinivasan VJ, Ko TH, Wojtkowskt M, Carvalho M, Clermont A, et al. (2006) Noninvasive volumetric imaging and morphometry of the rodent retina with high-speed, ultrahigh-resolution optical coherence tomography. Invest Ophthalmol Vis Sci 47(12): 5522-5528.
- Liu T, Li H, Song W, Jiao S, Zhang HF (2013) Fundus camera guided photoacoustic ophthalmoscopy. Curr Eye Res 38(12): 1229-1234.
- Zhang X, Jiang M, Fawzi AA, Li X, Shung KK, et al. (2010) Simultaneous dual molecular contrasts provided by the absorbed photons in photoacoustic microscopy. Opt Lett 35(23): 4018-4020.
- Weiter JJ, Delori FC, Wing GL, Fitch KA (1986) Retinal pigment epithelial lipofuscin and melanin and choroidal melanin in human eyes. Invest Ophthalmol Vis Sci 27(2): 145-152.
- Delori FC, Goger DG, Dorey CK (2001) Age-related accumulation and spatial distribution of lipofuscin in RPE of normal subjects. Invest Ophthalmol Vis Sci 42(8): 1855-1866.
- Zhang X, Zhang HF, Puliafito CA, Jiao S (2011) Simultaneous in vivo imaging of melanin and lipofuscin in the retina with photoacoustic ophthalmoscopy and autofluorescence imaging. J Biomed Opt 16(8): 080504.
- Song W, Wei Q, Feng L, Sarthy V, Jiao S, et al. (2013) Multimodal photoacoustic ophthalmoscopy in mouse. J Biophotonics 6(6-7): 505-512.
- Song W, Wei Q, Liu T, Kuai D, Burke JM, et al. (2012) Integrating photoacoustic ophthalmoscopy with scanning laser ophthalmoscopy, optical coherence tomography, and fluorescein angiography for a multimodal retinal imaging platform. J Biomed Opt 17(6): 061206.
- Hickam JB, Frayser R, Ross JC (1963) A study of retinal venous blood oxygen saturation in human subjects by photographic means. Circulation 27(3):375-385.
- Vucea V, Bernard PJ, Sauvageau P, Diaconu V (2011) Blood oxygenation measurements by multichannel reflectometry on the venous and arterial structures of the retina. Appl Opt 50(26): 5185-5191.
- Traustason S, Kiilgaard JF, Karlsson RA, Hardarson SH, Stefansson E, et al. (2013) Spectrophotometric Retinal Oximetry in Pigs. Invest Ophthalmol Vis Sci 54(4): 2746-2751.
- Yi J, Li X (2010) Estimation of oxygen saturation from erythrocytes by highresolution spectroscopic optical coherence tomography. Opt Lett 35(12): 2094-2096.
- Yi J, Wei Q, Liu W, Backman V, Zhang HF (2013) Visible-light optical coherence tomography for retinal oximetry. Opt Lett 38(11): 1796-1798.
- Zhang HF, Maslov K, Sivaramakrishnan M, Stoica G, Wang LV (2007) Imaging of hemoglobin oxygen saturation variations in single vessels in vivo using photoacoustic microscopy. Applied physics letters 90(5): 053901.
- Wolbarsht M, Sliney D (1991) Historical development of the ANSI laser safety standard. Journal of Laser Applications 3(1): 5-11.


