Studies of Colorectal Cancer by Nuclear Magnetic Resonance Spectroscopy
Pham Van Huong1, Vu thi Kim Ngoc2*, Vu HT2, Thanh le T3, Phan TH4
1 University of Bordeaux, Talence/Bordeaux, France.
2 Center of Analytical Services and Experimentations (CASE) HCMC, Vietnam.
3 University of Natural Sciences HCMC, Vietnam.
4 Medical Center MEDIC HCMC, Vietnam.
*Corresponding Author
Vu Thi Kim Ngoc,
Center of Analytical Services and Experimentations (CASE) HCMC,
Vietnam.
E-mail: ngocvtk@case.vn
Article Type : Review Article
Received: August 12, 2015; Accepted: December 02, 2015; Published: December 07, 2015
Citation: Pham Van Huong, Vu thi Kim Ngoc, Vu HT, Thanh le T, Phan TH (2015) Studies of Colorectal Cancer by Nuclear Magnetic Resonance Spectroscopy, Int J Magn Nucl Sci. 1(1), 1-5.
Copyright: Vu TK© 2015. This is an open-access article distributed under the terms of the Creative Commons Attribution License, which permits unrestricted use, distribution and reproduction in any medium, provided the original author and source are credited.
Abstract
Nuclear Magnetic Resonance (NMR) spectra have been recorded for urine samples of both male and female colorectal cancerous and healthy persons. Specific differences have been observed, in particular in the spectral range corresponding to some metabolites. The NMR-based metabolomics approach could help to better understand the mechanism of carcinogenesis and offer a non-invasive diagnosis tool.
2.Introduction
3.Experiments
4.Results and Discussion
4.1.Discrimination CRC spectra and Healthy spectra
4.2.Statistical model for the observed spectra
4.3.Prediction of urine-type using Supervised model: Partial Least Squares (PLS)
5.Conclusion
6.Acknowledgments
7.References
Keywords
NMR Metabolomics; Urine Metabolomics; Colorectal Cancer.
Introduction
The advancement of powerful physical methods allows the detection, analyses of several samples such as nanomaterials [1-8] and lived objects [9] etc…. These techniques must be used for the study of cancer, the most disturbing diseases of humanity for the present time [10-13]. Other approaches at the molecular level, such as metabolomics-based analytical techniques in Nuclear Magnetic Resonance (NMR) spectroscopy, Mass spectrometry (MS) may also be considered. In this paper, we shall present our study on colorectal cancer (CRC) by Nuclear Magnetic Resonance spectroscopy. Urine samples from CRC patients and healthy controls were analyzed with 1H-NMR spectra and their spectral profiles after subjection to multivariate analysis. We hope that the obtained results will furnish complementary data to those already obtained by other techniques, in particular by Laser Raman micro- spectroscopy [9-14] and should be usefull for the detection at early-stage CRC cancer by a non-invasive diagnosis. Some papers appeared already in recent years using NMR technique. Nevertheless if the sample is not animal (rat) [15], their number of samples was very limited [16] and did not suit to a statistical technique [17]. In this paper, we shall present our study with much larger number of samples of human urine.
Experiments
Urine samples were collected from 155 adults (86 males, 69 females, from 27 to 81 years, median age 45 years), including 77 CRC patients and 78 healthy persons, who have a physical examination in Medical Center MEDIC HCMC from June 2013 to July 2014. Diagnosis of colorectal cancer were made on the basis of usual clinical and laboratory findings and were confirmed by Colonoscopy. No patient has received chemotherapy, radiation therapy or surgery.
The collected urine samples were dissolved in D2O with 0.1% 3 - (trimethylsilyl) - 1 - (propanesulfonate) TSP. The standard NOESY-1D NMR spectra were obtained on a Bruker AVANCE III 500 Ultrashield Plus Cryo NMR Spectrometer and their spectral profiles analyzed. Then, after normalization and scalling, Principal Component Analysis (PCA) and Partial Least Squares (PLS) were performed by Amix-version 3.9.14 – Bruker to reduce the dimensionality of the NMR data set for extracting useful information from complicated NMR data. The set of marker metabolites were identified from NMR data by Chenomx NMR suite 7.0 software.
Results and Discussion
The spectra of CRC and healthy persons are showed on Figure 1 where the principal peaks are assigned.
The assignment of principal peaks is based on the well known healthy urine spectrum already published by many authors [18-21]:
1. Creatinine / Creatine;
2. Hippurate;
3. Glycine;
4. Citrate;
5.Trimethylamine N-Oxide;
6. Lactate;
7. Alanine;
8. Dimethylamine;
9. Taurine;
10. Methyl Succinate;
11. Leucine/ Isoleucine;
12. Valine;
13. Phenylacetate;
14. Acetic Acid;
15. Phenylacetylglutamine;
16. Threonine;
17. P.Cresol;
18. Acetoacetate;
19. Succinate;
20. Pyruvate;
21. Isocitrate;
22. Aspartate;
23. Trimethylamine;
24. Tyrosine;
25. Histidine;
26. Glutamate;
27. Betaine;
28. Serine;
29. Guanidoacetate;
30. Methionine;
31. Formate.
The CRC spectrum indicated the presence of specific biological component which does not exist in healthy spectrum. Their intensity depends on the concentration of corresponding metabolites.
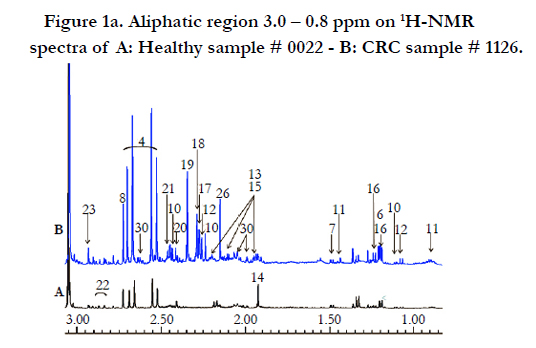
Figure 1a. Aliphatic region 3.0 – 0.8 ppm on 1H-NMR spectra of A: Healthy sample # 0022 - B: CRC sample # 1126.
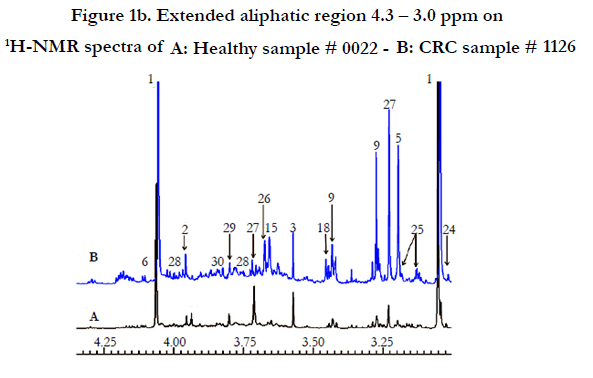
Figure 1b. Extended aliphatic region 4.3 – 3.0 ppm on 1H-NMR spectra of A: Healthy sample # 0022 - B: CRC sample # 1126
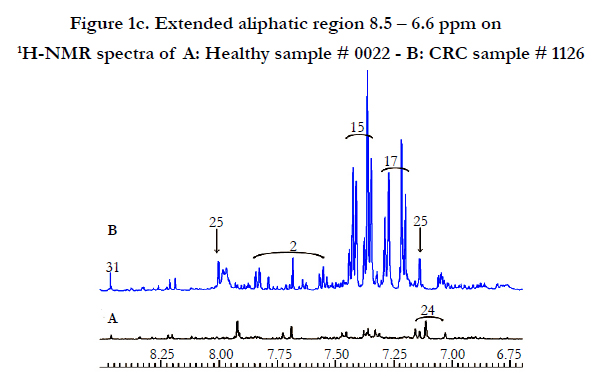
Figure 1c. Extended aliphatic region 8.5 – 6.6 ppm on 1H-NMR spectra of A: Healthy sample # 0022 - B: CRC sample # 1126
The variation of metabolites component from 155 samples is identified by unsupervised model-PCA with 4 PCs as in Figure 2 :
The confidence level is 95% with 56.68% variances explained by PC1 and 8.17% variances explained by PC2. In Figure 2A, the PC1 vs PC2 scores plot showed a trend for separation of 2 groups , one corresponds to cancer patients and the other to healthy persons, mostly along PC1.
Figure. 2B indicates metabolites which contributed significantly to the separation of 2 groups on PC1. The set of marker metabolites corresponding to these variables were identified.
We notice strong increase of the peaks corresponding to the following metabolites: hippurate, glycine, valine, phenylacetate, phenylacetylglutamine, p-cresol, succinate, tyrosine. The observed enhancement is mostly much higher than that mentioned earlier by Qiu Y [22]. The presence of proton donors (-OH, -NH) and acceptors ( >C=O, >N- ) in the enhanced metabolite molecules suggests their possible bonding with ADN nucleotides and involves in the mechanism of carcinogenesis [14].
Some metabolites decreased including creatinine/creatine, histidine, betaine (Table 1). A higher number of samples increases the confidence for their variation.
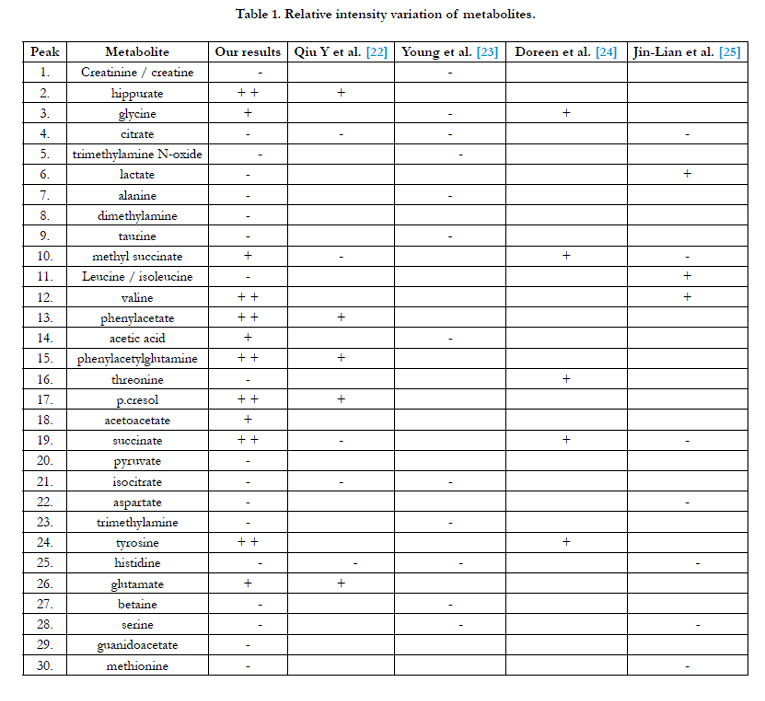

Table 1. Relative intensity variation of metabolites.
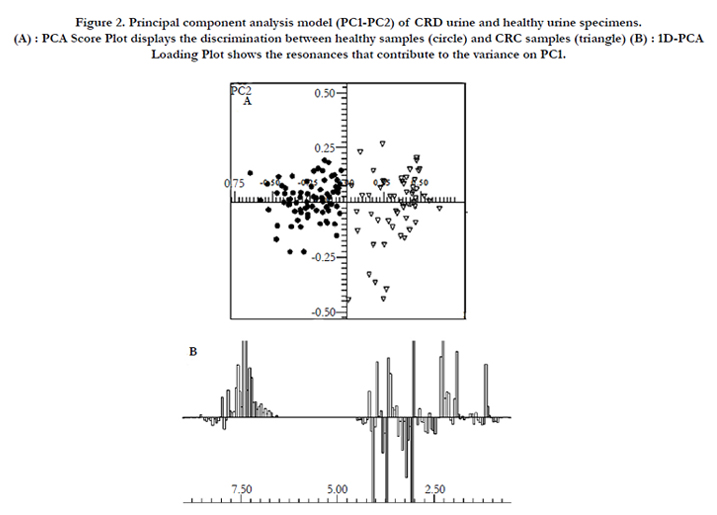
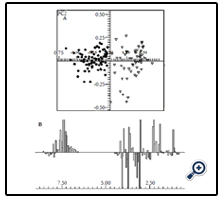
Figure 2. Principal component analysis model (PC1-PC2) of CRD urine and healthy urine specimens. (A) : PCA Score Plot displays the discrimination between healthy samples (circle) and CRC samples (triangle) (B) : 1D-PCA Loading Plot shows the resonances that contribute to the variance on PC1.
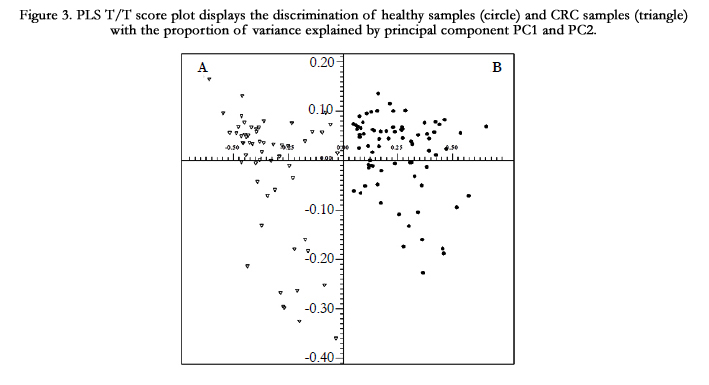
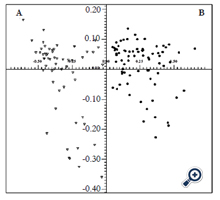
Figure 3. PLS T/T score plot displays the discrimination of healthy samples (circle) and CRC samples (triangle) with the proportion of variance explained by principal component PC1 and PC2.
In addition, we investigated a supervised methods PLS in order to construct a predictive model that is capable of distinguishing between CRC and healthy urines. In the T/T scores of PLS model, a reasonably good separation was observed. The obtained class discrimination was explained X variances up to 71.54% and Y variances up to 87.37%
If the distinction of 2 groups is reconfirmed by supervised model- PLS we have not neglect the possible contribution of other cancers.
Of course, more samples would be examined to reinforce the above conclusion in the aim of a better understanding about the disease evolution. Once the metabolomic ‘fingerprint’ of CRC is firmly established, the next step would be to test the accuracy of this ‘fingerprint’ and these metabolites in a prospective blinded study against the reference standard by GC-MS or by LC/MS/ MS. Success with metabolomics as a diagnostic and prognostic tool is likely to fundamentally change the physicians’ approach to human healthcare.
Conclusion
The information obtained from this study proves that the disease state of CRC induced characteristic changes in the urine metabolites. To fully develop this technology, further study would be necessary with a much larger data set. Such a model could be used in human clinical medicine as a non-invasive diagnostic tool, catching more cases of CRC at an early stage, increasing survival rates. Furthermore, some metabolites with strong enhancement variation would intervene in the interaction with ADN nucleotides in the mechanism of carcinogenesis.
Acknowledgments
This work was supported by funding from the Science Research Program of Science and Technology Department -HCMC and by grants from Bruker-BioSpin-Asia Pacific.
References
- Huong PV, Verma AL (1993) Presence of tri-iodide ions in iodine-intercalated IBi2Sr2CaCu2O8 superconductors. Phys Rev B Condens Matter 48(13): 9869-9872.
- Huong PV, Ajayan PM, Cavagnat R, Stephan O (1995) Temperature-dependent vibrational spectra of carbon nanotubes. Phys Rev B Condens Matter 51(15): 10048-10051.
- Huong PV, Jerome D, Auban-Senzier P, Bernier P (1995) In Sciences and Technology of Fullerene Materials. MRS Proceedings, Boston. Vol.359.
- Huong PV, Khoi PH, Tam NTT, Hoa PLP, Tuong LTC (1999) A Raman spectroscopic study of photoluminescent porous silicon fibres. Int J Inorg Mater 1(3): 209-212.
- Choy JH, Kim YI, Hwang SJ, Huong PV (2000) Trigonal planar (D-3h) AuI3 complex stabilized in a solid lattice. J Phys Chem B 104(31): 7273- 7277.
- Choy JH, Kim YI, Hwang SJ, Muraoka Y, Ohnishi N, et al. (2000) HRTEM and micro-Raman studies on superconducting-superionic conducting nanohybrid, Ag1.17I1.54Bi2Sr2CaCu2Oy. J Phys Chem B 104(39): 9086-9090.
- Kwon SJ, Choy JH, Jung DW, Huong PV (2002) Heterostructured high-Tc superconducting nanohybrid: (Me3S)2HgI4- Bi2Sr2CaCu2Oy. Phys Rev B 66(22): 224510-224522.
- Hwang SJ, Kwon CW, Portier J, Campet G, Park HS, et al. (2002) Local crystal structure around manganese in new potassium-based nanocrystalline manganese oxyiodide. J Phys Chem B 106(16): 4053-4060.
- Huong PV, Giege R (1989) Molecular Dynamics in Biomolecules. In Spectroscopy of Biological Molecules. Bologne (Italie) 163-166.
- Plouvier SR, Huong PV, Lambert P (1985) Bacterial chromophores and Metals in Cancer, Leukemias and Chronic Diseases. A study by Scanning Electron Microscopy, laser Raman and Electron Microspectroscopies. 4th Eur. Cce on Clinical Haemorheology, Siena.
- Huong PV (1986) Organometallic Interactions in Biological Systems. Journal of Molecular Structure 141: 203-209.
- Plouvier SR, Lambert P (1988) Organometallic complexes of Microbial origin, identified in malignant tumors and leukemia by Raman and X-Ray microspectroscopy. XVII International Congress of Pathology, Dublin.
- Huong PV (1989) Raman Spectroscopy for Biological Applications in Analytical Raman Spectroscopy. Wiley, New York. 114: 397-423.
- Huong PV (1989) Metallo-organic complexes and Carcinogenesis in Molecules in Physics, Chemistry and Biology. Springer, Netherlands. 87-109.
- Medford HT (2006) “Colon Cancer Diagnosis Using NMR Spectra of Urine”, A thesis submitted to the faculty of the University of North Carolina at Chapel Hill.
- Yan Ni, Xie G, Jia W (2014) Metabonomics of Human Colorectal Cancer: New Approaches for Early Diagnosis and Biomarker Discovery. J Proteome Res 13(9): 3857-3870.
- Eriksson L, Byrne T, Johansson E, Trygg J, Vikström C (2001) Multi- and Megavariate Data Analysis Principles and Applications. Umetrics Academy. 533.
- Salek RM, Maguire ML, Bentley E, Rubtsov DV, Hough T, et al. (2007) A metabolomic comparison of urinary changes in type 2 diabetes in mouse, rat, and human. Physiol Genomics 29(2): 99-108.
- Carrola J, Rocha CM, Barros AS, Gil AM, Goodfellow BJ, et al. (2011) Metabolic signatures of lung cancer in biofluids: NMR-based metabonomics of urine. J Proteome Res 10(1): 221-230.
- Bouatra S, Aziat F, Mandal R, Guo AC, Wilson MR, et al. (2013) The Human Urine Metabolome. Plos One 8(9): e73076. www.plosone.org.
- Wencheng G (2014) NMR-Based Metabolic Profiling: Methods and Application in Cancer Biomarker Discovery. A dissertation submitted in partial fulfillment of the requirements for the degree of Doctor of Philosophy (Chemistry) in the University of Michigan.
- Qiu Y, Cai G, Su M, Chen T, Liu Y, et al. (2010) Urinary Metabonomic Study on Colorectal Cancer. J Proteome Res 9(3): 1627-1634.
- Chae YK, Kang WY, Kim SH, Joo JE, Han JK, et al. (2010) Metabolic Profiling of Urine Samples from Colorectal Cancer Patients Before and After Surgical Treatments. Journal of the Korean Magnetic Resonance Society 14(1): 28-37.
- Doreen JY, Pasikanti KK, Chan EC (2011) Trend analysis of metabonomics and systematic review of metabonomics-derived cancer marker metabolites. Metabolomics 7(2): 155-178.
- Jin-Lian Chen, Jing Fan, Liu-Shui Yan, Hui-Qin Guo, Jing-Jing Xiong, et al. (2012) Urine Metabolite Profiling of Human Colorectal Cancer by Capillary Electrophoresis Mass Spectrometry Based on MRB. Gastroenterology Research and Practice 2012: 1-8.


