Factors Responsible for Combined Glucose Intolerance Developing into Isolated Post-challenge Hyperglycemia in Subjects with Impaired Fasting Glucose
Chang LH1,3, Wu TE3,4, Chen HS2,3*
1 Tao-Yuan Brach,Taipei Veterans General Hospital, Beitou District, Taipei City Taiwan.
2 Division of Endocrinology and Metabolism, Department of Medicine, Taipei Veterans General Hospital, Beitou District, Taipei City Taiwan.
3 Faculty of Medicine, National Yang-Ming University School of Medicine, Taipei, Taiwan.
4 Department of Ophthalmology, Shin Kong Wu Ho-Su memorial Hospital, Shin-Lin District, Taipei, Taiwan.
*Corresponding Author
Harn-Shen Chen MD, PhD,
Division of Endocrinology and Metabolism, Department of Medicine,
Taipei Veterans General Hospital, No. 201, Sec 2,
Shih-Pai Rd, Taipei 11217, Taiwan.
Tel: +886-2-2875 7516
Fax: +886-2-2872 4982
E-mail: chenhs@vghtpe.gov.tw
Article Type: Research Article
Received: June 02, 2015; Accepted: July 22, 2015; Published: August 06, 2015
Citation: Chang LH, Wu TE, Chen HS (2015) Factors Responsible for Combined Glucose Intolerance Developing into Isolated Post-challengeHyperglycemia in Subjects with Impaired Fasting Glucose. Int J Diabetol Vasc Dis Res, 3(7) 115-121. doi: dx.doi.org/10.19070/2328-353X-1500024
Copyright: Chen HS© 2015. This is an open-access article distributed under the terms of the Creative Commons Attribution License, which permits unrestricted use, distribution and reproduction in any medium, provided the original author and source are credited.
Abstract
Aims/Introduction: We hypothesized that isolated post-challenge hyperglycemia (IPH) is the earliest stage of Type 2 diabetes. We conducted this study to determine factors responsible for combined glucose intolerance (CGI) developing into IPH in subjects with impaired fasting glucose.
Materials and Methods: One hundred subjects with impaired fasting glucose were screened and 77 were enrolled. These subjects were divided into 3 groups: CGI, IPH- (IPH with HbA1c < 6.5%), and IPH+ (IPH with HbA1c ≥ 6.5%). The insulin secretion and insulin sensitivity index during the oral glucose tolerance test were compared among the CGI, IPHand IPH+ groups.
Results: There were 27 subjects in the CGI group, 34 in the IPH- group, and 16 in the IPH+ group. Compared with the CGI group, the subjects with IPH- had a higher glucose AUC and lower insulinogenic index. The subjects with IPH+ had a higher glucose AUC, lower insulinogenic index, lower HOMA- ß, lower insulin AUC, lower total insulin secretion, and lower deposition index. Compared with the IPH- group, subjects with IPH+ were younger, and had lower body mass index, higher cholesterol, higher HbA1c, lower mean HOMA- ß, lower insulin AUC, and lower total insulin secretion.
Conclusions: The factor responsible for CGI developing into IPH with HbA1c < 6.5% was decreased early-phase insulin secretion, but both decreased early and total insulin secretion were responsible for the development of CGI into IPH with HbA1c ≥ 6.5%.
2.Introduction
3.Materials and Methods
3.1 Procedure and Definition
3.2 Measurement
3.3 Statistical analysis
4.Results
4.1 Flow chart of inclusion and baseline clinical characteristics
4.2 The difference between factors responsible to combined glucose intolerance and IPH-
4.3 The difference between factors responsible to combined glucose intolerance and IPH+
4.4 The differences between IPH+ and IPH-
5.Discussion
6.Conclusion
7.Acknowledgement and Declaration
8.References
Key Words
Combined Glucose Intolerance; Impaired Fasting Glucose; Isolated Post-Challenge Hyperglycemia; Type 2 Diabetes Mellitus.
Introduction
Impaired fasting glucose, which is defined as fasting plasma glucose between 100 and 125mg/dL, is a type of pre-diabetes and an intermediate state in the transition of dysregulation of the homeostasis of plasma glucose between normal subjects and individuals with Type 2 diabetes mellitus [1, 2]. Impaired fasting glucose, which was recognized as an early sign of impairment of plasma glucose homeostasis, is brought about the simultaneous interaction of insulin resistance and β-cell dysfunction at the same time. The impaired fasting glucose is not only bearing high-risk odds for developing into further worsening condition of disturbance of maintaining glucose homeostasis - Type 2 diabetes mellitus, but also for is associated with some complications initiated by elevated plasma glucose even has not yet reach the critical point to make the diagnosis of Type 2 diabetes mellitus [3, 4]. Impaired fasting glucose is more endemic according to the epidemiological reports from United States of America. Bullard et al. used a nationally representative sample of the civilian non-institutionalized U.S. population to estimate pre-diabetes prevalence. The reports revealed that among adults aged more than18 years old, the ageadjusted prevalence of impaired fasting glucose between 2007 and 2010 was 27.5% [3-5].
When subjects with impaired fasting glucose performed the oral glucose tolerance test, Three different categories of status of glucose tolerance were demonstrated: normal glucose tolerance, defined as plasma glucose less than140mg/dL in the second hour after seventy five grams glucose intake; combined glucose intolerance, which was defined as 2-h plasmaglucose between 140mg/ dl and 199mg/dL after the same dose of glucose loading; isolated post-challenge hyperglycemia (IPH), defined as the second hour estimated plasma glucose result after glucose loading more than 200mg/dL [6, 7]. IPH is not only a provisional diagnosis of diabetes [8], but is an indicator associated with increasing cardiovascular risk and a worse prognosis among cardiovascular events compared with subjects with normal glucose homeostasis [9, 10]. The metabolic characteristics of IPH and early diabetes are clinically important for early intervention to delay or halt the development of diabetic complications. Moreover, the metabolic characters of IPH might provide more information about the elusive pathogenesis which was responsible for developing from early dysregulation of glucose homeostasis, recognized as pre-diabetes, to the diagnosis of overt Type 2 diabetes mellitus. Current studies showed that a defect in early-phase glucose-stimulated insulin secretion was the crucial metabolic factor that was responsible for the development of normal glucose tolerance into IPH but there was lack of literature discussion about the change of metabolic factors from pre-diabetes to IPH or IPH to overt Type 2 diabetes mellitus [11, 12].
We hypothesized that IPH is the earliest stage of Type 2 diabetes and so it is important to understand the metabolic defects. However, whether metabolic factors contributed to the evolution from combined glucose intolerance to IPH or Type 2 diabetes mellitusis not well established. The aim of this study was to demonstrate the metabolic factors that were responsible for combined glucose intolerance developing into IPH or Type 2 diabetes in patients with impaired fasting glucose.
Materials and Methods
One hundred consecutive subjects were recruited in this study. Six of the 100 patients with impaired fasting glucose and that underwent an oral glucose tolerance test were excluded for having fasting plasma glucose < 100mg/dl, and 5 with fasting plasma glucose > 125mg/dL were also excluded. Our primary goal was to compare impaired fasting glucose subjects with those with impaired glucose tolerance, IPH and Type 2 diabetes mellitus, so we further excluded 11 patients with 2-h glucose < 140mg/dL during the oral glucose tolerance Test, and one subject with combined glucose intolerance but HbA1c more than 6.5% (Figure 1). The patients’ demographic and anthropometric characteristics were collected and body mass index was measured using weight in kilograms divided by the square of height in meters. After fasting for 8 hours, a 75-gram oral glucose tolerance test was conducted and blood was drawn from the antecubital vein at 0, 30, 60, 90, and 120 minutes after oral glucose loading. The plasma glucose and insulin were measured, and the subjects’ total cholesterol, triglyceride, high density lipoprotein-cholesterol, and serum creatinine were also measured in our laboratory.
Normal glucose tolerance, impaired fasting glucose, and impaired glucose tolerance were defined in accordance with American Diabetes Association 2012 diagnostic criteria [13]. Concomitant impaired fasting glucose and impaired glucose tolerance was defined as combined glucose intolerance, and the definition of IPH was fasting plasma glucose 100-125mg/dl, and 2-h glucose of ≥ 200mg/dl after 75-gram oral glucose loading [6]. We further subgrouped IPH by the hemoglobin HbA1c levels: IPH- was defined as IPH with HbA1c < 6.5%, and IPH+ was defined as IPH with HbA1c ≥ 6.5%. The exclusion criteria were fasting plasma glucose < 100mg/dl or ≥ 126mg/dl and normal glucose tolerance after 75-gram glucose loading; therefore, all subjects in our study had impaired fasting glucose at examination.
Plasma glucose was measured using the glucose oxidation method (YSI 2300 glucose and L-lactate analyzer, YSI, Ohio, U.S.A.), and plasma insulin was measured using chemiluminescent microparticle immunoassay. Hemoglobin HbA1c was measured with cation-exchange high performance liquid chromatography (HLC-723G7, TOSOH, Tokyo, Japan). The lipid profile (total cholesterol, triglyceride, and high dense lipoprotein-cholesterol) was measured enzymatically, and the kinetic alkaline picrate method was used to measure serum creatinine. The PI, lipid profile, and serum creatinine results were interpreted by an automatic analyzer (c16000, Abbott, Illinois, U.S.A.).
We used the oral glucose tolerance test to evaluate β-cell function and insulin resistance. Areas under the glucose and insulin curves (glucose AUC and insulin AUC) during the oral glucose tolerance test were calculated by the trapezoid rule. Early-phase insulin secretion (insulinogenic index) was calculated as the ratio between the incremental plasma insulin and glucose concentrations during the first 30 min of the oral glucose tolerance test (plasma insulin 30min-fasting plasma insulin)/(plasma glucose 30min-fasting plasma glucose) [14]. Total insulin secretion was calculated as the ratio between the incremental insulin and glucose AUCs during the oral glucose tolerance test [ΔInsulin AUC/ΔGlucoseAUC][15]. The Matsuda index was calculated for insulin resistance as previously reported [16]. The deposition index was calculated by product of insulinogenic index and Matsuda index [17]. Homeostasis model assessment was used to estimate insulin resistance (HOMA-IR) and Β-cell function (HOMA-B) [18].
The 18th edition of the SPSS software package was used for analysis of the results. The Kolmogorov-Smirnov test was used to determine if the parameters fit a normal distribution or not, and a p value <0.2 was considered as not fitting a normal distribution. After being expressed as mean ± standard deviation (SD), the continuous data that fit a normal distribution were compared with independent ANOVA tests, and the Mann-Whitney test was used for parameters that did not fit a normal distribution. The Pearson Chi-square test was used for comparisons of categorical data that were presented as numbers and percentage. For all comparisons, p < 0.05 was considered to represent a significant difference between groups.
Results
77 subjects were included for analysis and the number of combined glucose intolerance, IPH- and IPH+ was 27, 34, and 16 (Figure 1) (Table 1). The plasma glucose and insulin excursions during oral glucose tolerance test (Figure 2) and insulin resistance and β-cell function results (Table 2) were calculated.
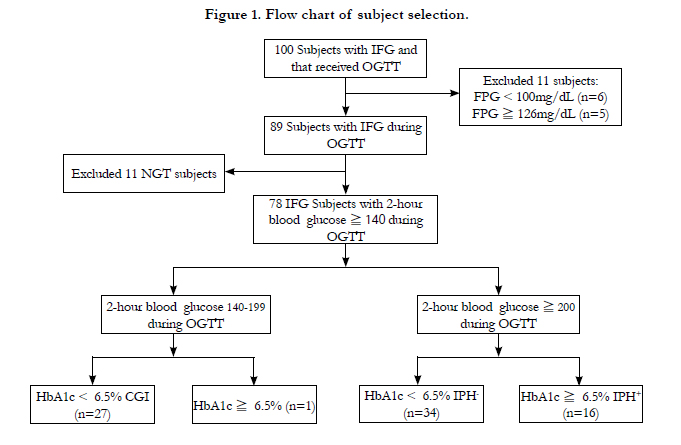
Figure 1. Flow chart of subject selection.
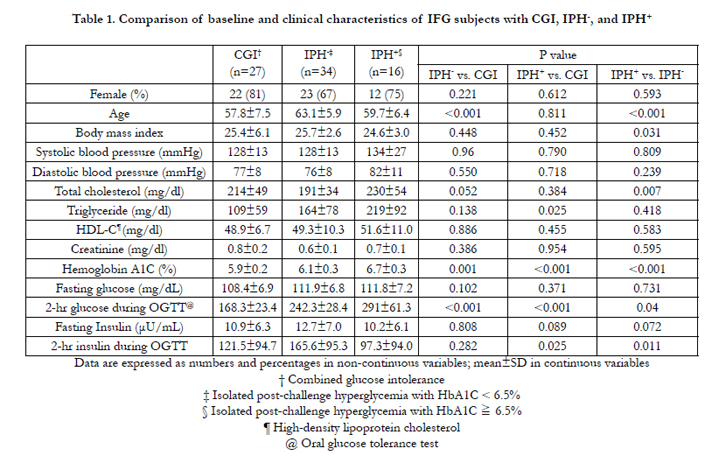

Table 1. Comparison of baseline and clinical characteristics of IFG subjects with CGI, IPH-, and IPH+ .
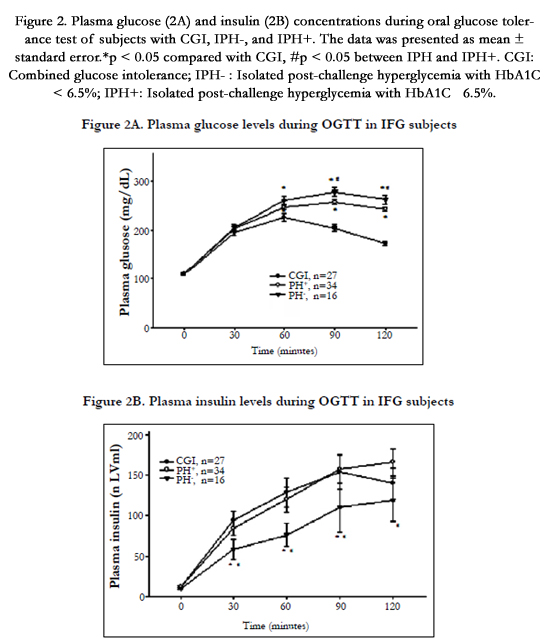
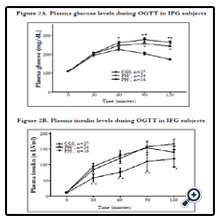
Figure 2. Plasma glucose (2A) and insulin (2B) concentrations during oral glucose tolerance test of subjects with CGI, IPH-, and IPH+. The data was presented as mean ± standard error.*p < 0.05 compared with CGI, #p < 0.05 between IPHand IPH+. CGI: Combined glucose intolerance; IPH- : Isolated post-challenge hyperglycemia with HbA1C < 6.5%; IPH+: Isolated post-challenge hyperglycemia with HbA1C ≧ 6.5%.
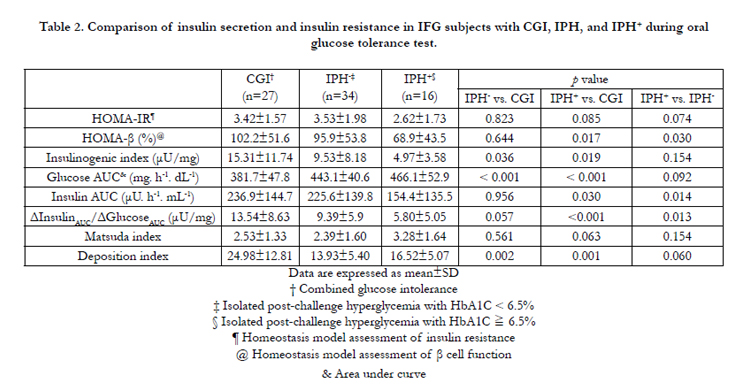
Table 2. Comparison of insulin secretion and insulin resistance in IFG subjects with CGI, IPH, and IPH+ during oral glucose tolerance test.
The IPH- group was older, and had higher serum triglyceride and HbA1c levels than the subjects with combined glucose intolerance. During the oral glucose tolerance test, the plasma glucose was higher in the IPH- group at 60, 90, and 120 minutes after glucose loading, but there was no significant difference in plasma insulin concentrations (Figure 2A and 2B). The IPH- group had higher glucose AUC (443.1 vs. 381.7mg/h/dl, P < 0.001) but lower insulinogenic index (9.53 vs.15.31 μU/mg, P=0.036) and deposition index (13.93 vs. 24.98, P=0.002) than the combined glucose intolerance group. The other parameters of insulin sensitivity and β-cell function were not significantly different between the 2 groups (Table 2).
In comparing the demographic and anthropometric data between the diabetes and combined glucose intolerance groups, only HbA1c showed a significant difference (6.7 vs. 5.9%, P < 0.001) (Table 1). The plasma glucose of the IPH+ group was significantly higher at 60, 90, and 120 minutes and the PI in this group was significantly lower at 30, 60, 90 and 120 minutes during the oral glucose tolerance test (Figure 2A and 2B). The glucose AUC was significantly higher in the IPH+ group (466.1 vs. 381.7mg/h/dL, p < 0.001) (Table 2). HOMA- ß (68.9 vs. 102.2%, P=0.017), insulin AUC (154.4 vs. 236.9 μU. h-1. mL-1, P=0.030), insulinogenic index (4.97 vs. 15.31μU/mg, P=0.019), total insulin secretion (5.80 vs. 13.54μU/mg, P < 0.001), and deposition index (16.52 vs. 24.98, P=0.001) were significantly lower in the IPH+ group. However, the Matsuda index and HOMA-IR were not significantly different between the 2 groups.
Compared with the IPH- group, the IPH+ subjects were younger (59.7 vs. 63.1 years, p < 0.001), and had lower body mass index (24.6 vs. 25.7, P=0.031), higher cholesterol (234 vs. 190mg/dL, P=0.012), and higher HbA1c (6.7 vs. 6.1%, P < 0.001) (Table 1). Subjects with IPH+ had higher plasma glucose concentrations at 90 and 120 minutes and lower PI concentrations at all time profiles after glucose loading (P < 0.05) (Figure 2A and 2B). The IPH+ group had lower mean HOMA- ß (68.9 vs. 95.9%, P=0.030), insulin AUC (154.4 vs. 225.6 μU. h-1. mL-1-1
Discussion
This study showed that a significant of decline in the early phase of insulin secretion without significant difference of total insulin secretion may be responsible for the development from combined glucose intolerance to IPH- (HbA1c < 6.5%), Since the dysfunction of early phase insulin secretion had reached the plateau in status of IPH, the significantly decreased total insulin secretion may be further responsible for the development from IPH to overt Type 2 diabetes (HbA1c ≥ 6.5%). IPH with HbA1c < 6.5% may be the earliest stage of Type 2 diabetes, and is worthy of early detection and treatment in order to halt or delay the development of diabetic complications. Therefore, we addressed a hypothetical model of progression from combined glucose intolerance to IPH (Figure 3): Even lack of the early response to glucose loading from pancreatic β cell, Insulin secretion may reach maximal capacity in subjects with IPH, and Type 2 diabetes mellitus is overtly presented when the capacity of insulin secretion is further decreased.
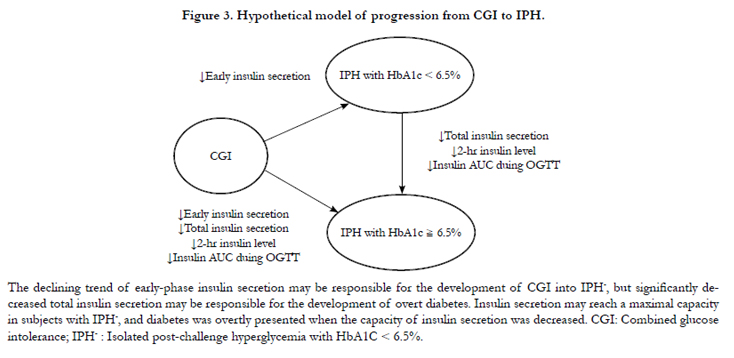
Figure 3. Hypothetical model of progression from CGI to IPH.
The progressive decline of β-cell function and insulin sensitivity, which occurs before an abnormal plasma glucose concentration, was the most important mechanisms which were involved in dysregulation of glucose homeostasis. Moreover, the progressive hyperglycemia is a signal which revealed the status of decompensation of β-cell function [3]. The first ladder of sign revealed β-cell dysfunction in the status of glucose dysregulation is decreased first-phase insulin secretion caused by a decrease in the readily releasable pool of insulin secreting granule after loading of glucose. After disappearing of first phase reaction of insulin secretion from β-cell after glucose lading, a progressive decline of secondphase insulin secretion, which was caused by a decrease in the reserve pool, might be detected [19]. Subjects with impaired fasting glucose are in an insulin-resistant state and manifest a decrease in first-phase insulin secretory response to intravenous glucose and early-phase insulin response to oral glucose [20-23]. Furthermore, Subjects with combined glucose intolerance manifest insulin resistance in severe forms, and have severe defects in both early-and late-phase insulin responses to intravenous and oral glucose [20-23]. It seems to be concluded both early phase and total insulin secretion decline was responsible for the process from impaired fasting glucose to combined glucose intolerance. However, the trend of decline of early phase insulin secretion was not reached the valley in the status of combined glucose intolerance. In contrast, further decline of early phase reaction of insulin secretion but not impairment of total insulin secretion might be responsible for process from combined glucose tolerance to IPH according to results of this study. The literature had suggested that progression from impaired glucose tolerance to IPH is due mostly to deterioration of insulin secretion and a lesser contribution by insulin resistance and the conclusion was consistent with the results of this study [24]. Simultaneous with the decrease of calculated betacell function, the total insulin secretion or insulin AUC during oral glucose tolerance test may achieve a maximal capacity in subjects with impaired glucose tolerance or combined glucose intolerance [14]. Our present study demonstrated that total insulin secretion is highest in subjects with combined glucose intolerance, and the 2-hr insulin level during oral glucose tolerance test is the highest in IPH subjects with HbA1c < 6.5%. We suggested that insulin secretion and compensation of β-cell function may reach a maximal capacity in the status of combined glucose intolerance or subjects with IPH but whose HbA1c were less than 6.5%. When further decline of total insulin secretion, the Type 2 diabetes mellitus was overtly presented with the sign of significantly elevated reports of plasma glucose.
In the present study, we used serum HbA1c levels to separate subjects with IPH into IPH- (HbA1c < 6.5%) and IPH+ (HbA1c ≥ 6.5%) groups. The difference between IPH- and IPH+ in our study definition was the HbA1c level, which meant that subjects with IPH- may have had only post-challenge hyperglycemia, and not sustained hyperglycemia. IPH can be diagnosed as Type 2 diabetes mellitus by repeated oral glucose tolerance test with 2 -hour plasma glucose more than 200mg/dl, even though fasting plasma glucose is less than 126mg/dl and HbA1c not more than 6.5% [13]. The progression of loss of first phase reaction of β-cell is a major metabolic factor responsible for status of IPH and decrease of total insulin secretion was the one responsible for and overt Type 2 diabetes mellitus, which was also defined as IPH+ in this study. Even though this was a cross sectional study without considering the time profile, the differences of metabolic factors between combines glucose tolerance, IPH-, and IPH+ was compactible with the serial pathological functional loss of β-cell and sustained hyperglycemia in group of IPH+. Hence, we speculated that IPH with HbA1c less than 6.5% is the earliest stage of Type 2 diabetes without sustained hyperglycemia. And impairment of early-phase insulin secretion but not total insulin secretion was suggested to be responsible for progressing from normal glucose tolerance to IPH. Compared to the subjects with IPH+ (IPH and HbA1c ≥ 6.5%) in the present study, the subjects with IPH- in this study were significantly older, and had higher body mass index, but better β-cell function as presented by HOMA-β, the insulinogenic index, total insulin secretion, and insulin AUC. We found that a declining trend in early-phase insulin secretion may be responsible for combined glucose intolerance developing into IPH- (HbA1c < 6.5%), but a significant decrease in total insulin secretion may be responsible for the development of IPH+ (HbA1c ≥ 6.5%). We suggest that the major metabolic defect in subjects with IPH- is the decreased insulin response to the glucose load, which may be due to aging and increased body weight. However, subjects with IPH+ may have a further loss due to some metabolic defects or lifestyle patterns that lead to sustained hyperglycemia and hypercholesterolemia. To the best of our knowledge, this is the first study to compare metabolic characteristics and insulin secretion between subjects with IPH and early diabetes.
Triglyceride was significantly higher in the IPH- group than in the combined glucose intolerance group, and a similar trend was found between the IPH- and IPH+ groups in this study. IPH caused macrovascular damage through a unique mechanism in which glucose excursion and triglyceride played important roles, and resulted in increasing oxidative stress in endothelial cells and endothelial dysfunction [25]. Furthermore, pre-diabetes increased cardiovascular risk via metabolic syndrome and diabetes through formation of advanced glycation end products and reactive oxygen species, activation of protein kinase C, induction of the polyol pathway, and over-expression of growth factors and inflammatory cytokines [26-28]. Therefore, further treatment targets in subjects with IPH, and therapeutic goals should be investigated for the prevention of macrovascular complications.
There were some limitations to our study: First, the relatively small sample size might decrease the power of the study. Second, the reproducibility of oral glucose tolerance test for a pre-diabetes diagnosis was about 50%, so repeated oral glucose tolerance test might be needed to confirm the conclusions of this study. And, this was a cross-sectional study, so longitudinal follow-up is needed for confirmation of the results. In conclusion, The factor responsible for combined glucose intolerance developing into IPH with HbA1c < 6.5% is decreased early-phase insulin secretion, but both early-phase decrease and total insulin secretion are responsible for the development of combined glucose intolerance into IPH with HbA1c ≥ 6.5%. IPH with HbA1c < 6.5% may be the earliest stage of Type 2 diabetes, and is worthy of early detection and treatment in order to halt or delay the development of diabetic complications.
Conclusion
The factor responsible for combined glucose intolerance developing into IPH with HbA1c < 6.5% was decreased early-phase insulin secretion, but both decreased early and total insulin secretion were responsible for the development of combined glucose intolerance into IPH with HbA1c ≥ 6.5%.
Acknowledgement and Declaration
The research was funded by Taipei Veterans General Hospital (V100C-204) and the National Science Council (NSC 99-2314-B- 010-050-). There is no conflict of interest for any results of this study.
References
- Genuth S (2003) Lowering the criterion for impaired fasting glucose is in order. Diabetes Care 26(12): 3331-3332.
- Harris MI, Eastman RC, Cowie CC, Flegal KM, Eberhardt MS (1997) Comparison of diabetes diagnostic categories in the U.S. population according to the 1997 American Diabetes Association and 1980-1985 World Health Organization diagnostic criteria. Diabetes Care 20(12): 1859-1862.
- Tabak AG, Jokela M, Akbaraly TN, Brunner EJ, Kivimäki M, et al. (2009) Trajectories of glycaemia, insulin sensitivity, and insulin secretion before diagnosis of type 2 diabetes: an analysis from the Whitehall II study. Lancet 373(9682): 2215-2221.
- Defronzo RA (2009) Banting Lecture. From the triumvirate to the ominous octet: a new paradigm for the treatment of type 2 diabetes mellitus. Diabetes 58(4): 773-795.
- Bullard KM, Saydah SH, Imperatore G, Cowie CC, Gregg EW, et al. (2013) Secular Changes in U.S. Prediabetes Prevalence Defined by Hemoglobin bA1c and Fasting Plasma Glucose: National Health and Nutrition Examination Surveys, 1999-2010. Diabetes Care 36(8): 2286-2293.
- Abdul-Ghani MA, Lyssenko V, Tuomi T, DeFronzo RA, Groop L (2009) Fasting versus postload plasma glucose concentration and the risk for future type 2 diabetes: results from the Botnia Study. Diabetes Care 32(2): 281- 286.
- Resnick HE, Harris MI, Brock DB, Harris TB (2000) American Diabetes Association diabetes diagnostic criteria, advancing age, and cardiovascular disease risk profiles: results from the Third National Health and Nutrition Examination Survey. Diabetes Care 23(2): 176-180.
- American Diabetes Association. (2013) Standards of medical care in diabetes-- 2013. Diabetes Care 36(Suppl 1): S11-S66.
- Shaw JE, Hodge AM, de Courten M, Chitson P, Zimmet PZ (1999) Isolated post-challenge hyperglycaemia confirmed as a risk factor for mortality. Diabetologia 42(9): 1050-1054.
- Barrett-Connor E, Ferrara A (1998) Isolated postchallenge hyperglycemia and the risk of fatal cardiovascular disease in older women and men. The Rancho Bernardo Study. Diabetes Care 21(8): 1236-1239.
- Temelkova-Kurktschiev TS, Koehler C, Henkel E, Leonhardt W, Fuecker K, et al. (2000) Postchallenge plasma glucose and glycemic spikes are more strongly associated with atherosclerosis than fasting glucose or HbA1c level. Diabetes Care 23(12): 1830-1834.
- Harada N, Fukushima M, Toyoda K, Mitsui R, Izuka T, et al. (2008) Factors responsible for elevation of 1-h postchallenge plasma glucose levels in Japanese men. Diabetes Res Clin Pract 81(3): 284-289.
- American Diabetes Association. (2012) Standards of medical care in diabetes-- 2012. Diabetes Care 35(Suppl 1): S11-S63.
- Pratley RE, Weyer C (2001) The role of impaired early insulin secretion in the pathogenesis of Type II diabetes mellitus. Diabetologia 44(8): 929-945.
- Chen HS, Wu TE, Jap TS, Hsiao LC, Lee SH, et al. (2008) Beneficial effects of insulin on glycemic control and beta-cell function in newly diagnosed type 2 diabetes with severe hyperglycemia after short-term intensive insulin therapy. Diabetes Care 31(10): 1927-1932.
- Matsuda M, DeFronzo RA (1999) Insulin sensitivity indices obtained from oral glucose tolerance testing: comparison with the euglycemic insulin clamp. Diabetes Care 22(9): 1462-1470.
- DeFronzo RA, Banerji MA, Bray GA, Buchanan TA, Clement S, et al. (2010) Determinants of glucose tolerance in impaired glucose tolerance at baseline in the Actos Now for Prevention of Diabetes (ACT NOW) study. Diabetologia 53(3): 435-445.
- Matthews DR, Hosker JP, Rudenski AS, Naylor BA, Treacher DF, et al. (1985) Homeostasis model assessment: insulin resistance and beta-cell function from fasting plasma glucose and insulin concentrations in man. Diabetologia 28(7): 412-419.
- Seino S, Shibasaki T, Minami K (2011) Dynamics of insulin secretion and the clinical implications for obesity and diabetes. J Clin Invest 121(6): 2118- 2125.
- Hanefeld M, Koehler C, Fuecker K, Henkel E, Schaper F, et al. (2003) Insulin secretion and insulin sensitivity pattern is different in isolated impaired glucose tolerance and impaired fasting glucose: the risk factor in Impaired Glucose Tolerance for Atherosclerosis and Diabetes study. Diabetes Care 26(3): 868-874.
- Ferrannini E, Gastaldelli A, Miyazaki Y, Matsuda M, Mari A, et al. (2005) beta-Cell function in subjects spanning the range from normal glucose tolerance to overt diabetes: a new analysis. J Clin Endocrinol Metab 90(1): 493-500.
- Abdul-Ghani MA, Jenkinson CP, Richardson DK, Tripathy D, DeFronzo RA (2006) Insulin secretion and action in subjects with impaired fasting glucose and impaired glucose tolerance: results from the Veterans Administration Genetic Epidemiology Study. Diabetes 55(5): 1430-1435.
- Kanat M, Mari A, Norton L, Winnier D, DeFronzo RA, et al. (2012) Distinct beta-cell defects in impaired fasting glucose and impaired glucose tolerance. Diabetes 61(2): 447-453.
- Suzuki H, Fukushima M, Usami M, Ikeda M, Taniguchi A, et al. (2003) Factors responsible for development from normal glucose tolerance to isolated postchallenge hyperglycemia. Diabetes Care 26(4): 1211-1215.
- Ceriello A (2003) The possible role of postprandial hyperglycaemia in the pathogenesis of diabetic complications. Diabetologia 46(Suppl 1): M9-16.
- Ford ES, Zhao G, Li C (2010) Pre-diabetes and the risk for cardiovascular disease: a systematic review of the evidence. J Am Coll Cardiol 55(13): 1310-1317.
- He Z, King GL (2004) Microvascular complications of diabetes. Endocrinol Metab Clin North Am 33(1): 215-238.
- Grundy SM (2012) Pre-diabetes, metabolic syndrome, and cardiovascular risk. J Am Coll Cardiol 59(7): 635-643.


