The Influence of Quality of Dental Health Services on Trust in West Sulawesi Province, Indonesia
Fuad Husain Akbar1*, Annisa2, Yoris Adi Maretta3
1 Department Dental Public Health, Faculty of Dentistry, Hasanuddin University, Makassar, Indonesia.
2 Dental Hospital, Faculty of Dentistry, Hasanuddin University, Makassar, Indonesia.
3 Universitas Negeri Semarang, Indonesia.
*Corresponding Author
Fuad Husain Akbar,
Department Dental Public Health, Faculty of Dentistry, Hasanuddin University, Makassar, Indonesia.
E-mail: fuadgi2@gmail.com
Received: May 04, 2020; Accepted: July 04, 2020; Published: July 14, 2020
Citation:Fuad Husain Akbar, Annisa, Yoris Adi Maretta. The Influence of Quality of Dental Health Services on Trust in West Sulawesi Province, Indonesia. Int J Dentistry Oral Sci. 2020;7(7):770-775. doi: dx.doi.org/10.19070/2377-8075-20000151
Copyright: Fuad Husain Akbar©2020. This is an open-access article distributed under the terms of the Creative Commons Attribution License, which permits unrestricted use, distribution and reproduction in any medium, provided the original author and source are credited.
Abstract
Purpose: To evaluate patient confidence in the quality of community dental and oral health services from various dimension.
Materials and Methods: This research was conducted in Polewali Mandar Regency in 2019 and used a pilot path finder
design. The subjects consisted of 458 participants. Data was collected using a questionnaire which had been design in accordance
with this survey. The questionnaire included 67 questions with responses in the form of bad, poor, moderate, good,
very good. Questions about confidence in dental and oral health services were grouped into four dimensions, namely the
dimensions of ability, kindness, integrity, and confidence. Confidence was analyzed using the F-test and multiple regression.
Results: Service quality dimension which included dimension of registration, doctors, and pharmacy had an influence on
community confidence wih a P value < 0,05.
Conclusion: The quality of dental and oral health services in Wonomulyo sub-district and Bulo sub-district, Polewali Mandar
Regency, had a signicant influence on community confidence.
2.Introduction
3.Materials and Methods
4.Results
5.Discussion
6.Conclusion
7.Ethics Approval
8.References
Keywords
Community Confidence; Quality of Health Services; Dental Health Service.
Introduction
Law Number 36 Year 2009 concerning public health states that
health service facilities are a tool and place that used to carry out
health service efforts which include promotive, preventive, curative,
and rehabilitative activities that conducted by the central government,
regional governments, and the community [1, 2].
The Minister of Health Regulation No. 4 of 2018 Chapter II Article
2, paragraph 1a states that every hospital has an obligation
to provide true information about hospital services to the public,
and paragraph 1 b, states that every hospital has an obligation
to provide safe and excellent health services , anti-discrimination,
and effective, by prioritizing patients, in accordance with hospital
service standards. In Indonesia, several international-standardhospitals
with various sophisticated facilities have been established.
However, the services provided by hospitals in Indonesia
are still lacking compared to services provided by hospitals
abroad. Hospitals in America have adopted a market driven structure,
which is centered on patients to provide health care [3-5].
All hospitals need to measure, monitor and improve the quality
of health services in order to survive and reach the millennium
development goals. Under such circumstances, hospital managers
place a major emphasis on as many patients as possible and make
loyal customers, by recognizing their expectations and trying to
respond to them effectively [6, 7].
Health care providers can gain patient confidence by focusing on
patient satisfaction to increase patient confidence in health services.
Patients must trust their healthcare professionals to work
for their best interests and results. Improving the competence
of health workers, strengthening the law, discipline and effective
management of patient complaints, are often proposed as a strategy
to increase patient confidence [8-10].
A study in Sweden found that low levels of trust in hospitals
were associated with an increased risk of psychological distress. Patients with a low level of trust were less likely to seek or access
health services, and were less likely to accept health service
recommendations or maintain continuity of care, and were more
likely to avoid health care, including hospitals [11].
Based on data from the Health Office of Polewali Mandar Regency
in 2016, there was one hospital located in the city center,
20 community health center and 58 pharmacies to serve 417, 472
inhabitants of Polewali Mandar Regency. The number of dentists
on duty at the community health center in 2016 was 16 dentists.
The ratio of dentists and population was 4: 100,000, whereas
based on the indicator target of ‘Healthy Indonesia’ program,
the ideal category for the ratio of dentists and population is 11:
100,000, this indicates the lack of doctors who work in remote areas
which then has an impact on the quality of services provided
[12, 13].
Patient confidence will have an impact on the level of patient
visits to the hospital. Polewali Mandar Regency has only one
public hospital located in the city center and a research had been
conducted and revealed that Polewali Mandar Hospital had good
quality of service. However, there is no research that examines
the influence of service quality on community confidence in Polewali
Mandar Regency.
Materials And Methods
Code of ethics: 0246/PL09/KEPK FKG-RSGM UNHAS/
2019. This study used a pilot pathfinder design and was conducted
in Wonomulyo Subdistrict, and Bulo Subdistrict, Polewali
Mandar Regency, July 22 - July 26, 2019. Researchers took as many as 458 subjects based on criteria, namely urban communities
in Wonomulyo Subdistrict and rural communities in Bulo
Subdistrict, Polewali Mandar Regency, aged 18 years and over and
had undergone dental care both at the community health center
and at the hospital located at Polewali Mandar.
The inclusion criteria in this study included the community in
Wonomulyo and Bulo Subdistricts, Polewali Mandar Regency,
aged ≥ 18 years, those who had received services in dental polyclinics
in community health service or hospitals in Polewali Mandar
Regency and were willing to fill out questionnaires. Exclusion
criteria in this study were subjects who did not complete the
questionnaire and subjects who did not return the questionnaire.
Assessment was done using a Likert scale with item valuation,
namely code 5 = very satisfied, code 4 = satisfied, code 3 = quite
satisfied, code 2 = not satisfied, code 1 = very dissatisfied. Then
the dimensions of service and confidence were classified into categories
namely low: 1-2.33, moderate: 2.34-3.66, high: 3.67-5.00
[14, 15].
Results
The research design used was a pilot pathfinder survey, conducted
in urban and rural areas of Polewali Mandar Regency, so that only
458 subjects were obtained that met the inclusion and exclusion
criteria.
Table 1 showed the distribution of characteristics of survey subjects
by sex, age, ethnicity, and religion. Based on gender, in urban
areas the number of female subjects was higher than men, which was 125 subjects (53.3%), and in rural areas the number of male
subjects was higher than women, which was 125 subjects (56.1%).
Based on age characteristics, the most subjects in urban areas
were 18-24 years old, as many as 128 subjects (54.2%) and in rural
areas the most subjects were 18-24 years old, as many as 85 subjects
(38.1%). Based on ethnic characteristics, the most subjects in
urban areas were Bugis tribes as many as 79 subjects (33.5%) and
in rural areas the most subjects were Mandar tribes as many as 155
subjects (69.5%). Based on the characteristics of religion, in urban
areas the most subjects were 222 Muslims (94.1%) and in rural
areas the most subjects were 209 Muslims (93.7%).
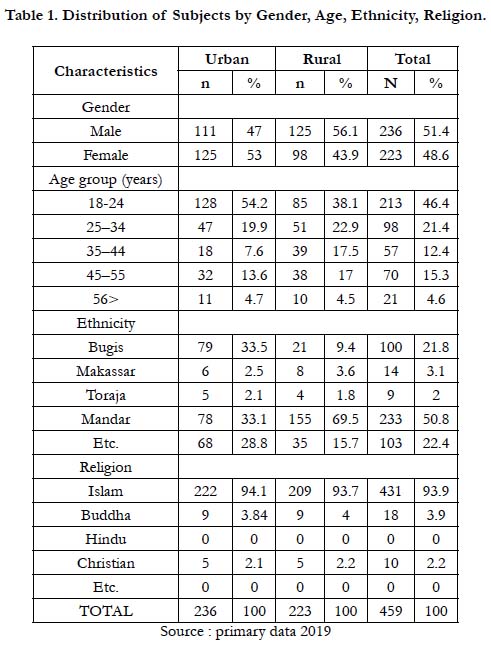

Table 1. Distribution of Subjects by Gender, Age, Ethnicity, Religion.
Table 2 showed the distribution of subject characteristics based on marital status, latest education and employment. Based on the characteristics of marital status in urban areas, the highest number of subjects was unmarried status as many as 118 subjects (50.0%) and in rural areas the most subjects were unmarried status as much as 102 subjects (45.7%). Based on the characteristics of the latest education in urban areas, the most subjects were ‘high school education’ as many as 108 subjects (45.8%) and in the rural areas the most subjects were ‘high school education’ as many as 105 subjects (47.1%). Based on the characteristics of employment in urban areas, the most subjects were ‘not working or as housewives’ as many as 109 subjects (46.2%), and in rural areas the most subjects were ‘not working or as housewives’ as many as 90 subjects (40.4%).
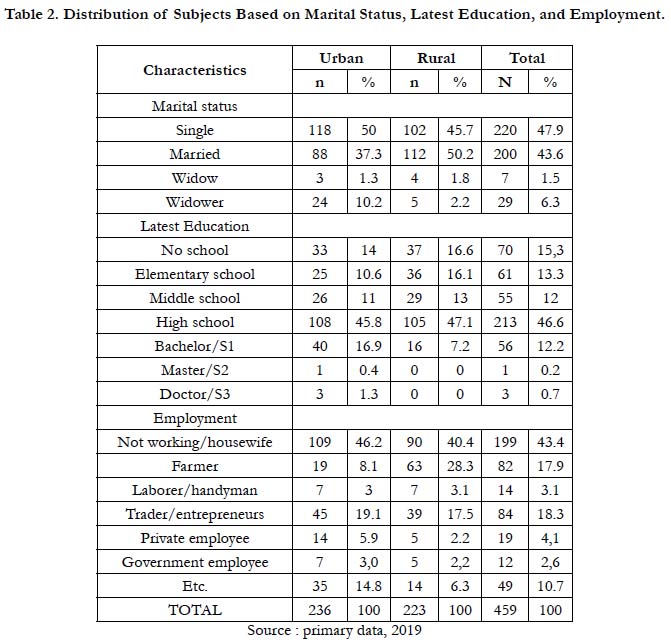
Table 2. Distribution of Subjects Based on Marital Status, Latest Education, and Employment.
Table 3 showed the distribution of characteristics of survey subjects based on income per month, distance from home to hospital/ community health service/dentist practice, and health insurance status. Based on the characteristics of income per month in urban areas, the highest number of subjects was income per month Rp. 0 - Rp. 150,000 as many as 116 subjects (49.4%) and in rural areas the most subjects were income per month Rp. 0 - Rp. 150,000 as many as 114 subjects (51.1%)). Based on the characteristics of the distance from home to hospital /community health service/dentist practice, in urban areas the most subjects were 0-5 km from home to hospital /community health service/dentist practice as many as 119 subjects (50.4%) and in rural areas the most subjects were 0-5 km from home to hospital/community health service/dentist practice as many as 111 subjetcs (49.8%). Based on the characteristics of health insurance status, in urban areas subjects who did not have health insurance were 140 subjects (59.3%) and in rural areas subjects who did not have health insurance were 139 subjects (62.3%).
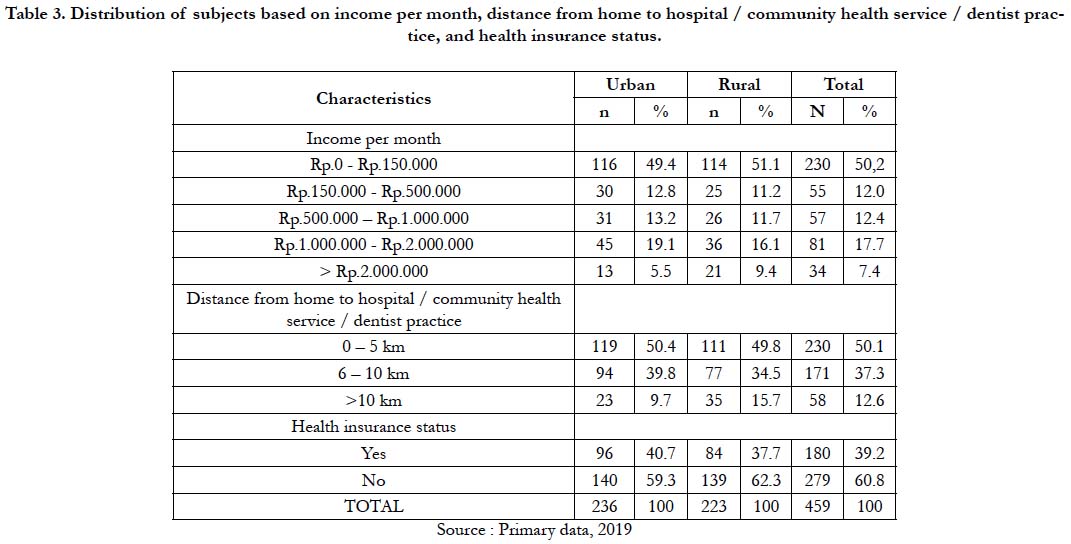
Table 3. Distribution of subjects based on income per month, distance from home to hospital / community health service / dentist practice, and health insurance status.
Based on table 4 regarding the distribution of respondent’s answers in the registration dimension in the Urban area, the majority of respondents' answers were in the low category, total mean value of 12 questions in this dimension was 2.29 and this dimension was classified as simple. In the doctor dimension in the Urban area, the majority of respondent’s answers were in the low category, total mean value of 12 questions in this dimension was 2.17 and this dimension was classified as simple. In the nurse dimension in the urban area, the majority of respondent's answers were in the low category, total mean value of 12 questions in this dimension was 2.28 and this dimension was classified as simple. In the pharmaceutical dimension in the Urban area, the majority of respondent’s answers were in the low category, total mean value of 11 questions in this dimension was 2.32 and this dimension was classified as simple. In the hospital/community health service environment dimension in urban areas, the majority of respondent’s answers were in the moderate category, total mean value of the 9 questions in this dimension was 2.41 and this dimension was classified as simple. In dimension of community confidence in urban areas, the majority of respondent’s answers were in the high category, total mean value of 10 questions in this dimension was 3.80 and this dimension is classified as good.
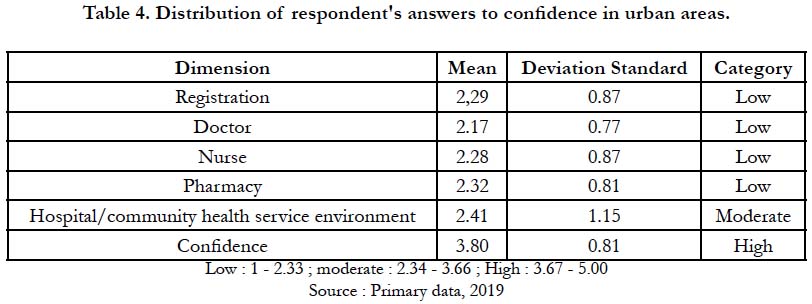
Table 4. Distribution of respondent's answers to confidence in urban areas.
Based on table 5 regarding the distribution of respondent’sanswers in the registration dimension in the Rural area, the majority of respondent’s answers were in the low category while those in the moderate category were the distance of the location of the registration. Total mean value of 12 questions in this dimension was 2.05 and this dimension was classified as simple. In the dimension of doctors in the Rural area, the majority of responden’s answers were in the low category. Total mean value of 12 questions in this dimension was 2.14 and this dimension was classified as simple. in the dimension of nurses in rural areas the majority of respondent’s answers were in the low category. Total mean value of 12 questions in this dimension was 2.25 and this dimension was classified as simple. In the pharmaceutical dimension in the Rural area, the majority of respondent’s answers were in the moderate category. Total mean value of 11 questions in this dimension was 2.34 and this dimension was classified as simple. In the dimensions of the hospital/community health service environment in the Rural area, the majority of respondent’s answers were in the moderate category, total mean value of 9 questions in this dimension was 2.41 and this dimension was classified as simple. In community confidence in rural areas, the majority of respondent’s answers were in the high category. Total mean value of 10 questions in this dimension was 3.67 and this dimension was classified as good.
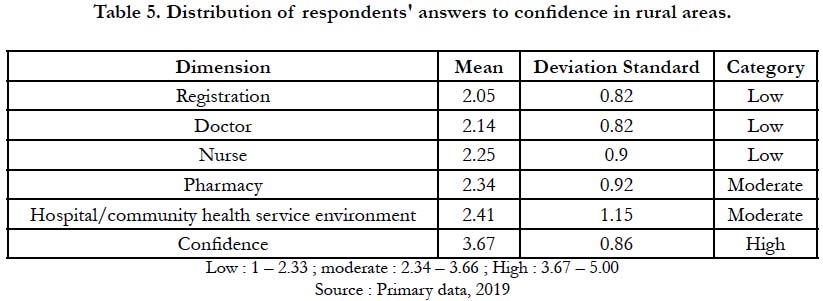
Table 5. Distribution of respondents' answers to confidence in rural areas.
Based on the results of the regression analysis table, it could be explained that the dimensions of service quality, including the dimensions of registration, doctors, and pharmacy had a significant influence on community confidence with a P value <0.05.
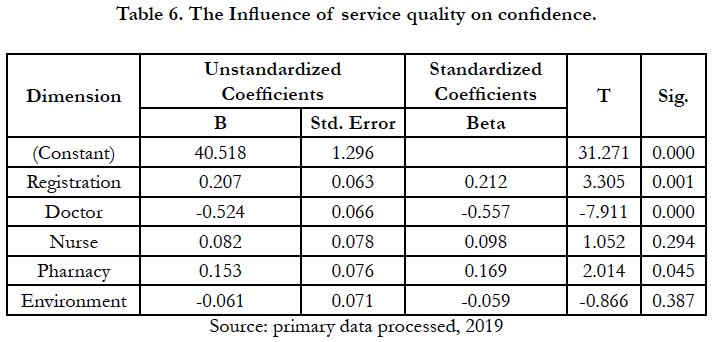
Table 6. The Influence of service quality on confidence.
Table 7 showed the coefficient of determination, where the value of R Square obtained was 13.3%, , which was the magnitude of the influence of service quality on confidence, and the remaining 86.7% was the magnitude of influence caused by other factors that was not examined in this study.
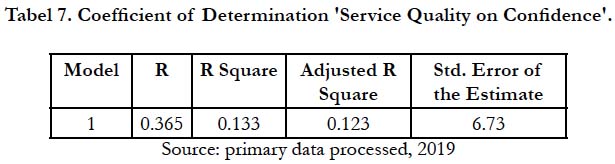
Tabel 7. Coefficient of Determination 'Service Quality on Confidence'.
Discussion
The results of a survey conducted in Polewali Mandar Regency,
showed that patients who received more dental care in health facilities
were patients in the 18-24 years age group. Based on gender,
male patients made more hospital visits than women, this is
not in line with previous studies conducted in Bantaeng Regency
which stated that more female patients visited health facilities
than male patients [15].
In the registration dimension in urban and rural areas, the item
that had the lowest mean value was the facilities in the registration
section. This result is not in line with a research conducted in Banjarmasin,
Indonesia, where the facilities in the registration section
were in the high category, because the registration system implemented
was online-based system, where the online administration
process was more efficient than the usual registration system, so it
did not require a long time in registration section [17].
In the doctor dimension in the urban area, the item that had the
lowest mean values were the neatness, cleanliness and uniformity
of the doctor's clothes. These results are not in line with a research
conducted in Bantaeng Regency, where uniformity of doctors
was in the high category, because differences in appearance
would make it easier for patients to distinguish between doctors
and nurses or other staff [15].
In the dimension of doctors in the rural area, the item that had
the lowest mean value was 'the doctor explains the answers to
questions raised by the patient'. These results are in line with research
conducted in Iran, where doctors did not provide enough
opportunities for patients to ask questions about their dental and
oral health problems, that was because of the short treatment
time and the large number of patients that must be treated, so
that time to explain the answers to patient’s questions was very
limited [18].
In the nurses dimension in the Urban and Rural areas, the item
that had the lowest mean value was ‘neatness, cleanliness and uniformity
of the nurse's clothes’. These results are not in line with
a research conducted in Bantaeng Regency where uniformity of
nurses was in the high category, because differences in appearance
would make it easier for patients to distinguish between doctors
and nurses or other staff [15].
In the pharmaceutical dimension in urban and rural areas, item
that had the lowest mean value was ‘neatness, cleanliness and uniformity
of pharmacy clothing’. This result is not in line with a
research conducted in Bantaeng Regency, where the uniformity
of each staff was in the high category, because the difference in
appearance would make it easier for patients to distinguish between
doctors and nurses or other staff [15].
In the dimensions of the hospital/community health service environment
in the Urban and Rural areas, items that had the lowest
mean value were ‘the cleanliness of the hospital environment’ for
the Urban area and ‘the beauty of the park around the hospital
or community health service’ in the Rural area. These results were not in line with a research conducted in California, where environmental
cleanliness and beauty of the park were in the high
category, because cleanliness would make patients, visitors or
staff more comfortable, especially with the presence of a park in
a hospital/community health service [19].
In this study it was found that service quality had a significant influence
on confidence. This is in line with a research conducted in
Iran's health services sector, where service quality had a positive
impact on patient confidence. Similarly, research conducted at the
Special Hospital of South Sulawesi and Malang General Hospital,
revealed the influence of service quality on confidence had a P
value of 0.028, which means that service quality significantly influenced
confidence [20-22].
The quality of service affects expectations and reality, if the patients
get more service, then the patients will say the service they
received has a certain quality and will develop into satisfaction
with the service. On the other hand, if the patients feel the service
is not in accordance with their expectations then the service
is judged to be of poor quality. Patients generally have expectations
in the form of pharmacists should be more friendly, more
responsive to patient needs, give medicines to patients with a fast
time, clearer writing of drugs, a waiting room that is more comfortable
and cleaner [23, 24].
Health services that are easily accessible can produce developments
in the use of health services by patients. Some actions need
to be taken to improve the quality of services in health facilities.
Health service staff, including nurses, registration officers, and
doctors, must continue to be trained in order to realize the wishes
of patients. The wishes and expectations of patients should be
heard in order to ensure good quality health services in rural and
urban areas. In addition, the environment in health care centers
must also be cleaner and healthier [25-29].
Conclusion
The dimensions that had the lowest mean values were the registration
dimension, the doctor dimension, the nurse dimension, and
the pharmaceutical dimension. On service quality, the dimensions
of registration, doctors and pharmacy had a significant influence
on community confidence. In addition, community confidence
had a good mean value, and the quality of health services had a
significant influence on community confidence.
Ethics Approval
Permission was approved from Faculty of Dentistry, Ethics and
Research Advisory Committee, Hasanuddin University.
References
- Indonesia Health Profile 2017. Jakarta: Ministry of Health of the Republic of Indonesia. 2018; 23.
- Polewali Mandar District Health Office. Health profile of Polewali Mandar District in 2014; 2015: 50.
- Ministry of Health Republic of Indonesia. Republic of Indonesia Law No. 4 of 2018 concerning hospital obligations and patient obligations. Indonesia. 2018; 5.
- Budiwan V. The understanding of Indonesian Patients of hospital service quality in Singapore. Procedia-Social and Behavioral Sciences. 2016 Jun 15;224:176-83.
- Lim JS, Lim KS, Heinrichs JH, Aali KA, Aamir A, Qureshi MI. The role of hospital service quality in developing the satisfaction of the patients and hospital performance. Manag Sci Letter. 2018; 8: 1353-1362.
- Nath V. Strategic quality improvement: an action learning approach. The King’s Fund; 2016.
- Mohebifar R, Hasani H, Barikani A, Rafiei S. Evaluating service quality from patients perception: application of importance-performance analysis method, Osong Pub Health Res Perspect. 2016: 7(4): 233-4. PMID: 27635373.
- Aman B, Abbas F. Patient’s perceptions about the service quality of public hospitals located at district kohat. J Pak Med Assoc. 2016; 66: 72-5.
- Birkhauer J, Gaab J, Kossowsky J, Hasler S, Krummenacher P, Werner C, et al. Trust in the health care professional and health outcome: a meta-analysis. PLOS ONE. 2017; 12(2): 2. PMID: 28170443.
- Shan L, Li Y, Ding D, Wu Q, Chaojie L, Mingli Jiao, et al. Patient satisfaction with hospital inpatient care: effects of trust, medical insurance and perceived quality of care. PLOS ONE. 2016; 11(10):3. PMID: 27755558.
- Ward PR, Rokkas P, Cenko C, Pulvirenti M, Dean N, Camey S, et al. A qualitative study of patient (dis)trust in public and private hospitals: the importance of choice and pragmatic acceptance for trust considerations in south Australia. BMC Health Services Research. 2015; 15: 297. PMID: 26223973.
- Polewali Mandar District Health Office. Polewali mandar health profile in 2016. 2017; 69: 71-74.
- Ministry of Health of the Republic of Indonesia in 2013. Secretariat of the Indonesian Medical Council: Dentist Ratio per 100,000 Population in Indonesia in 2013. 13.
- Schee EVD, Groenewegen PP, Friele RD. Public trust in health care: a performance indicator?. J Health Org Management. 2006; 20(5): 472. PMID: 17087406.
- Al-Damen R. Health care service quality and its impact on patient satisfaction “case of al-bashir hospital”. Int J Bus Manag. 2017; 12(9): 136.
- Akbar FH, Pasiga B, Samad R, Pratiwi R, Anwar AI, Djamaluddin N, et al. Evaluation of expectation and perceptions on quality of dental service in bantaeng district, south Sulawesi, Indonesia. J Int Dent Med Res. 2018; 11(3): 938-44.
- Masniah. An implementasion of outpatient online registration information system of mutiara bunda hospital. IJRAL. 2015; 4(12): 9-16.
- Dopeykar N, Bahadori M, Mehdizadeh P, Ravangard R. Assesing the quality of dental service using SERVQUAL model. Dental Res J. 2018; 15(6): 432- 34. PMID: 30534171.
- Clare CM. healing gardens in hospital, IDPRD. 2007; 1(1): 1-27.
- Lestariningsih T, Hadiyati E, Astuti R. Study of service quality and patient satisfaction to trust and loyalty in public hospital, Indonesia. Int J Bus Mar Manag. 2018; 3(2):1-2.
- Darti, Suhermin, Ujianto. Effect of service quality and hospital image on satisfaction, trust, and word of mouth. Int J Eco, Bus, Manag Res. 2018; 2(4): 96.
- Zarei E, Daneshkohan A, Khabiri R, Arab M. The effect of hospital service quality on patients trust. Iran Red Crescent Med J. 2015; 17(1): 1-3. PMID: 25763258.
- Kautsar AP, Neng RN, Dolih G. Effect of prescription waiting time on patient satisfaction mediated by service quality of pharmacy unit in public hospital in Bandung city. National Journal of Physiology, Pharmacy and Pharmacology. 2017; 7(11): 1230-4.
- Shafiq M, Muhammad AN, Zartasha M, Iram F. Service quality assessment of hospitals in Asian context: an empirical evidence from Pakistan. SAGE. 2017; 54: 1-2. PMID: 28660771.
- Husain MH, Mohammed MHR. Patients’ satisfaction with public health care services in Bangladesh: some critical issues. Malays J Med Biol Res. 2015; 2(2): 115-26.
- Akbar Fuad Husain, Pasinringi Syahrir, Awang Abd Hair. Factors Affecting Dental Center Service Quality in Indonesia. Pesqui. Bras. Odontopediatria Clín. Integr. 2019; 19: e4269.
- Akbar FH, Ayuandika U, Gender and Age Differences in Patient Satisfaction with Dental Care in the Urban and Rural Areas of Indonesia: Pilot Pathfinder Survey. Pesquisa Brasileira em Odontopediatria e Clinica Integrada. 2018; 18(1): 4093.
- Akbar Fuad Husain, Pasinringi Syahrir, Awang Abd Hair. Relationship Between Health Service Access to Dental Conditions in Urban and Rural Areas in Indonesia. Pesqui. Bras. Odontopediatria Clín. Integr. 2019; 19: e4652.
- Akbar FH, Samad R, Pasiga BD, Pratiwi R, Anwar AI, Djamaluddin N, et al. Influence of Waiting Times in Dental Offices Towards Patient Satisfaction and Evaluations of Patient/Provider Relationships in Bantaeng District, South Sulawesi, Indonesia, 2018. Journal of International Dental and Medical Research. 2019; 12(2): 682-687.


