Study on Performance of Offices of Dentists
Venkata Rajesh Kumar Pasupuleti1*, Venkata Vijay Kumar Pasupuleti2
1 General Dentist, Managing Dentist, Affordable Dentures and Implants, Amarillo, TX 79109, USA.
2 Fellow of IIM Indore, Senior Faculty, Finance, Institute of Insurance & Risk Management, Hyderabad, India.
*Corresponding Author
Dr. Venkata Rajesh Kumar Pasupuleti DDS, MPH,
General Dentist, Managing Dentist, Affordable Dentures and Implants, Amarillo, TX 79109, USA.
Tel: 6616184215
Fax: 8063524542
E-mail: pvrk6681@gmail.com
Received: Ocotber 14, 2020; Accepted: December 04, 2020; Published: December 10, 2020
Citation:Venkata Rajesh Kumar Pasupuleti, Venkata Vijay Kumar Pasupuleti. Study on Performance of Offices of Dentists. Int J Dentistry Oral Sci. 2020;7(12):1197-1203. doi: dx.doi.org/10.19070/2377-8075-20000237
Copyright: Venkata Rajesh Kumar Pasupuleti©2020. This is an open-access article distributed under the terms of the Creative Commons Attribution License, which permits unrestricted use, distribution and reproduction in any medium, provided the original author and source are credited.
Abstract
The offices of the dentists' sector are burdened with high debt levels in the capital. Still, due to interest coverage, the sector can
comply with debt obligations. The industry is good with fixed asset turnover rates; however, lower utilization of intangible assets
resulted in lower asset utilization. The sector has strong potential with increasing profit margins in the future.
The study finds that firms with an asset size lower than USD 2 million have lower receivables, payables, and higher dependency
on external debts. Simultaneously, these firms are also found to have higher profit margins and asset returns, reflecting higher asset
utilization. Whereas, the firms with asset size greater than USD 2 million have higher receivables, payables, owner funds, and
lower dependency on the external debts. However, they are found to have a lower return on assets even though they can generate
profit margins similar to small-sized asset firms. The study recommends that the large-sized firms need to increase asset utilization
to achieve higher profit margins. Small-sized firms need to decrease the dependency on external debts by either infusing owners'
funds or plowing back profits for reinvestment in the firm.
2.Introduction
3.Background
4.Objective and Methodology
5.Analysis
6.Conclusion
7.Refereces
Keywords
Dental Offices; Financial Performance; Life Cycle Stages; Operational Performance.
Introduction
Profits & long-term sustainability are the primary motives of a
commercial entity. The dentists' office's office has a similar objective
in addition to the service to the patients. The surplus is
attained with either higher pricing of the services or lower costs
incurred. Revenue can be increased by providing services to multiple
customers. Increased sales with effective utilization of the
resources lead to higher profit margins.
Studies in dental offices were focused upon the increased revenues.
Increased patient care needs increment in the assets for
smooth business operations. These additional revenues can be
converted into higher profit margins with the help of the economies
of scale in operations. Hence, the study on dentists' offices'
performance with respect to asset size and utilization becomes an
imminent necessity.
The size of the firm is dependent upon the assets possessed by
the firm. The presence of huge assets helps in achieving higher
business growth rates. A larger asset size reflects the higher
amount of resources available for the operations of the business.
In addition to asset size, Optimum utilization of resources would
result in higher profit margins (utilization reduces the costs with
economies of scale in operations). Underutilization of resources
generates unnecessary burdens on the firm's earnings and leading
to lower profits or losses in the future.Higher sales will generally
drive the utilization of the assets.
Assets are defined as the items or entities that have the potential
to generate positive cash flows in the future. Assets are classified
as current assets (life of less than one year) and the noncurrent
assets (have a life greater than one year). Current assets majorly
consist of Cash & cash equivalents, account receivables, inventory,
prepaid expenses, etc. whereas, noncurrent assets consist of
property, plant & equipment, intangible assets, and fixed assets.
Cash & cash equivalents are required for smooth functioning in
the short term.A high level of cash leads to lesser returns,whereas
a lower amount of cash would lead to a liquidity crisis.
Current assets help the firms to overcome the short term obligations.
Failure to compensate for the short-term obligation leads to
the discrepancies or discontinuance of business operations. Failure
to pay employee remuneration in time or delay of payment to
the vendors would result in business operations disturbances [1].
Noncurrent assets consist of fixed assets and intangible assets
(patents, etc.). Fixed assets consist of machinery, vehicles, and
equipment. Higher fixed assets increase the operating leverage,
in turn, supports a higher level of sales. Operating leverage will
also increase asset utilization. Intangible assets are assets without
physical form. They consist of software, patents, etc., which help
the optimal utilization of assets and also helps in providing specialization.
Receivables are the amount to be received from the customers
based on the credit services provided. Firms engage in credit services
to increase sales. However, the increased credit sales might
also lead to higher bad debts due to the increased default rate by
the customers.
Liabilities can be defined as the obligation of the firm towards the
external parties of the firm. Liabilities consist of current liabilities
and noncurrent liabilities. Current liabilities majorly consist of
notes payable, trade payables, whereas noncurrent liabilities consists
of the long term debt and net worth (equity) [1].
Notes payable are short-term financing channels. Generally, it includes
short term borrowing and debts. This debt has a tenure
lesser than a year with periodic interest payments. Generally, the
interest rates of short term debts are higher than the long term
debts.
Trade payables are the payments of outstanding expenses to the
vendors or any other parties. The firm has an obligation towards
the payment. Generally, interest is not charged on the outstanding
payables; however, the relation deteriorates in case of delay or
default of payments.
Long term debt is the debts that have tenure for more than a year.
Interest payments are periodic. The firm must pay to debt holders
irrespective of the financial capability of the firm. In the case
of default, the firm is forced for bankruptcy by the debt holders.
Equity or net worth is the owner's fund investment in the firm.
These funds have no concrete obligation by the firm towards the
shareholders in terms of periodic payments. However, mature
firms periodically distribute dividends to shareholders. Equity
value is lost in the case of consistent losses for multiple years.
Firmsgenerally have a higher risk with exposure to external debt
than any other item of liabilities as these debt holders can force
the firm to go for bankruptcy in the case of default of periodic
interest payments or principal repayments.
The composition of the assets and liabilities varies according to
the life cycle stage of a firm. These compositions vary across different
sectors. The study of the average composition in the industry
helps to understand the characteristics of the sector. The
characteristics are based on the type of sector, financing, investing,
and the firms' life cycle stage.
The performance of the firms is measured in both the operational
and financial dimensions. Operational performance is measured
on the basis of the turnover rates of fixed assets and total
assets. The higher the operational turnover rates, the better is the
utilization of the resources.The current ratio and the quick ratio
reflects the short term liquidity position of the firms. These ratios
also reflect the ability of the firm to honor the short term obligations.
The interest coverage ratio reflects the ability of the firm
to repay its periodic interest obligations towards debt. Whereas,
the debt-equity (D/E) ratio reflects the financial risk of the firm
undertakes. The higher the D/E value, the higher is the financial
risk of the firm. Both the D/E ratio and interest coverage reflects
the solvency of the firm.
Operating profit margin is Earning before interest & taxes (EBIT)
divided by the total sales), i.e., the proportion of profitability generated
on the firm's sales on delivery of the product/service.
EBIT is surplus generated after the deduction of manufacturing
and operational expenses (consists of marketing and delivery expenses).
Similarly, Return on assets is the firm's ability to generate
profits on the assets applied. Effective utilization of the assets
results in the increment of the operating margin and also drives
the return on assets.
Objective and Methodology
The study's objective is to understand the sector's patterns in the
past five years (2014 -2018). To analyze the dental office characteristics
based on the assets and liabilities composition.
Ratio analysis forms the basic method for analyzing financial
statements. Common size analysis and performance ratios are
considered for in the detailed analysis.
Data of offices of dentists retrieved fromRisk Management Association
[3] is undertaken for the analysis. Data reflects the different
entities of varying asset sizes specializing in dental treatment,
supporting dentistry activities, the raw material suppliers
for dentistry, technical equipment manufacturers, etc. The sectoral
analysis is studied with the average values of allstages of firms
(more than 2000 firms) in the dental domain between 2014 and
2018. All the asset items are calculated as a percentage of total
assets. Various liabilities are calculated as a percentage of the total
liabilities of the respective year. That is, common size analysis
forms the vital methodology for analysis. Varying sizes of the
firms also reflect the life cycle stage of the entity. Classification
of these firms based upon the asset size is undertaken for analysis
with 2018 data.
Firms are classified into different stages of the life cycle stage based on asset value [2]. The life cycle of dentistry can be classified
into four stages based on asset size. Firms with an asset size
of less than USD 0.5 million can be considered as startup firms.
Firms with an asset size between USD 0.5 million to USD 2 million
are classified as Young growth firms. Firms with an asset
size of USD 2 million to USD 10 million are classified as Mature
growth firms, and Mature firms are the firms with the asset size
greater than USD 10 million (refer figure 1).
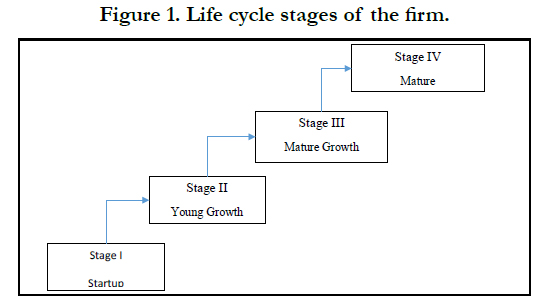
Figure 1. Life cycle stages of the firm.
Though the data belongs to different firms, the average value reflects the firms' typical characteristics in those respective stages.
As a part of the initial analysis, common size analysis is undertaken
for all (above 2000) firms for each year for the past five
years (2014 to 2018).
On the asset side, variation has been minimal in Cash & equivalents
as maintained at 25% for the whole period between 2014 and
2018. Similarly, the trade receivable is maintained at 2.8% across
five years. Fixed assets had decreased from 39.2% in 2014 to
34.5% in 2018. At the same time, intangible assets had increased
from 19.1% in 2014 to 25.6% in 2018. An increase in the leverage
of intangible assets reflects a focus shift towards the specialization
in dental activities. Additional software support activities in
dental services help in the effective utilization of the resources
for core activities.
There has been a decrease in the asset turnover rates from 3.6
in 2014 to 3.1 in 2018. In contrast, fixed turnover rates have remained
between 14 to 15 for the past five years. The decrement
of fixed assets in total assets still resulted in constant FATO, reflecting
lower utilization of the fixed assets. The decrement of
asset utilization is because of the underutilization of either intangible
assets or current assets.
On the other hand, Long term debt in total liabilities has increased
from 54.7% in 2014 to 57.2% in 2018. Simultaneously, the
net worth had increased from 1.7% in 2014 to 3.1% in 2018. The
debt and equity compositions reflect that the firm is still dependent
upon the external debt holders. The debt to equity ratio has
increased from -24.3% in 2014 to -7% in 2018. This reflects the
increase in the equity or owners' funds either due to the infuse of
new capital or increased profits. However, the sector is still heavily
dependent on the external debts for the capital requirement. The
interest coverage ratio has always been maintained above 6, reflecting
higher sector capability in servicing the debt obligations.
The operating margin had increased from 14.4% in 2014 to 15.4%
in 2018. This reflects better sustainability in the future for the
dental offices. Returns on assets have also increased from 24.2%
in 2014 to 27.7% in 2019; this has been possible due to the profit
margins' increment. Effective utilization of assets would have resulted
in the generation of higher returns on assets.
Firms were analyzed with respect to categories (based on asset size), and the following observations were made. It is found that
startup firms tend to have 32.3 percent of assets in cash, forming
the lion share in their current assets & total assets (refer figure 2).
The Mature growth and matured stage firms are found to maintain
9.3 percent & 16.8 percent of assets as Cash & equivalents.
Both the Startup and Young growth stage firms have receivables
lesser than 2.6% of their assets, whereas the other firms can support
8.3% to 12.4% of assets as receivables. This shows that the
Young growth stage and Startup firm's financial inability to extend
the credit to their customers.
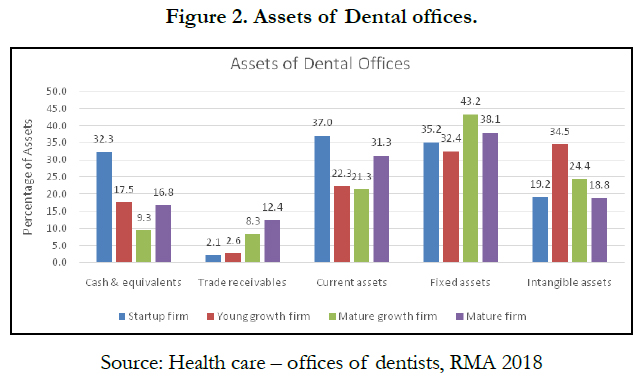
Figure 2. Assets of Dental offices.
Startup firms maintain the total current assets at 37% of total assets, whereas, Matured firms have only 31.3 % of total assets as current assets. Startup firms are focused on sustenance by providing customer services and hence requiring higher fixed assets than intangible assets. Startup and Mature stage firms have the smallest intangible asset size. This is due to the difficulty in owning intangible assets by startup firms due to additional cost burden and low economies of scale. Mature firms tend to have low intangible assets as they would have procured and built expertise in the Mature growth stage itself. Matured stage firms would focus upon economies of scale with higher investment in the fixed assets; effective utilization of these fixed assets would result in higher sales. Young growth firms have 32.4% assets in fixed and 34.5% assets in intangible assets. Growing firms tend to invest in fixed assets. Young growth firms are also undertaking higher investment in intangible assets for their growth in specialized services. Mature growth stage firms are having 43% of assets in fixed assets and 24.4% assets in intangible assets. Their focus at this juncture is to increase sales withhigher asset utilization. Whereas, investment in intangible assets is not as aggressive as in their Young growth phase. But higher than the Startup phase investment levels in intangible assets.
Startup firms found to have 20 percent of total liabilities as notes
payable (refer figure 3). The Mature growth &Maturestage firms
are found to have hardly 4 percent as notes payable. The startup
firms tend to depend on the short term financing to substantial
amount whereas, Mature growth firms are least dependent on
short term financing alternatives.
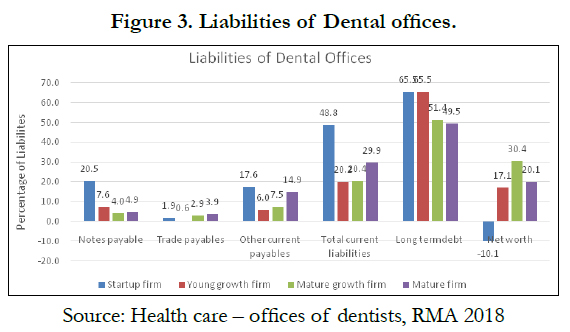
Figure 3. Liabilities of Dental offices.
Mature firms are dependent on the trade payables to 3.9%, whereas the startup firms are only limited to 1.9% of total liabilities. i.e., Mature growth&Maturestage firms generally have higher negotiation power over vendors and can get a better deal with the vendor to delay the payments, which is not the same with the startup firms.
Mature growth& Mature size firms are dependent on long termfunds, up to 50% of the total liabilities. In contrast, Young growth firms tend to maintain 65% of total liabilities as short and long-term debts. The dependence of Mature growth and Mature firms on equity leads to lesser dependence on the long term debt. Whereas startup firms have a negative net worth (equity), leading the startup firms to depend on more than 85% of total liabilities as external debt. In the case of Young growth firm, though they have positive equity, however lesser dependence in short term debt results in higher dependence on the long term debt.
Debt brings a periodic burden in terms of interest and principal amount repayments. Hence, the startup firms take a higher risk as they are dependent on debt (both the short & long term) to 85% of the total liabilities. At the same time, the least risk is exposed toMature stage firms as they dependent on debts only up to 55% of total liabilities. It is also found that the Mature growth firms maintain the maximum net worth. This is the result of the lesser dependence on external debt, i.e., to the extent of 55% of total liabilities.
Short-term debts generally have higher interest payments and risky in terms of repayment (due to lower tenure). So lesser dependence in the short term debts is better for the solvency of the firms.Less dependence on the external debt would result in lower periodic payments and hence lesser risk. It will also help retain more income inside the organization to have a higher net worth.
The Net Fixed Assets Turnover rate (FATO) of the Startup stage
firms is 25, whereas the Mature growth and Mature stage firms
had only 6.4 (refer figure 4). Young growth firms had a (FATO)
of 10. This reflects the Startup stage firms have very high utilization
of the fixed assets compared to other stage firms. As in the
initial stages, firms strive with the scarce resources to provide the
services. However, as they grow in fixed asset sizes, they are found
the turnover rates are decreasing to 6.4. Total Assets Turnover
rate (ATO) is in similar lines to FATO. i.e., the Startup stage firm
has an ATO of 5.1 as compared to 1.5 to 1.8 for the rest of the
stages. The Startup stage firms undertake the best utilization of
the assets compared to others.
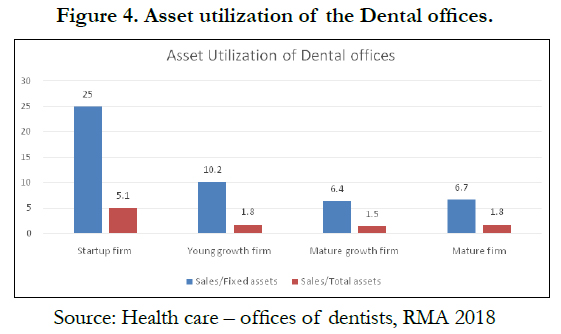
Figure 4. Asset utilization of the Dental offices.
Working capital management helps the firms to function with the day to day activities smoothly. Both the Current ratio & quick ratio of the firms of all stages varies between 0.8 and 1.1 (refer figure 5). The low difference between the current ratios and quick ratio reflects low inventory carried in the sector. The Young growth and Mature growth stage firms have maintained the current ratio at 1.1. At the same time, the Startup stage firm has a current ratio of 1. The Mature stage firms have higher liquidity risk as the current ratio is maintained at 0.9. The whole sector has very low liquidity ratios, and hence the sector will be stricken badly in volatile markets.
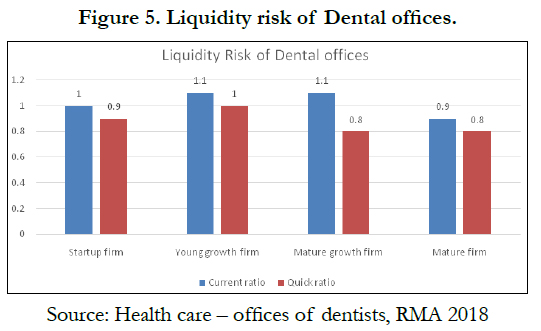
Figure 5. Liquidity risk of Dental offices.
The interest coverage ratio is greater than 6 of the whole sector
(refer figure 6). This reflects the ability of the firm to comply with
the obligations of the debt holders. The debt to equity ratio is
negative for Startup and Young growth. The Mature growth stage
firms have a D/E ratio of 18.6, and the Mature stage firm has
3.9. This shows that the sector is heavily dependent on external
debts for the capital. This dependency on external debt is least in
the Mature stage firm. The firms increase the equity infusion by
the time they reach the mature stage since the sector has a highinterest
coverage ratio and hence faces lower risk even in higher
dependency on external debt.
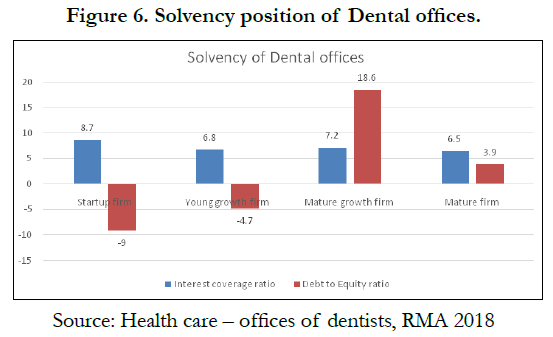
Figure 6. Solvency position of Dental offices.
Operating profits are lowest in the Mature stage firms at 6.2% (refer figure 7), whereas both the Young and Mature growth firms have maintained the operating margin at 18%. The startup stage firm also has an operating profit margin of 13.8%. i.e., the sector is gaining the operating margin at the growth stages and losing the margin to the least by the time it reaches the Mature stage. Inefficient asset utilization would also result in a lower operating profit margin.
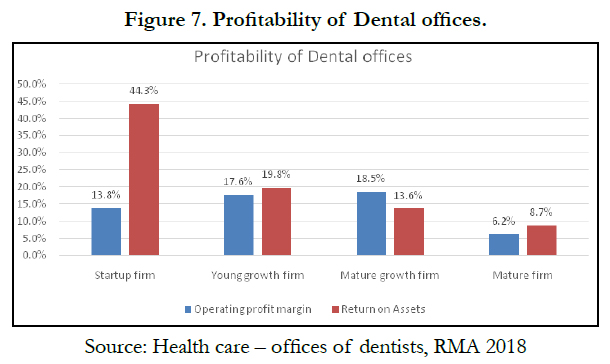
Figure 7. Profitability of Dental offices.
The pre-tax return on assets is 44.3% for Startup stage firms, 19.8% for Young growth firms, 13.6% for Mature growth firms, and 8.7% for Mature stage firms. That is, the returns on assets are highest for Startup stage firms with the best asset utilization. Whereas, at least for Mature stage firms due to the least utilization of the resources.
Conclusion
Overall sector analysis concludes that the sector is highly burdened
with the external debt (both the short & long term debt).
However, higher interest coverage levels help in the sector to be in
compliance with periodic interest and principal repayments. The
sector also has one of the least burdens of inventory and receivables.
Higher fixed asset turnover and decreasing asset turnover
reflects the ineffective utilization of intangible assets. Lower liquidity
levels do have a higher risk in terms of obligations towards
compliance of short term obligations. Operating margins
are maintained at a constant level; however, pre-tax returns on
assets have been increasing across the five years. Optimum utilization
of assets would result in higher profit margins.
Analysis ofassets of the various stages of the life cycle of dentist
offices, it can be concluded that receivables, as part of total assets,
will be increased as the firm's asset size increases (refer figure
8). As part of the total assets held, Cash and equivalents will be
reduced as the firms' transits towards the mature stage of the
life cycle. Intangible assets increase as the firm transitions from
startup size firm to Young growth & Mature growth; however,
intangible assets proportion in total assets decreases once the firm
reaches the Matured stage. As a matured stage firm, it is focused
on revenue generation by increasing the fixed assets rather than
the intangible assets.
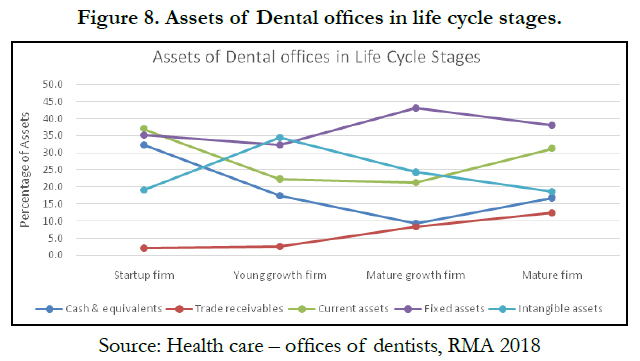
Figure 8. Assets of Dental offices in life cycle stages.
Fixed asset seems to be increasing as proportionate to total assets as the firm transit from startup towards the Mature form. For startup-sized firms, fixed assets become vital components, whereas, in the growth phase, intangible assets also play an essential role. However, again, in the Mature stage, the requirement of higher sales drives the fixed asset investment.
Analysis of assets of the various stages of the life cycle of dentist offices, it can be concluded that as the firm transit from the startup size to Mature growth and Mature stage, firms tend to have lesser and lesser dependence on short-term debts. Similar is the case with the long term debts also. i.e., as the firm moves to a mature stage, they tend to have the lowest dependence on the external debts.
Due to higher dependence on external debts& note payables (refer figure 9), the startup firms tend to have a lower or negative net worth. Simultaneously, the Mature growth&Maturestage firms are infusing the owner funds to finance the liabilities. Especially, Maturegrowth firms are 30% of total liabilities are of net worth.
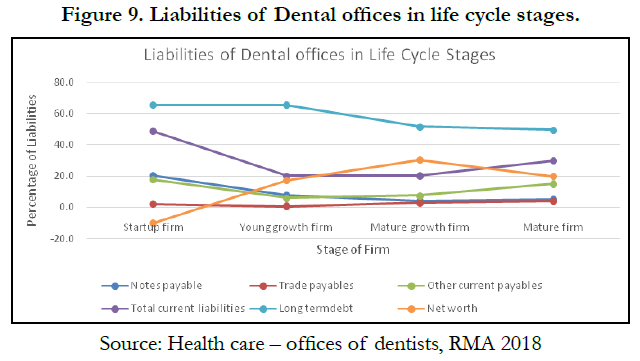
Figure 9. Liabilities of Dental offices in life cycle stages.
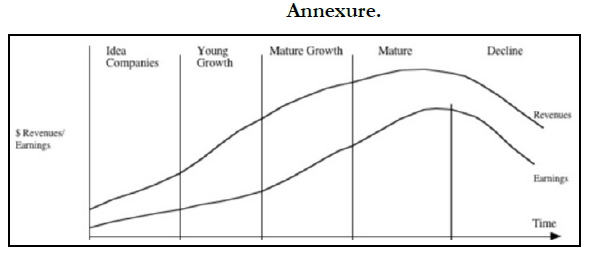
Annexure.
Trade payables seem to increase as the firm evolves to higher stages of Maturity. Overall current liabilities are falling as the firm transit from startup size firm towards the Mature size firms.
All the firms have a high liquidity risk because of low current ratios and quick ratios. The whole sector is also heavily dependent on the external debts, but due to high-interest coverage ratios, it complied with periodic interest payments.
Operating margins are found to be high for all stages of firms except for Mature stage firms. Startup stage firms have high asset utilization and hence result in a high return on assets. Whereas the Mature stage firms have the least asset utilization and low operating margin, resulting in a lower return on assets.
References


