CYP2B6 Genotype Guided Dosing of Propofol Anesthesia in the Elderly Based on Nonparametric Population Pharmacokinetic Modeling and Simulations
Eugene AR*
Division of Clinical Pharmacology, Department of Molecular Pharmacology and Experimental Therapeutics, Gonda, Mayo Clinic, First Street SW, Rochester, MN, USA.
*Corresponding Author
Andy R. Eugene, MD, PhD,
Division of Clinical Pharmacology,
Department of Molecular Pharmacology and Experimental Therapeutics,
Gonda 19, Mayo Clinic, 200 First Street SW,
Rochester, MN 55905, USA.
E-mail: eugene.andy@mayo.edu
Received: November 07, 2016; Accepted: December 31, 2016; Published: January 02, 2017
Citation: Eugene AR (2017) CYP2B6 Genotype Guided Dosing of Propofol Anesthesia in the Elderly Based on Nonparametric Population Pharmacokinetic Modeling and Simulations. Int J Clin Pharmacol Toxicol. 6(1), 242-249. doi: http://dx.doi.org/10.19070/2167-910X-1700041
Copyright: Eugene AR© 2017. This is an open-access article distributed under the terms of the Creative Commons Attribution License, which permits unrestricted use, distribution and reproduction in any medium, provided the original author and source are credited.
Abstract
Objective: The primary aim of this article is to test the hypothesis that nonparametric pharmacometric modeling will accurately identify CYP2B6 genotype subgroups based on data from a study that reported results based on parametric pharmacokinetics (PK).
Methods: Propofol concentration-time data were originally reported in the Kansaku et al., 2011 publication. Nonparametric Nonlinear Mixed Effects Modeling (NLME) was conducted using the PMETRICS R package while population pharmacokinetic model parameters were estimated using a FORTRAN compiler. Finally, model-based dosing simulations were
conducted in the MATLAB Simbiology.
Results: A total of 51 patients were included in the final PK analysis. A two-compartment gamma multiplicative error model adequately described the propofol concentration-time data. The individual observed versus predicted R2=0.99 and R-squared=0.93 for the population model predictions. Neither the UGT1A9 nor the CYP2B6 G516T gene variants resulted in statistically significant PK parameter differences while the CYP2B6 A785G gene variants resulted in statistically significant differences for the elimination rate. Model-based dosing-simulations comparing patients with the CYP2B6 AA & AG genotypes to both GG genotypes and patients from a multicenter trial suggest a 50% decrease in propofol infusion dose, to 25mg/kg/min, be made to result in approximately equivalent drug exposures.
Conclusion: Based on the pharmacometric modeling and simulation, if no dosage adjustments are made for the elderly CYP2B6 AA and AG genotypes, a 250% higher propofol blood exposure will be evident within 1-hour from the start of the infusion. Thus, based on the pharmacokinetic model, genotyping elderly patients for the CYP2B6 AA and AG gene variants will decrease the total propofol blood exposure during anesthesia and sedation when an infusion dose adjustment is made to 25mg/kg/min.
2.Introduction
3.Methods
3.1. Literature-based Data Source
3.2. Pharmacometric Modeling
3.3. Pharmacokinetic Dosing Simulations
4.Results
4.1. Participants
4.2. Population Pharmacokinetic Model
4.3. Propofol Dosing Simulations
5.Discussion
6.Conclusion
7.Acknowledgement
8.References
Keywords
Precision Medicine; Propofol; Genotype; Nonparametric Pharmacokinetics; Anesthesia.
Introduction
It is known that propofol is primarily metabolized by the cytochrome P450 2B6 (CYP2B6) gene, with metabolic contributions from CYP2C9, UDP glucuronosyltransferase 1A1 (UGT1A1), and UGT1A9 [1-4]. Further, it is also known that propofol is a widely used intravenous anesthetic used for the induction and maintenance of anesthesia, as well as, for sedation in mechanically ventilated patients [5]. However, despite the clinically relevant single nucleotide polymorphisms (SNPs) associated with CYP2B6 informing healthcare professionals to account for patient genotypes when prescribing, no study has proposed genotype-informed dose adjustments for patients administered propofol [6, 7].
A study by Loryan and colleagues reported that common CYP2B6 and UGT1A9 SNPs were tested in patients administered propofol; however, no significant genotype-based findings were found [8]. Similarly, Choong and colleagues reported no significant differences in neither the CYP2B6 nor the UGT1A9 SNPs on propofol metabolism, but found that women metabolize propofol faster than men [9]. Several studies have attempted to test whether the polymorphic CYP2B6 gene results in any significant differences in propofol clearance and consciousness following bolus doses and infusions, but none have resulted in recommendations for gene-guided propofol dosage adjustments [8, 10-13].
One consistent theme among studies is the wide interindividual variability in propofol plasma levels; however, no quantifiable pharmacometric parameter, based on genotype, has been reported for later hypothesis-testing. Further, experiments are often repeated and patients with lower frequency allele subgroups are consistently under-represented, leading to potentially incomplete results due to statistical power. These cases may be addressed by applying principles of pharmacometric modeling and simulation where Monte-Carlo simulations are conducted using mathematic model parameters from original studies of varying sizes to represent patient subgroups [14]. This article uses nonparametric pharmacometric modeling of a previously published propofol study to identify doses precisely based on the CYP2B6 genotype [10].
So, with this information as a background, the primary aim of this article is to test the hypothesis that nonparametric pharmacometric modeling will accurately identify CYP2B6 patient subgroups in a dataset that previously used parametric pharmacokinetics. If pharmacogenomic differences exist, then equivalent propofol doses will be provided for each patient subgroup. Thus, the aim of model-based dosing simulations will be to result in approximately equivalent propofol exposures, for CYP2B6 gene variants, measured as the area under the curve (AUC).
The propofol concentration-time data are referenced from the from the Kansaku and colleagues article [10]. In the study, fiftyone patients were genotyped for CYP2B6 785 A>G, CYP2B6 516 G>T, and UGT1A9 1399 C>T using blood samples. Further details may be referenced in the original study [10].
Population pharmacokinetic (PopPK) modeling was conducted using the Non-Parametric Adaptive Grid (NPAG) algorithm in the Pmetrics R package (version 1.41, Laboratory for Applied Pharmacokinetics, Los Angeles, CA, USA) [15]. Pmetrics is a nonparametric pharmacokinetic and pharmacodynamic (PK/ PD) modeling and simulation package that runs in the R programming language environment (version 3.2.2, The R Foundation for Statistical Computing, Vienna, Austria) [16]. The PopPK model parameters were computed using a FORTRAN compiler [17]. The computations run in a separate DOS-based window and adheres to the ISO FORTRAN 95 Programming Language standard [17]. Moreover, G-FORTRAN supports the legacy F77, the newer FORTRAN 2003, and 2008 features [17]. As an overall diagnostic step to validate the model, a Prediction Corrected Visual Predictive Check (PC-VPC) was conducted using the PMETRICS package [15].
The following covariates were tested: age, gender, body-weight, CYP2B6 G516T genotypes, CYP2B6 A785G genotypes, and UGT1A9 genotypes. These covariates were assessed using a stepwise additive approach, followed by a backward elimination step for the following pharmacokinetic parameters: volume of distribution in the central compartment (Vc), rate of elimination from the central compartment to the peripheral compartment (Kcp), rate of elimination from the peripheral compartment to the central compartment (Kpc), and the elimination rate from the central compartment (Ke). Selection of the final pharmacokinetic model was based on the: goodness-of-fit plots, Akaike Information Criterion (AIC), and the Prediction Corrected Visual Predictive Check (PC-VPC). Statistics for subgroup analysis were based on the Kruskal-Wallis test with Bonferroni correction, post-hoc.
Propofol dosing simulations were conducted based on recommendations from the propofol package insert [5]. Dosing recommendations for adults weighing 70kg were compared to modelbased PopPK parameters estimated in this paper to achieve an approximately equivalent propofol drug exposure for a bolus induction dose followed by a maintenance infusion. A table of the final genotype guided dosing recommendations is reported relative to the AUC for each virtual-elderly patient subgroup. Pharmacokinetic dosing was conducted using MATLAB Simbiology (Mathworks, Natick, Massachusetts, USA).
A total of fifty-one patients and 357 propofol plasma concentrations were included in the pharmacokinetic modeling process. The patient ages ranged from 42 to 81 years with a population mean ± standard deviation (S.D.) of 65 ± 8.7 years. The body weight ranged from 40.2 to 83kg with a population average of 59kg ± 10kg. Propofol doses ranged from 392mg to 2430mg with a study average of 1096mg ± 440mg. Study infusion times ranged from 100 to 347 minutes with a study average of 228min ± 66min. Further details regarding the demographics for the population genotype subgroups are found in the original study [10].
A two-compartment gamma multiplicative error model adequately described the propofol concentration-time data. The model converged after 2581 cycles in the FORTRAN compiler environment. Figure 1 illustrates the observed versus predicted population and individual Bayesian posterior predictions. The precision of the goodness-of-fit plots resulted in an R2 of 0.927 and an R2 of 0.992 for the population prediction and individual predictions, respectively. Further, the final PopPK model evaluation was based on the weighted residual plots, normalized prediction distribution error plots. Results of the full individual Bayesian posterior propofol Post-Infusion Time time-output profiles from each of the 51 patients with the pharmacokinetic predictions superimposed on the observed plasma levels are shown in Figure 2 to Figure 7. Lastly, the model selection was based on the prediction-corrected visual predictive check (VPC) and is illustrated in Figure 8.
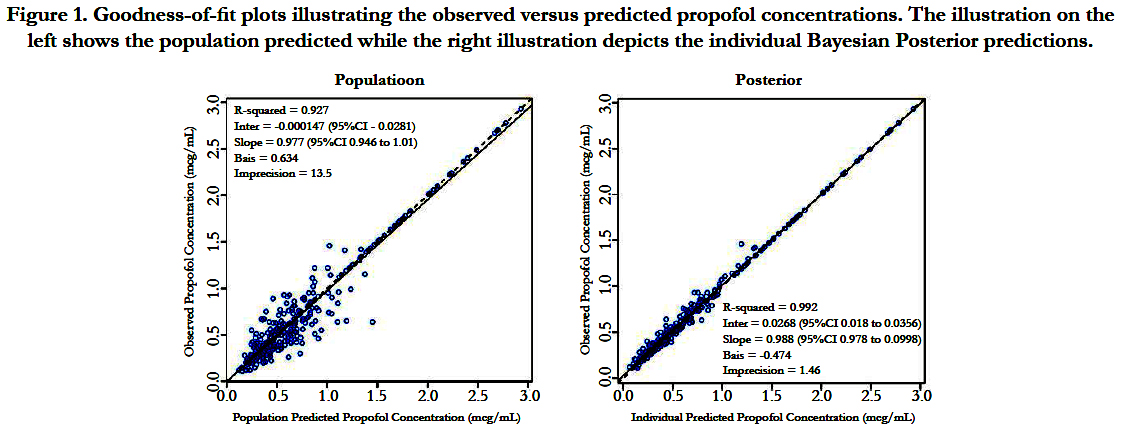
Figure 1. Goodness-of-fit plots illustrating the observed versus predicted propofol concentrations. The illustration on the left shows the population predicted while the right illustration depicts the individual Bayesian Posterior predictions.
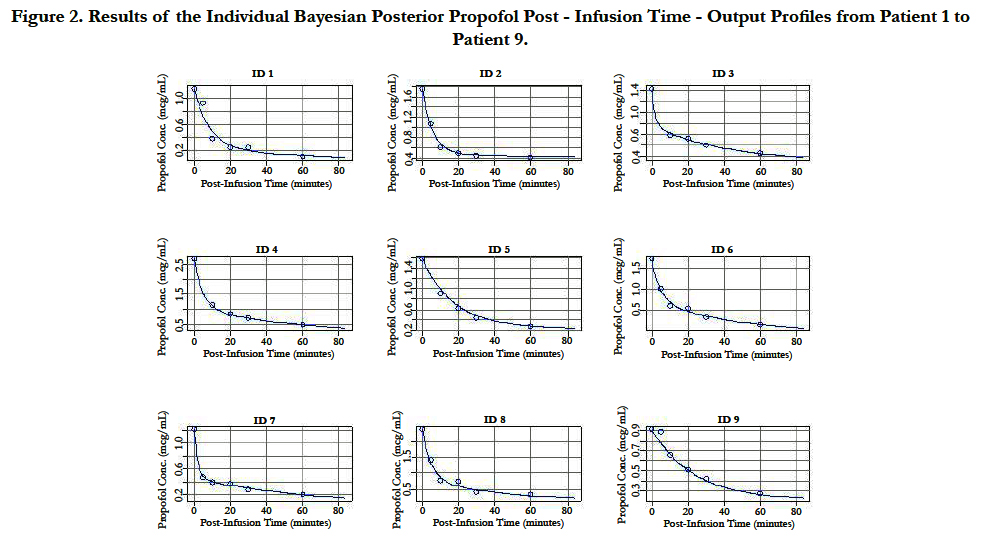
Figure 2. Results of the Individual Bayesian Posterior Propofol Post - Infusion Time - Output Profiles from Patient 1 to Patient 9.
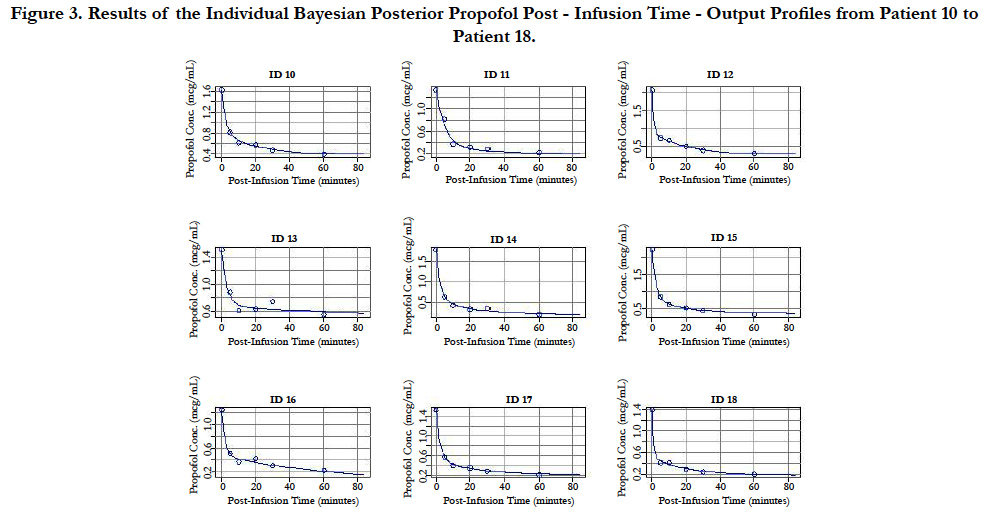
Figure 3. Results of the Individual Bayesian Posterior Propofol Post - Infusion Time - Output Profiles from Patient 10 to Patient 18.
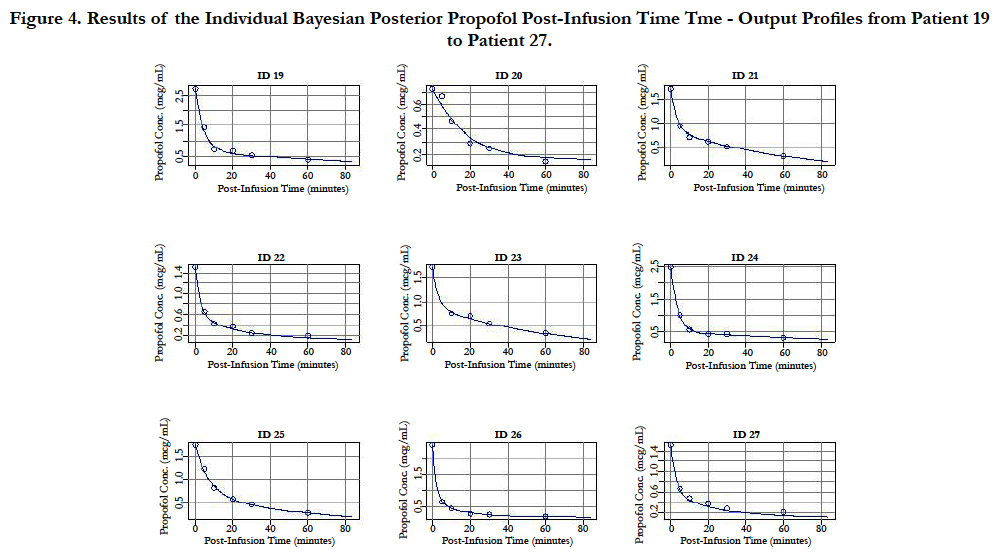
Figure 4. Results of the Individual Bayesian Posterior Propofol Post-Infusion Time Tme - Output Profiles from Patient 19 to Patient 27.
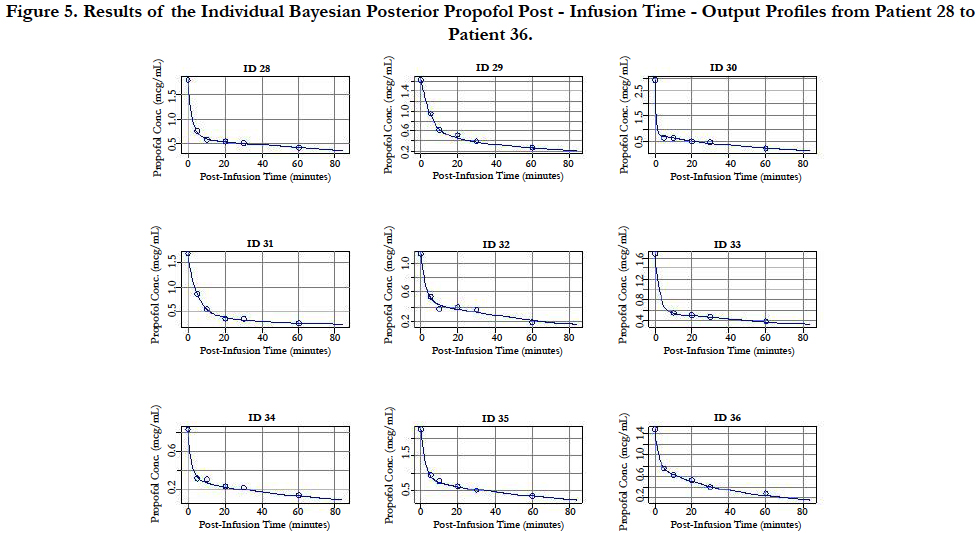
Figure 5. Results of the Individual Bayesian Posterior Propofol Post - Infusion Time - Output Profiles from Patient 28 to Patient 36.
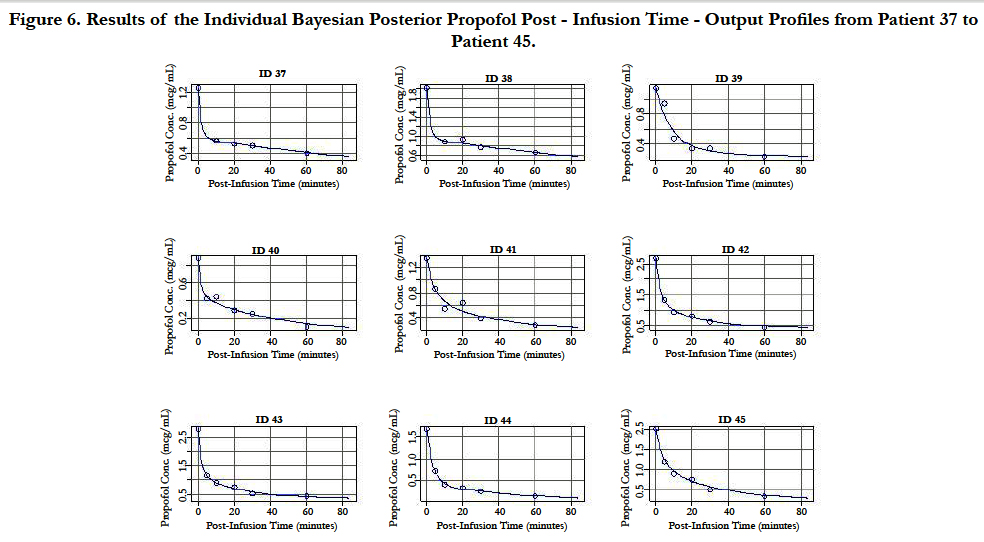
Figure 6. Results of the Individual Bayesian Posterior Propofol Post - Infusion Time - Output Profiles from Patient 37 to Patient 45.
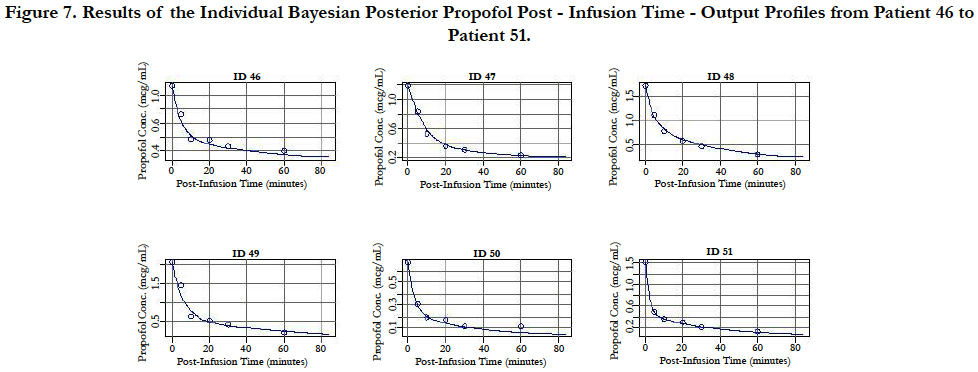
Figure 7. Results of the Individual Bayesian Posterior Propofol Post - Infusion Time - Output Profiles from Patient 46 to Patient 51.
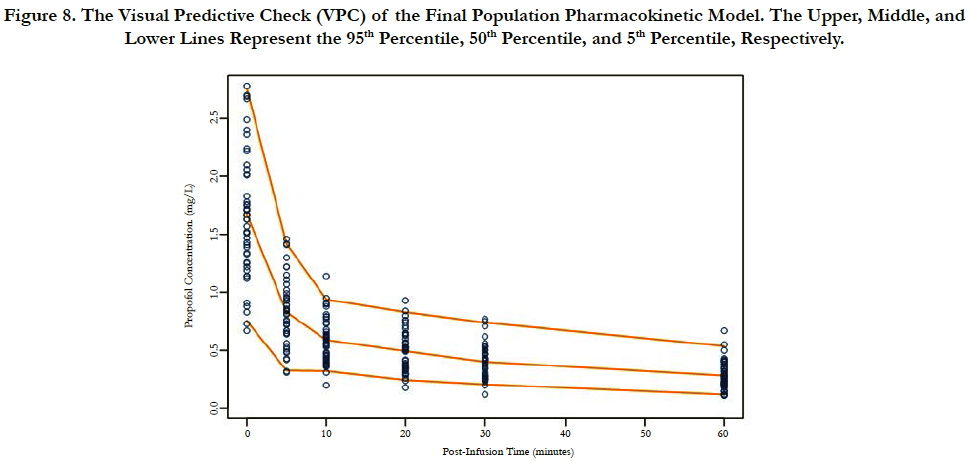
Figure 8. The Visual Predictive Check (VPC) of the Final Population Pharmacokinetic Model. The Upper, Middle, and Lower Lines Represent the 95th Percentile, 50th Percentile, and 5th Percentile, Respectively.
The final population pharmacokinetic parameter estimates are: elimination rate from the central compartment, KeCYP2B6 AA AG = 0.057min-1 (CV=57%) and KeCYP2B6 GG=0.152min-1 (CV=38%), elimination from the central compartment to the peripheral compartment Kcp=194min-1 (CV=94%), elimination from the peripheral com partment to the central compartment, Kpc=162min-1 (CV=69%), and the volume of distribution in the central compartment, VC0=159mL/kg(CV=134%). Neither the UGT1A9 nor the CYP2B6 G516T genotypes resulted instatistically significant elimination ate parameter differences. However, the CYP2B6 A785G (rs2279343) gene variants resulted in statistically significant differences for the Ke (p=0.044) between the G/G (0.152min-1) homozygotes and the A/G(0.053min-1) heterozygotes. Further, or the population model, the CYP2B6 AA (wild-type) and AG (heterozygote) genotype elimination rates were grouped, resulting insignificant differences, p=0.014, for Ke when compared to the G/G homozygous mutant alleles. Figure 9 illustrates the propofol limination rate differences in the final model. The final nonparametric pharmacometrics model estimates are provided in Table 1.
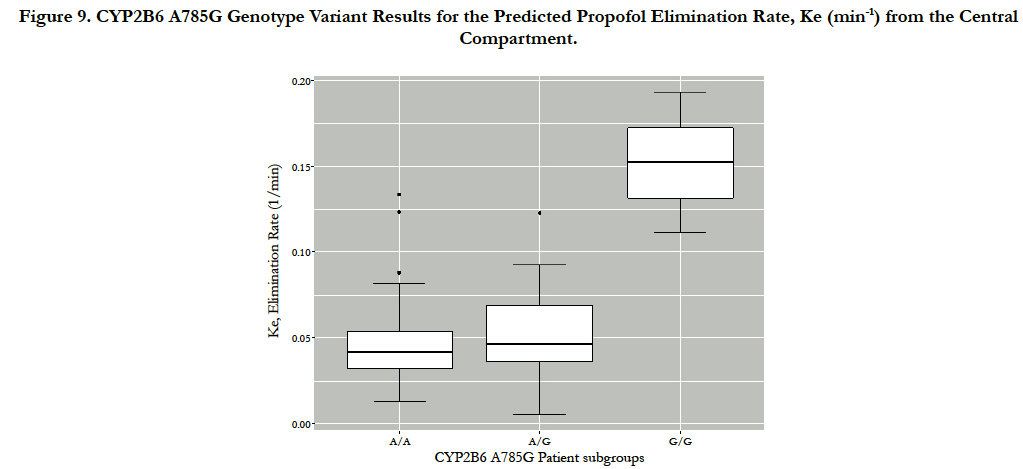
Figure 9. CYP2B6 A785G Genotype Variant Results for the Predicted Propofol Elimination Rate, Ke (min-1) from the Central Compartment.
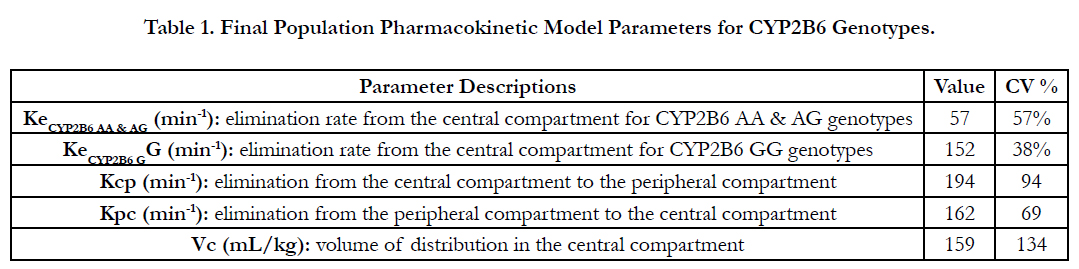

Table 1. Final Population Pharmacokinetic Model Parameters for CYP2B6 Genotypes.
The product of the elimination rate from the central compartment, Ke, with the volume of distribution in the central compartment, VC, results in the clearance rate. Therefore, the calculated clearance rates for the CYP2B6 genotype subpopulations are CLCYP2B AA AG=9.1mL/kg/min and CLCYP2B6 GG=24.2mL/kg/ min. Further, to avoid unnecessarily high blood propofol concentrations, which may translate to prolonged hypotension or apnea as well as other complications, dosing simulations resulting in an approximately equivalent maximum propofol concentration (Cmax), time to maximum concentration (Tmax),and AUC were conducted.
The propofol package insert recommends that elderly debilitated patients receive an induction dose of 20mg every 10 seconds or 1 to 1.5 mg/kg and a maintenance infusion dose of 50 to 100 mcg/kg/min [5]. Using the genotype-stratified model parameters shown in Table 1 and referencing the Schüttler & Ihmsenmulticenter (n=270) propofol parameters, dosing simulations were conducted [18]. The graphical results are illustrated in Figure 10 and the pharmacokinetic parameters are shown in Table 2. Based on the dosing simulation findings, if no dosage adjustments are made for the elderly CYP2B6 AA & GG genotypes, a greater than 250% increase in blood propofol exposure will occur in these patients. Therefore, at least a 50% decrease in infusion dose will be required relative to the lowest package insert (currently 50 mg/kg/min) recommendation for the elderly CYP2B6 AA & AG genotype patients.
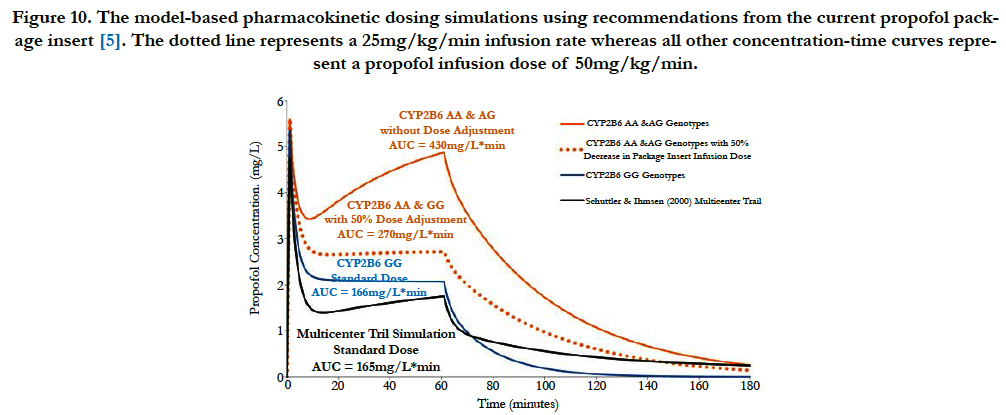
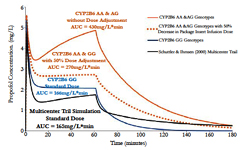
Figure 10. The model-based pharmacokinetic dosing simulations using recommendations from the current propofol package insert [5]. The dotted line represents a 25mg/kg/min infusion rate whereas all other concentration-time curves represent a propofol infusion dose of 50mg/kg/min.
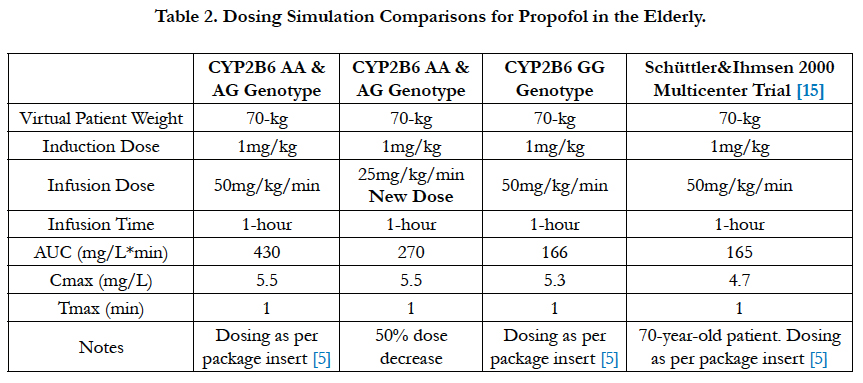
Table 2. Dosing Simulation Comparisons for Propofol in the Elderly.
Discussion
The hypothesis that nonparametric pharmacometric modeling would quantify the effects of the CYP2B6 A785G genotype variants on the propofol elimination rate in an elderly patient population tested true. This analysis found that patients with CYP2B6 A/A and A/G alleles cleared propofol at a rate of CLAA AG=9.1mL/kg/min while patients with the G/G allele cleared propofol at a rate of CLGG=24.2mL/kg/min. The apparent propofol clearance rate for the CYP2B6 GG genotypes were consistent with the drug manufacturer’s reports of 23 to 50 mL/ kg/min found within the package insert, for adults [5]. However, based on the modeling and simulation, if a dosage adjustment is not made, the CYP2B6 AA & AG patients will be exposed o approximately 250% higher blood propofol levels in a short 1-hour infusion. Therefore, since the maintenance infusion dose is dependent on the clearance rate, the precision guided dose adjustments for the CYP2B6 AA & AG genotypes require a 50% decrease in infusion dose to 25mg/kg/min, as stated and shown in the results.
In the original study, propofol concentration-time data were analyzed using parametric pharmacokinetics, which assumes the estimated model parameters are normally distributed for the given population [10]. However, it is well-established that non-normally distributed populations of under-represented polymorphic alleles are analyzed using non-parametric statistics. In nonparametric statistics no assumptions are made about the underlying distribution of the population modeling parameters under test [19]. Thus, these results provide insight that nonparametric pharmacometric modeling software may be preferred when attempting to identify subgroups and population outliers during the process of drug discovery and quantitative pharmacology.
The clinical realities of dosing propofol in the elderly without consideration for the CYP2B6 genotype are reported in a case report published by Yonekura and colleagues in December 2016 [20]. In this case, the author attributes the CYP2B6 and UGT1A9 genotypes as being the causal factor for a 71-year-old patient experiencing 3-hours of delayed emergence from anesthesia [20]. In a retrospective analysis of 17,540 patients, with 4033 being over the age of 65 years, patients over 70 years of age experienced a dose-dependent increases in hypotension [21]. Further, a study by Mikstacki and colleagues recently reported that the CYP2B6 gene and patients’ body mass index were associated with propofol metabolic rates and optimizing of propofol anesthesia [22].
Overall, it is important to note that the potential clinical impact of CYP2B6 A785G (rs2279343) gene variants guiding propofol infusion dosing, in the elderly, may be quite beneficial due to reported allele frequencies of the CYP2B6 AA and AG genotypes of: 16.7% in African-Americans, 9.3% in Asians, 4.0 to 32.6% in Caucasians, 14.3% in Hispanics, and 9.3% in Japanese persons [23, 24]. So, in accordance with the national Precision Medicine Initiative, the results from this study provide support to clinicians and researchers who use preemptive genotyping to help avoid excessively high blood propofol levels in geriatric patients during surgery and procedures requiring propofol for sedation [25, 26].
Conclusion
This study has shown that nonparametric pharmacometric modeling, by not assuming a normal parametric distribution when estimating population pharmacokinetic parameters, effectively allows data from the individual patients to create useful parameter distributions. Clinically, the CYP2B6 AA and AG patient genotypes are estimated to require a 25mg/kg/min infusion dose during the maintenance of general anesthesia, whereas the CYP2B6 GG genotypes do not require a dosage adjustment outside of the propofol package insert under geriatric dosing recommendations. These findings provide insight into the pharmacogenomics of propofol anesthesia and should be further confirmed.
Acknowledgement
Research reported in this publication was supported by National Institute of General Medical Sciences of the National Institutes of Health under award number T32 GM008685. I would like to thank Dr. B. Eugene for help with this manuscript. Further, I would also like to also thank Professor Hiroshi Yamazaki for communication regarding the original study.
References
- Court MH, Duan SX, Hesse LM, Venkatakrishnan K, Greenblatt DJ (2001) Cytochrome P-450 2B6 is responsible for interindividual variability of propofol hydroxylation by human liver microsomes. Anesthesiology. 94(1): 110–9.
- Mano Y, Usui T, Kamimura H (2007) Substrate-dependent modulation of UDP-glucuronosyltransferase 1A1 (UGT1A1) by propofol in recombinant human UGT1A1 and human liver microsomes. Basic Clin Pharmacol Toxicol. 101(3): 211–4.
- Takahashi H, Maruo Y, Mori A, Iwai M, Sato H, et al., (2008) Effect of D256N and Y483D on propofol glucuronidation by human uridine 5′-diphosphate glucuronosyltransferase (UGT1A9). Basic Clin Pharmacol Toxicol. 103(2): 131–6.
- Lian Q-Q, Pan P-P, Li J-W, Lin H, Hu G-X, et al., (2015) Impact of CYP2C9 polymorphism found in the Chinese population on the metabolism of propofol in vitro. Biol Pharm Bull. 38(4): 531–5.
- U.S. National Library of Medicine (2014) DIPRIVAN- propofol injection, emulsion: Human Prescription Drug Label. DailyMed, Fresenius Kabi USA, LLC.
- Zanger UM, Klein K (2013) Pharmacogenetics of cytochrome P450 2B6 (CYP2B6): Advances on polymorphisms, mechanisms, and clinical relevance. Front Genet. 4: 24.
- U.S. Food and Drug Administration. Table of Pharmacogenomic Biomarkers in Drug Labeling. Cent Drug Eval Res, 2016.
- Loryan I, Lindqvist M, Johansson I, Hiratsuka M, Van Der Heiden I, et al., (2012) Influence of sex on propofol metabolism, a pilot study: Implications for propofol anesthesia. Eur J Clin Pharmacol. 68(4): 397–406.
- Choong E, Loryan I, Lindqvist M, Nordling Å, El Bouazzaoui S, et al., (2013) Sex difference in formation of propofol metabolites: A replication study. Basic Clin Pharmacol Toxicol. 113(2): 126–31.
- Kansaku F, Kumai T, Sasaki K, Yokozuka M, Shimizu M, et al., (2011) Individual Differences in Pharmacokinetics and Pharmacodynamics of Anesthetic Agent Propofol with Regard to CYP2B6 and UGT1A9 Genotype and Patient Age. Drug Metab Pharmacokinet. 26(5): 532–7.
- Mastrogianni O, Gbandi E, Orphanidis A, Raikos N, Goutziomitrou E, et al., (2014) Association of the CYP2B6 c.516G>T polymorphism with high blood propofol concentrations in women from northern Greece. Drug Metab Pharmacokinet. 29(2): 215–8.
- Kobayashi Y, Yokozuka M, Miyakawa H, Watanabe M, Kumai T, et al., (2015) Effects of Genetic Polymorphism of CYP2B6 and UGT1A9 and Sex Differences on Pharmacokinetics of Propofol. J St Marian Univ. 6(2):183–93.
- Mourão AL, de Abreu FG, Fiegenbaum M (2015) Impact of the Cytochrome P450 2B6 (CYP2B6) Gene Polymorphism c.516G>T (rs3745274) on Propofol Dose Variability. Eur J Drug Metab. Pharmacokinet. 41(5): 511–5.
- Mould DR, Upton RN (2012) Basic Concepts in Population Modeling, Simulation, and Model-Based Drug Development. CPT Pharmacometrics Syst Pharmacol. 1(9): e6.
- Neely MN, van Guilder MG, Yamada WM, Schumitzky A, Jelliffe RW (2012) Accurate Detection of Outliers and Subpopulations With Pmetrics, a Nonparametric and Parametric Pharmacometric Modeling and Simulation Package for R. Ther Drug Monit. 34(4): 467–76.
- Team R. R Development Core Team. R A Lang Environ Stat Comput, 2013.
- GNU Fortran Project. GFortran - the GNU Fortran compiler, part of GCC, Jan 2016.
- Schüttler J, Ihmsen H (2000) Population pharmacokinetics of propofol: a multicenter study. Anesthesiology. 92(3): 727–38.
- Hettmansperger TP, McKean JW (2011) Robust nonparametric statistical methods. (2nd Edn), CRC Press, US.
- Yonekura H, Murayama N, Yamazaki H, Sobue K (2016) A Case of Delayed Emergence After Propofol Anesthesia: Genetic Anallysis. A A Case Reports. 7(11): 243–6.
- Phillips AT, Deiner S, Mo Lin H, Andreopoulos E, Silverstein J, et al., (2015) Propofol Use in the Elderly Population: Prevalence of Overdose and Association with 30-Day Mortality. Clin. Ther. 37(12): 2676–85.
- Mikstacki A, Zakerska-Banaszak O, Skrzypczak-Zielinska M, Tamowicz B, Prendecki M, et al., (2016) The effect of UGT1A9, CYP2B6 and CYP2C9 genes polymorphism on individual differences in propofol pharmacokinetics among Polish patients undergoing general anaesthesia. J Appl Genet. 1–8.
- Deeken JF, Figg WD, Bates SE, Sparreboom A (2007) Toward individualized treatment: prediction of anticancer drug disposition and toxicity with pharmacogenetics. Anticancer. Drugs. 18(2): 111–26.
- Hiratsuka M, Takekuma Y, Endo N, Narahara K, Hamdy SI, et al., (2002) Allele and genotype frequencies of CYP2B6 and CYP3A5 in the Japanese population. Eur J Clin Pharmacol. 58(6): 417–21.
- Collins FS, Varmus H (2015) A New Initiative on Precision Medicine. N Engl J Med. 372: 793–5.
- The White House Fact sheet: President Obama’s Precision Medicine initiative, 2016.


