Utilization of 1,2-Naphthoquine-4-Sulfonate (NQS) for Development and Validation of Stability indicating HPLC method for the Simultaneous Analysis of Amlodipine, Hydrochlorothiazide and Valsartan in Pharmaceutical Formulation
Mohammed Osman RA, Elbashir AA*
University of Khartoum, Faculty of Science, Chemistry Department, Khartoum, Sudan.
*Corresponding Author
Abdalla Ahmed Elbashir,
University of Khartoum, Faculty of Science,
Chemistry Department, Khartoum, Sudan.
E-mail: aaelbashir6@gmail.com
Received: October 11, 2019; Accepted: November 11, 2019; Published: November 14, 2019
Citation: Mohammed Osman RA, Elbashir AA. Utilization of 1,2-Naphthoquine-4-Sulfonate (NQS) for Development and Validation of Stability indicating HPLC method for the Simultaneous Analysis of Amlodipine, Hydrochlorothiazide and Valsartan in Pharmaceutical Formulation. Int J Bioanal Methods Bioequival Stud. 2019;5(1):82-92. doi: dx.doi.org/10.19070/2470-4490-1900010
Copyright: Elbashir AA© 2019. This is an open-access article distributed under the terms of the Creative Commons Attribution License, which permits unrestricted use, distribution and reproduction in any medium, provided the original author and source are credited.
Abstract
A simple, specific, accurate and precise, stability indicating HPLC method for the simultaneous determination of antihypertensive drug combination consisting of amlodipine (AML), hydrochlorothiazide (HCT) and valsartan (VAL) was developed and validated. The proposed method is based on the derivatization of drugs with 1,2-naphthoquinone-4-sulfonic (NQS). The optimized conditions for the separation of the three analytes was consisted of ODS C-18 (150 mm × 4.6 mm i.d. 5 μm) column, mobile phase: acetonitrile-potassium dihydrogen phosphate pH 3.5- acetonitrile (45:55 % v/v). Column temperature was maintained at 40°C; Flow rate: 1.5 mL/min; detection: 460 nm; and injection of 20μL. The precision of the method was shown through adequate repeatability or intraday precision (RSD ≤ 2) and interday precision (RSD ≤ 2). The method demonstrated adequate linearity of detector response over the range (2 - 30) μg/mL for AML, (2.5 - 30) μg/ mL for HCT and (32 - 224).
μg /mL for VAL. The limits of detection for AML, HCT and VAL were 0.02, 0.02 and 0.01 μg/mL, while the limits of quantification were 0.05, 0.07 and 0.04 μg/mL respectively. The method also showed adequate robustness to variations in mobile phase, pH, and column temperature, reaction time and reagent concentrations. The full recoveries of each working standard for all compounds were within ICH specifications of 98-101% which showed that the method was accurate. The proposed method proved to be stability indicating by resolution of the analytes from their accelerated storage conditions products. The developed method is rapid (run time 5 min), selective, requires simple sample preparation procedures and simple mobile phase combinations. It is also cost effective and represents a good procedure for determination of AML, HCT and VAL with NQS in bulk raw materials and pharmaceutical dosage forms.
2.Introduction
3.Experimental
3.1 Materials
3.2 Methods
3.3 Preparation of Standard and Sample Solutions
4.Results and Discussion
4.1 Chromatographic Conditions Optimization
4.2 Absorption Spectra
4.3 Optimization of Derivatization Reaction and Spectrophotometric Procedure
4.4 Stability of the Drugs - NQS Derivative
4.5 Stoichiometry of Derivatization Reaction
4.6 Validation of the Method
4.1 Application of the Proposed Method to Analysis of AML, HCT and VAL in Tablets
4.8 Reaction Mechanism
5.Conclusion
6.Acknowledgements
7.References
Keywords
ELISA; Chitosan; Biopolymer; Polysaccharides; Lectin; Citrobacter.
Introduction
Amlodipine/valsartan/hydrochlorothiazide (HCTZ) is a marketed dose combined of the well established antihypertensive agents amlodipine (AML) (a calcium channel antagonist), valsartan (VAL) (an angiotensin II receptor antagonist), and HCTZ (a thiazide diuretic) in patients with moderate or severe hypertension. The US Food and Drug Administration (FDA) and the European Medicines Agency have approved a triple fixed-dose combination of AML, HCT and VAL. The triple combination dose was found to be more effective in reducing blood pressure and providing overall blood pressure control than the dual combination therapies regardless of age, race, gender, ethnicity, or hypertension severity [1, 2].
Amlodipine besylate (AML) is chemically described as 3-Ethyl-5-methyl (±)-2-[(2-aminoethoxy) methyl]-4-(2-chlorophenyl)-l, 4-dihydro-6-methyl-3, 5- pyridinedicarboxylate, monobenzenesulphonate (Figure 1.B). AML tablets are formulated as white tablets equivalent to 2.5, 5, and 10 mg of AML for oral administration. AML is formulated as the besylate salt of AML, a longacting calcium channel blocker [3].
Hydrochlorothiazide (HCT) is chemically known as 6-chloro-1,1- dioxo-3, 4-dihydro-2H-1, 2, 4-benzothiadiazine-7-sulfonamide, (Figure 1.A) [4-6].
Valsartan is chemically described as N-valeryl-N[[2-(1H-tetrazol-5- yl)biphenyl-4- yl] methyl] valine. Valsartan is available as a white, microcrystalline powder with a melting range of 105- 110°C. It is freely soluble in methanol, ethanol sparingly soluble in ethyl acetate, slightly soluble in dichloromethane and practically insoluble in water. VAL is available as tablets for oral administration, containing 40, 80, 160 or 320 mg of the drug Figure (1).
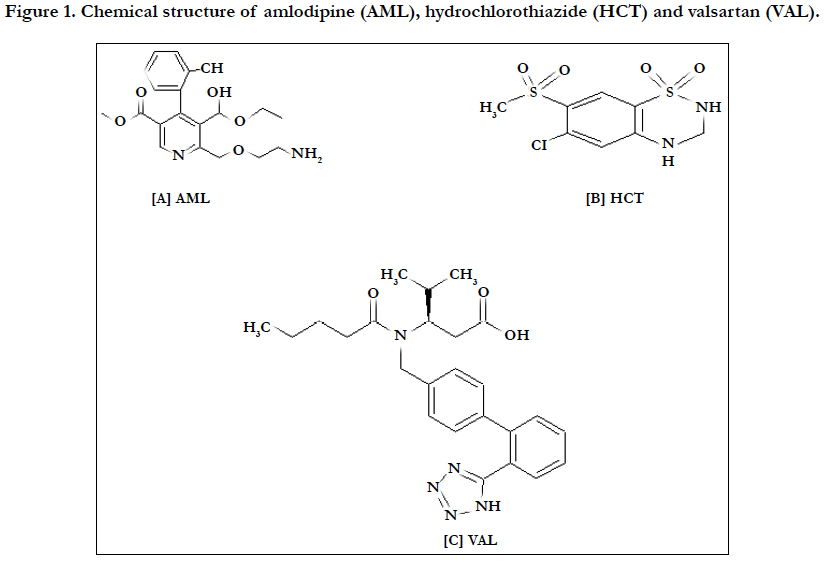
Figure 1. Chemical structure of amlodipine (AML), hydrochlorothiazide (HCT) and valsartan (VAL).
A number of methods have been reported in the literature for estimation of AML, HCT and VAL individually or in combination with other drugs. However, very few analytical methods were reported for the simultaneous analysis of these drugs in a combined dosage formulation [6, 7]. UV-spectrophotometric [8-10], spectrofluorimetric [11] HPLC [12-22], HPTLC [23, 24], capillary electrophoresis [25-28] and electrochemical [29] methods were reported. In drug development stability indicating testing is considered as an important part of the process. The purpose of stability testing is to provide evidence on how the quality of a drug substance or drug product varies with time under the influence of a variety of environmental factors, such as temperature, humidity, and light, and enables recommendation of storage conditions, retest periods, and shelf lives to be established. The two main aspects of a drug product that play an important role in shelf life determination are assay of the active drug and degradation products generated during the stability study. The drug product in a stability test sample needs to be determined using a stability indicating method, as recommended by the International Conference on Harmonization (ICH) guidelines [30] and U.S. Pharmacopia (USP) [31]. Although stability indicating methods have been reported for assay of various drugs in drug products, most of them describe assay procedures for drug products containing only one active drug substance. Only few stability indicating methods are reported for assay of combination drug products containing two or more active drug substances.
1, 2-naphthoquinone-4-sulphonic sulphonate (NQS) has been utilized as a chromogenic reagent for the spectrophotometric determination of many pharmaceutical amines [32, 33], It is very popular spectrophotometric reagent due to its efficient reactivity with both primary and secondary amines, and high reaction rate [34-40], NQS has be proved to be a useful and sensitive analytical derivatizing agent for spectrophotometric and HPLC analysis of pharmaceuticals bearing a primary or secondary amino group. The applications of NQS for determination of pharmaceutical bearing amine group have been reviewed by Elbashir et al., [36]. The uses of (NQS) for HPLC determination of three drugs under study have not been reported yet. Therefore, in this work a rapid HPLC method for determination the content of AML, HCT, and VAL in pharmaceutical formulations which is based on the reaction of NQS with amino group of AML, HCT, and VAL molecules to form orange to brown compounds, at 465 nm, 456 nm and 462 nm for AML, HCT, and VAL, respectively.
AML, HCT and VAL working standards were given as gift from Azal pharmaceutical industries company Ltd, (Khartoum, Sudan). Acetonitrile HPLC grade, Methanol HPLC grade, potassium dihydrogen orthophosphate AR was purchased from scharlau chemical (spain). High purity deionised water was obtained from BASH pharmaceutical (Khartoum, Sudan) purification, system Sodium 1, 2-naphthoquinone-4sulphonate (NQS) (Sigma Aldrich Chemical Co, St. Louis, USA).
Chromatographic separation was carried out using high performance liquid chromatography having C18, ODS (150mm×4.6mm), 5.0 μm analytical column with photodiode array detector provided by Auto sampler and the Chromatographic data were recorded by LC Solution software. Absorbance was carried out by using UV-visible spectrophotometer model Shimadzu 1800 with quartz cells of 1 cm optical path length, pH meter was used for pH measurements, analytical balance and ultrasonic bath.
For HPLC a number of preliminary trials were conducted with combinations of different organic solvents, compositions, and flow rate to check the retention time, shape, resolution, and other chromatographic parameters. Among all tried experiments, the mobile phase combination is Potassium dihydrogen orthophosphate AR (0.05 M) in water: acetonitrile (45:55 %v/v) adjust to pH 3.5. The solution was degassed in an ultrasonic water bath for 5 minutes and filtered through 0.45 μm nylon filter. The instrumental settings flow rate of 1.5 mL/min; the column temperature is 40°C, and detector wavelength is 460 nm found to be most suitable.
An accurately 20, 20 and 25 mg of AML, HCT and VAL standards were dissolved in a mixture of equal volume of methanol and distilled water, transferred into 100 ml volumetric flask, diluted with same solvent and mixed well.
The standard solutions were prepared by dilution of the stock standard solution with diluent to reach a concentration range (2 - 30) μg/mL for AML, (2.5 - 30) μg/mL for HCT and (32 - 224) μg/mL for VAL. Triplicate 20 μL injections were made for each concentration and chromatographed under the conditions described above. The peak area of each concentration was plotted against the corresponding concentration to obtain the calibration graph and regression equation was computed.
(NQS) 0.6% (w/v) was prepared by dissolving 0.6 g in mixture of equal volume of methanol and distilled water, transferred into a 100 mL volumetric flask and diluted to the mark with same solvent and mixed well. The solution was freshly prepared and protected from light during use.
Buffer solution of pH 13.0 was prepared by mix solution of 0.2M potassium dihydrogen phosphate and 0.2 M sodium hydroxide adjusted to pH 13.0 with 0.2 M sodium hydroxide.
Ten Exforge HCT_ tablets were weighed and their mean was determined. After grinding the tablets into a fine powder in glass mortar, an accurately weighed quantity of the tablet powder equivalent 5 mg AML, 12.5 mg HCT and 160 mg VAL the solution were dissolved by sonication in a mixture of equal volume of methanol and distilled water into a 100 mL volumetric flask, diluted to the mark with the same solvent (50 μg/mL, 125 μg/mL and 1600 μg/mL).
A 1.0 mL of standard stock of three drugs and sample were transferred into 10mL volumetric flask; 3.5 mL of 0.7% (NQS) was added and followed by 2.0mL buffer solution pH 13.0. The reaction was completed to volume with mixture of equal volume of methanol and distilled water, After 10 min, a suitable volume of solution was sampled and filtered through 0.45 μm membrane filter paper. The solution was determined by HPLC conditions developed herein.
The samples were kept in the stability chamber (Thermaolab) set at accelerated storage conditions [41] of 40 ± 2°C and 75 ± 5% relative humidity and in real storage conditions of 25 C° ± 2°C and 60% relative humidity. The samples were periodically monitored by the HPLC analysis. Analyses were carried out at time 0 and after storage of 1, 2, and 3 months in the stability chamber by the recommended procedures.
The chromatographic conditions were optimized so as to achieve the best resolution and peak shape for amlodipine, Hydrochlorothiazide, and valsartan. Different mobile phases containing acetonitrile in phosphate buffer were examined. With acetonitrile content 45% or less, the retention time for valsartan was far (retention time >10 min) and the resolution between the amlodipine and Hydrochlorothiazide less than 1.5, with decreasing of acetonitrile more than 40% the retention time of valsartan too far up to 12 min eluted. On the other hand to give short time increased the acetonitrile to 60%, the retention time for valsartan was short (retention time < 3.5 min) but the resolution between the amlodipine and Hydrochlorothiazide less than 2.0, moreover phosphate buffers of pH 3.0 - 7.0 were tried but the peak shapes for the drugs were sufficiently symmetrical only for pH value below 4 and the resolution warmed over. Therefore, the mobile phase containing acetonitrile and phosphate buffer at pH 3.5 (55:45, v/v) was selected as optimal for obtaining well defined and resolved peaks with mean retention times of 1.8 , 2.3 and 3.6 min, for HCT, AML and VAL, respectively, as shown in Figures 2, 3, 4, 5, 6 and 7.
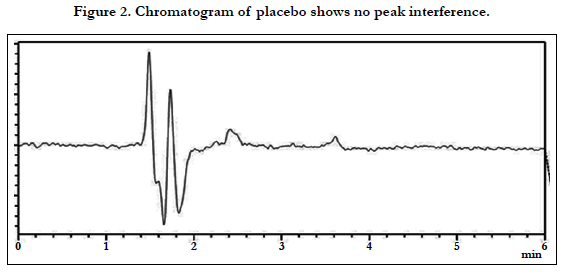
Figure 2. Chromatogram of placebo shows no peak interference.
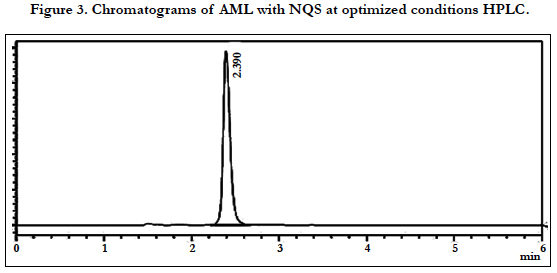
Figure 3. Chromatograms of AML with NQS at optimized conditions HPLC.
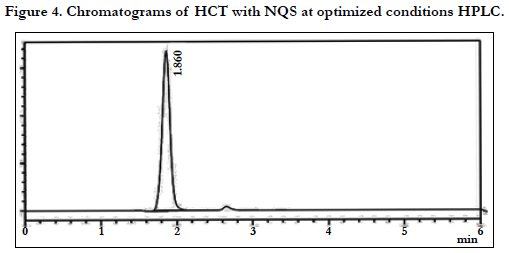
Figure 4. Chromatograms of HCT with NQS at optimized conditions HPLC.
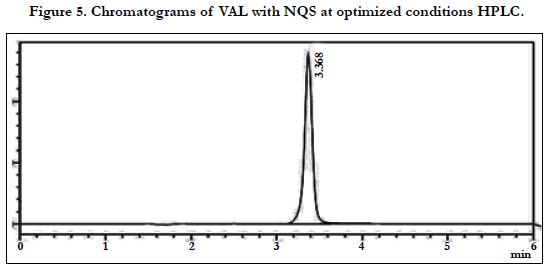
Figure 5. Chromatograms of VAL with NQS at optimized conditions HPLC.
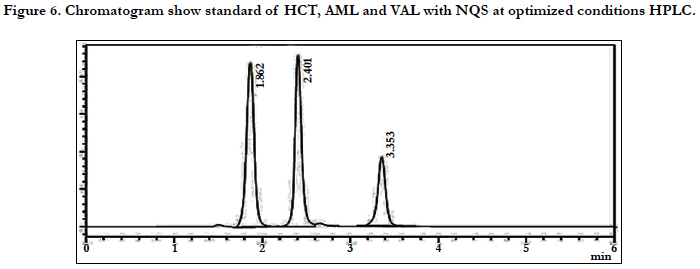
Figure 6. Chromatogram show standard of HCT, AML and VAL with NQS at optimized conditions HPLC.
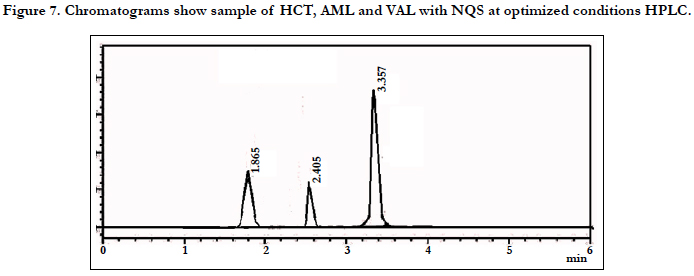
Figure 7. Chromatograms show sample of HCT, AML and VAL with NQS at optimized conditions HPLC.
The absorptions spectrum of three drugs (AML,HCT and VAL) were recorded against mixture of equal volume of methanol and distilled water; it were found that exhibits a maximum a absorption peak (λmax) for three drugs AML,HCT and VAL at 230, 270 and 250 nm respectively and the λmax of NQS was 362 nm . The reaction between three drugs and NQS were performed, and the absorption spectrums of the product were recorded against reagent blank. It was found that the product is orange to brown colored exhibiting for three drugs (AML, HCT and VAL) λmax at 465 nm, 456 nm and 462 nm respectively.
The effects of pH on the reaction of AML, HCT and VAL with NQS were examined by varying the pH from 4.0 to 13.5, The results revealed that AML, HCT and VAL have difficulty to react with NQS in acidic media (Figure 8). This was possibly due to the existence of the amino group of AML, HCT and VAL in the form of hydrochloride salt, thus it loses its nucleophilic substitution capability. As the pH increased, the absorbance increased rapidly, as the amino group of AML, HCT and VAL (in the hydrochloride salt) turns into the free amino group, thus facilitating the nucleophilic substitution. The maximum readings were attained at pH values of 13.0 for AML, HCT and VAL. At pH values more than 13.4 for AML, HCT and VAL a decrease in the readings occurred. This was attributed probably to the increase in the amount of hydroxide ion that holds back the reaction of AML, HCT and VAL with NQS.
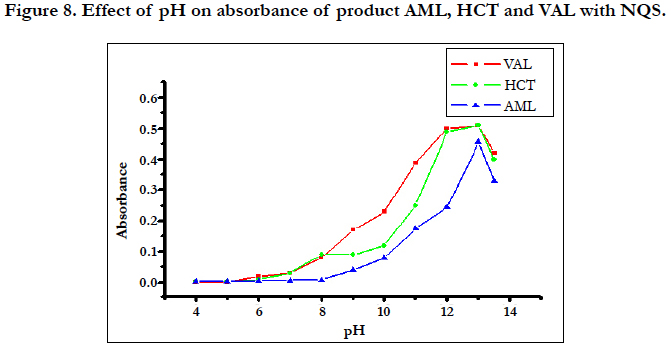
Figure 8. Effect of pH on absorbance of product AML, HCT and VAL with NQS.
The studying of (NQS) concentrations showed that the reaction was dependent on NQS reagent. The highest absorption was obtained when the concentration of NQS was 0.5% for AML and 0.6% for HCT and VAL. From the previously described experiments the optimum conditions for the reaction of (NQS) with AML, HCT and VAL were summarized in Figure 9.
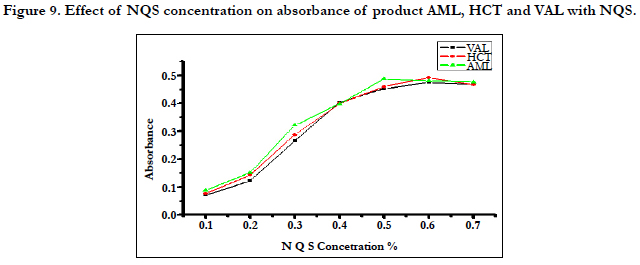
Figure 9. Effect of NQS concentration on absorbance of product AML, HCT and VAL with NQS.
To determine the optimum time that is required for completion the reaction. The reaction was allowed to proceed at room temperature for varying periods of time. It was found that the reaction goes to almost completion within 5 min for AML and HCT (data not shown) and 8 min for VAL, however for higher precision readings, the reaction was allowed to proceed for quite longer time; reactions in all the subsequent experiments were carried out for 10 min.
The effect of amount of buffer solution on the absorbance of reaction product was also investigated. It was shown that the absorbance of the reaction product increases rapidly with the rise of amount of buffer solution, and becomes maximal when the amount of buffer solution is 2.0 mL. Therefore; the amount of 2.0 mL buffer solution was selected to ensure the highest absorbance.
The effect of time on the stability of the drugs - NQS derivative were studied by following the absorption intensity of the reaction solution (after dilution) at different time intervals. It was found that the area of the derivative remains constant for at least 3 h. This allowed the processing of large batches of samples and their comfortable measurements with convenience. This gives the high throughput property to the proposed method when applied for analysis of large number of samples in quality control laboratories.
Under the optimum conditions the stoichiometry of the reactions between AML, HCT and VAL with NQS were investigated by Job’s method and were found to be 1:1, Figure 10. While three drugs molecules contain primary and secondary amino group. Based on this ratio, the reaction pathway was postulated to be proceeded as shown in Scheme 1.
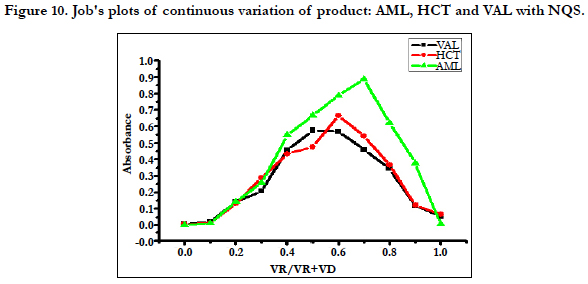
Figure 10. Job's plots of continuous variation of product: AML, HCT and VAL with NQS.
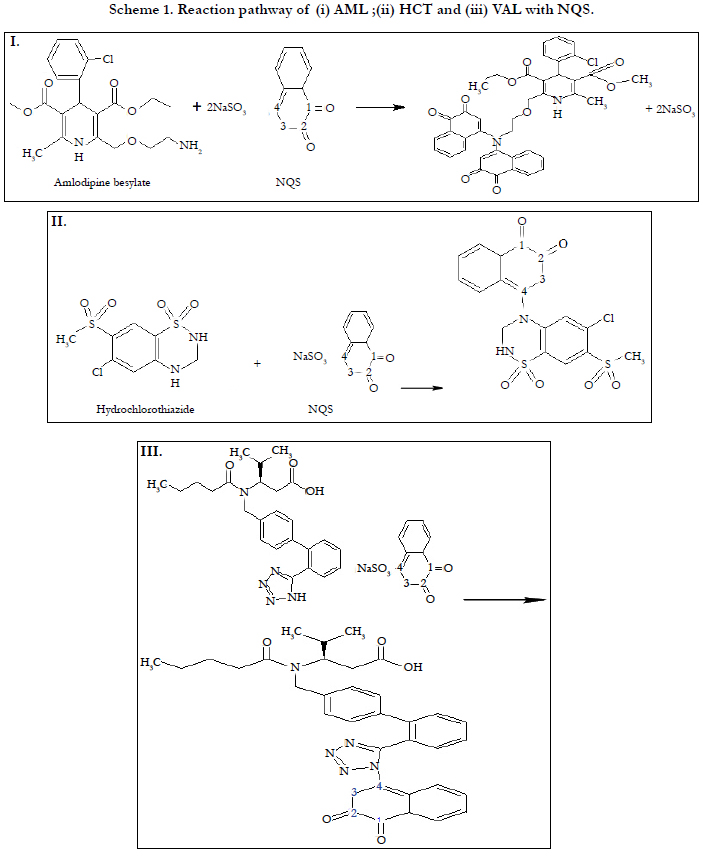
Scheme 1. Reaction pathway of (i) AML ;(ii) HCT and (iii) VAL with NQS.
The method was validated according ICH guidelines on the validation of analytical methods [42] and complied with USP 40 validation guidelines [43]. The characteristics that are studied during method validation include sensitivity, accuracy, precision, specificity, linearity of detector response, range of analyte concentration and robustness.
The specificity of the assay method was investigated by the injection of the extracted placebo and mobile phase to demonstrate the absence of interference with the elution of analyte. The injected of placebo and mobile phase found that no of interference between AML, HCT and VAL and mobile phase. Also the injection of AML, HCT and VAL have shown no interference and the method should be specificity, Figure 2.
The linearity of the proposed HPLC method was evaluated by analyzing a series of different concentrations for each of the three analytes. The linear regression equations were generated by least squares treatment of the calibration data. Under the optimized conditions described above, the measured peak areas were found to be proportional to concentrations of the analytes. Table 1 presents the performance data and statistical parameters including linear regression equations, concentration ranges, and correlation coefficients. The data obtained from the linearity determination experiments was subjected to linear regression analysis. The linearity equations were y = 207903.2x + 9523.5, R2 = 0.9996 for AML, y = 139253.3x + 5078.9, R2 = 0.9999 for HCT and y = 245552.2x - 43200, R2 = 0.9999 for VAL. Correlation coefficient R2 values were in all cases greater than 0.999 indicating a strong correlation between the concentrations of the analytes and the peak areas and therefore the method could be applied in the assay of all or any of the three analyte compounds. A summary of the linearity analysis results obtained is shown in Table 1. The ICH guidelines recommend that for the establishment of linearity a minimum of five concentrations be utilized over the range of 80 to 120 % [40, 41]. This method was found to be linear over the range tested for all the three compounds.
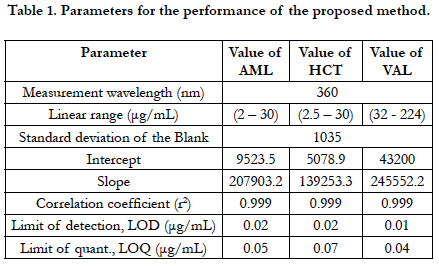

Table 1. Parameters for the performance of the proposed method.
The accuracy of an analytical method is the closeness of the test results obtained by that procedure to a true known value. The accuracy of the proposed method was carried out by applying three different concentrations 50%, 100% and 150% of three drugs within linear range calculated as the percentage of the drug recovered from the samples, Table 2 shows the recoveries of all compounds were within the specified guidelines (ICH) [44, 45].
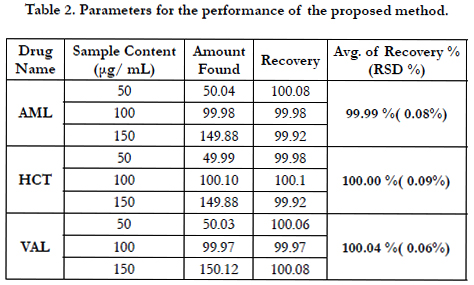
Table 2. Parameters for the performance of the proposed method.
The robustness of an analytical procedure is a measure of its capacity to remain unaffected by small but deliberate variations in method parameters and provides an indication of its reliability during normal usage [40]. The proposed method, one parameter was changed whereas the others were kept unchanged, and the recovery percentage was calculated each time, Table 3. On the other hand the chromatographic condition variations were investigated by pH in mobile phase, mobile phase composition, column, temperature and flow rate are considered. Robustness of the method was determined from the degree of variation observed in peak areas and retention times from the same working standard solution analyzed while adjusting each of the liquid chromatographic factors indicated. Six replicate injections of the same working standard solution were run after having adjusted a single chromatographic parameter and coefficient of variation of peak areas of component peaks calculated. The degree of variation observed was then used to infer the method’s robustness, Table 4.
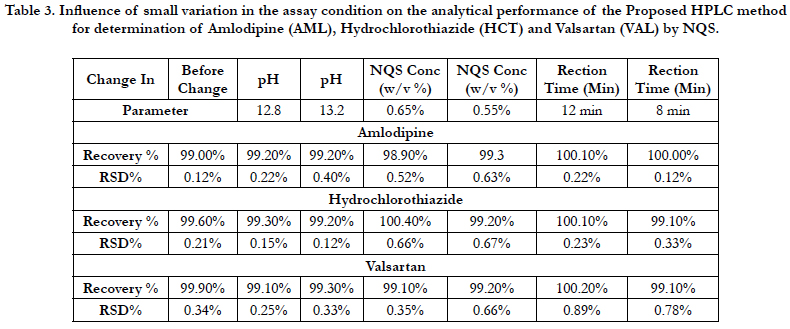
Table 3. Influence of small variation in the assay condition on the analytical performance of the Proposed HPLC method for determination of Amlodipine (AML), Hydrochlorothiazide (HCT) and Valsartan (VAL) by NQS.
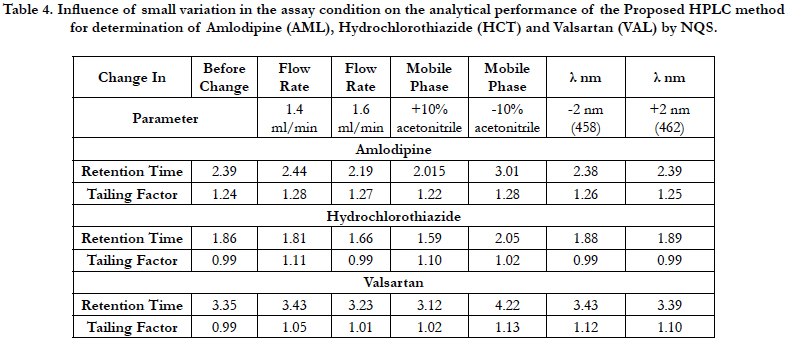
Table 4. Influence of small variation in the assay condition on the analytical performance of the Proposed HPLC method for determination of Amlodipine (AML), Hydrochlorothiazide (HCT) and Valsartan (VAL) by NQS.
The precision of an analytical procedure as the closeness of agreement (degree of scatter) between a series of measurements obtained from multiple sampling of the same homogeneous sample under the prescribed conditions. The intra-assay precision of the proposed method was determined on samples of drug solutions at 100% concentration level by analyzing 3 replicates of each sample as a batch in a single assay run. The interassay precision was determined by analyzing the same samples as duplicates in three consecutive days. The relative standard deviations (RSD) did not exceed 0.70% , Table 5 proving the high precision of the proposed method for the routine application in the analysis of three drugs in quality control laboratories.
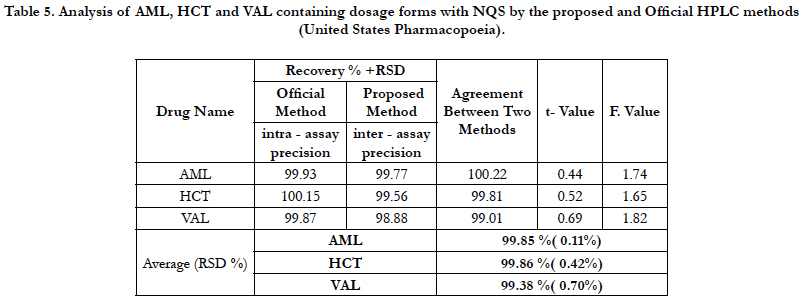
Table 5. Analysis of AML, HCT and VAL containing dosage forms with NQS by the proposed and Official HPLC methods (United States Pharmacopoeia).
The stability test results in terms of the average content of AML, HCT, and VAL per tablet, in percentage with respect to the labeled amount, are presented in Table 6. The quantity of AML, HCT, and VAL remained fairly constant in accelerated and real storage until the end of the stability study period (3 months). The stability results suggest that No significant degradation was observed and the relative standard deviation between the result of time initial and after 1, 2, and 3 months in the stability chamber.
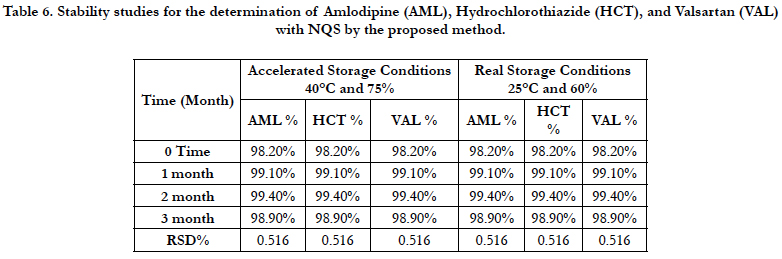
Table 6. Stability studies for the determination of Amlodipine (AML), Hydrochlorothiazide (HCT), and Valsartan (VAL) with NQS by the proposed method.
The validity of the proposed method was ascertained by the statistical comparison of the results obtained by a official HPLC method (United States pharmacopeia) with the proposed method by applying Student’s t-test for accuracy and F-test for precision in some commercial formulations. The results were compared with those of the reported method. Statistical analysis of the results using the Student’s t- and F-tests revealed no significant difference between the reported method at the 95% confidence level with respect to accuracy and precision Table 5.
It has been reported that NQS could react with amino group of primary and secondary amine derivative .Similarly, amino group of AML, HCT and VAL taking on nucleophilicity due to the lone electron pair of nitrogen atoms, trends to attack on the electron deficient center in NQS, namely no. 4 carbon atom (3, 4 C-C can bond conjugate with 2-C O, as a result 4-C of NQS becomes electron lacking center). At the same time, it has been proved that the composition of Product is 1:1 of all three drugs with NQS. The reactions equations are shown in Scheme 1.
Conclusion
The present study described the evaluation of (NQS) and as analytical reagent in the development of simple, sensitive, and accurate HPLC methods, for the determination of amlodipine (AML), hydrochlorothiazide (HCT) and valsartan (VAL) in pharmaceutical formulations. The proposed method has comparable analytical performances and devoid from any potential interference. This gives the advantage of flexibility in performing the analysis on any available instrument. Therefore, this method can be recommended for the routine analysis of amlodipine (AML), hydrochlorothiazide (HCT) and valsartan (VAL) in quality control laboratories.
Acknowledgement
The authors expressed their sincere thanks to Azal pharmaceutical industries company Ltd, (Khartoum, Sudan) and Bash Pharma pharmaceutical industries company Ltd, (Khartoum, Sudan) for kindly supplying the samples and equipments used in the this study.
References
- Calhoun DA, Lacourcière Y, Chiang YT, Glazer RD. Triple antihypertensive therapy with amlodipine, valsartan, and hydrochlorothiazide: a randomized clinical trial. Hypertension. 2009 Jul;54(1):32-9. PubMed PMID: 19470877.
- Chrysant SG. Single-pill triple-combination therapy: an alternative to multiple-drug treatment of hypertension. Postgrad Med. 2011 Nov;123(6):21-31. PubMed PMID: 22104451.
- J.E.F. Reynolds, MARTINDALE. The Extra Pharmacopoeia; A publication of Pharmaceutical Press, 6th edition. 1(2009) 1214-1420.
- Nikam MB, Dhamane H, Aligave A, Kondawar MS. Simultaneous estimation of valsartan, amlodipine besylate and hydrochlorothiazide by first order derivative UV Spectrophotometric method. Int J Pharm Technol. 2010;2(3):642-50.
- United States Pharmacopoeia United States Pharmacopeial Convention, Twin Brook Parkway, Rockville, USA. pp. 2288-3447.
- British Pharmacopoeia Commission, General Medical Council, Great Britain. Medicines Commission. British pharmacopoeia. Her Majesty's Stationery Office; 2001. 116-860p.
- Varghese SJ, Ravi TK. Quantitative simultaneous determination of amlodipine, valsartan, and hydrochlorothiazide in “Exforge HCT” tablets using high-performance liquid chromatography and high-performance thin-layer chromatography. Journal of Liquid Chromatography & Related Technologies. 2011 Jul 15;34(12):981-94.
- Anandakumar K, Jayamariappan M. Absorption correction method for the simultaneous estimation of amlodipine besylate, valsartan and hydrochlorothiazide in bulk and in combined tablet dosage form. Int J Pharm Pharm Sci. 2011;3(1):23-7.
- Lakshmi KS, Lakshmi S. “Simultaneous Spectrophotometric Determination of Valsartan and Hydro-chlorothiazide by H-Point Standard Addition Method and Partial Least Squares Regression,” Acta Pharm. 2011;61(1):37-50. Doi:10.2478/v10007-011-0007-5. PubMed PMID: 21406342.
- S. Tatar and S. Saglik, “Comparison of UV- and Second Derivative-Spectrophotometric and LC Methods for the Determination of Valsartan in Pharmaceutical Formula-tion,” J Pharm Biomed Anal. 2002 Sep 5;30(2):371-5. Doi:10.1016/S0731-7085(02)00360-6. PubMed PMID: 12191724.
- R. Shaalan and T. S. Belal, “Simultaneous Spectrofluorimetric Determination of Amlodipine Besylate and Valsartan in Their Combined Tablets,” Drug Test Anal. 2010 Oct;2(10):489-93. doi:10.1002/dta.160. PubMed PMID: 20872895.
- E. Satana, S. Altinay, N. G. Goger, S. A. Ozkan and Z. Senturk, “Simultaneous Determination of Valsartan and Hydrochlorothiazide in Tablets by First- Derivative Ultra-violet Spectrophotometry and LC,” J Pharm Biomed Anal. 2001 Jul;25(5-6):1009-13. doi:10.1016/S0731-7085(01)00394-6. PubMed PMID: 11377086.
- S.B. Wankhede, K.C. Raka, S.B. Wadkar and S.S. Chitlange, “Spectrophotometric and HPLC Methods for Simultaneous Estimation of Amlodipine Besilate, Losar-tan Potassium and Hydrochlorothiazide in Tablets,” Indian J Pharm Sci. 2010 Jan;72(1):136-40. doi:10.4103/0250-474X.62239. PubMed PMID: 20582208.
- D. Kul, B. Dogan-Topal, T. Kutucu, B. Uslu and S.A. Ozkan, “High-Performance Liquid Chromatographic and First Derivative of the Ratio Spectrophotometric Deter-mination of Amlodipine and Valsartan in Their Binary Mixtures,” J AOAC Int. 2010;93(3):882-90. PubMed PMID: 20629391.
- A. V. Ramani, P. Sengupta and R. Mullangi, “Development and Validation of a Highly Sensitive and Robust LC-ESI-MS/MS Method for Simultaneous Quantitation of Simvastatin Acid, Amlodipine and Valsartan in Human Plasma: Application to a Clinical Pharmacokinetic Study,” Biomed Chromatogr. 2009 Jun;23(6):615-22. 10.1002/bmc.1161. PubMed PMID: 19277959.
- I.A. Alsarra, “High-Performance Liquid Chromatographic Method for Quantitative Determination of Amlodip-ine in Human Plasma and Pharmaceutical Dosage Form and Its Application to Pharmacokinetic Studies,” J Chromatogr Sci. 2009 Nov-Dec;47(10):863-7. PubMed PMID: 19930795.
- Shah DA, Bhatt KK, Mehta RS, Baldania SL, Gandhi TR. “Stability Indicating RP-HPLC Estimation of Atorvastatin Calcium and Amlodipine Besylate in Pharmaceutical Formulations,” Indian J Pharm Sci. 2008 Nov;70(6):754-60. 10.4103/0250-474X.49117. PubMed PMID: 21369436.
- H. Li, Y. Wang, Y. Jiang, Y. Tang, J. Wang, L. Zhao and J. Gu, “A liquid Chromatography/Tandem Mass Spec-trometry Method for the Simultaneous Quantification of Valsartan and Hydrochlorothiazide in Human Plasma,” J Chromatogr B Analyt Technol Biomed Life Sci. 2007 Jun 1;852(1-2):436-42. 10.1016/j.jchromb.2007.02.014. PubMed PMID: 17331816.
- G. Iriarte, N. Ferreiros, I. Ibarrondo, R. M. Alonso, M. I. Maguregi, L. Gonzalez and R. M. Jimenez, “Optimization via Experimental Design of an SPEHPLC-UV-Fluo-rescence Method for the Determination of Valsartan and Its Metabolite in Human Plasma Samples,” J Sep Sci. 2006 Oct;29(15):2265-83. 10.1002/jssc.200600093. PubMed PMID: 17120810.
- D. F. Tian, X. L. Tian, T. Tian, Z. Y. Wang and F. K. Mo, “Simultaneous Determination of Valsartan and Hydro-chlorothiazide in Tablets by RPHPLC,” Indian J Pharm Sci. 2008 May-Jun;70(3):372-4. 10.4103/0250-474X.43006. PubMed PMID: 20046750.
- Chitlange SS, Bagri K, Sakarkar DM. Stability Indicating RP-HPLC Method for Simultaneous Estimation of Valsartan and Amlodipine in Capsule Formulation. Asian Journal of Research in Chemistry. 2008;1(1):15-8.
- G. Iriarte, O. Gonzalez, N. Ferreiros, M. I. Maguregui, R. M. Alonso and R. M. Jimenez, “ Validation of a fast liquid chromatography-UV method for the analysis of drugs used in combined cardiovascular therapy in human plasma” J Chromatogr B Analyt Technol Biomed Life Sci. 2009 Oct 1;877(27):3045-53. 10.1016/ j.jchromb.2009.07.018. PubMed PMID:19660995.
- N.J. Shah, B. N. Suhagia, R. R. Shah and N. M. Patel, “HPTLC Method for the Simultaneous Estimation of Valsartan and Hydrochlorothiazide in Tablet Dosage Form,” Indian J Pharm Sci. 2009 Jan-Feb; 71(1): 72–74. 10.4103/0250-474X.51967.
- S.N. Meyyanathan and B. Suresh, “HPTLC Method for the Simultaneous Determination of Amlodipine and Benazepril in Their Formulations,” J Chromatogr Sci. 2005 Feb;43(2):73-5. PubMed PMID: 15826364.
- A. O. Alnajjar, “Validation of a capillary electrophoresis method for the simultaneous determination of amlodipine besylate and valsartan in pharmaceuticals and human plasma” J AOAC Int. 2011 Mar-Apr;94(2):498-502. PubMed PMID: 21563683.
- S. Hillaert and W. Van den Bossche, “ Simultaneous determination of hydrochlorothiazide and several angiotensin-II-receptor antagonists by capillary electrophoresis” J Pharm Biomed Anal. 2003;31(2):329-39. 10.1016/S0731-7085(02)00643-X. PubMed PMID: 12609672.
- S. Hillaert and W. Van den Bossche, “ Optimization and validation of a capillary zone electrophoretic method for the analysis of several angiotensin-II-receptor antagonists” J Chromatogr A. 2002;979(1-2):323-33. 10.1016/S0021-9673(02)01247-5. PubMed PMID: 12498264.
- L. Gonzalez, U. Akesolo, R. M. Jimenez and R. M. Alonso, “Application of Capillary Zone Electrophoresis to the Screening of Some Angiotensin II Receptor An-tagonists,” Electrophoresis. 2002 Jan;23(2):223-9. PubMed PMID: 11840527.
- A. A. Gazy, “Determination of Amlodipine Besylate by Adsorptive Square- Wave Anodic Stripping Voltammetry on Glassy Carbon Electrode in Tablets and Biological Fluid,” Talanta. 2004;62(3):575-82. 10.1016/j.talanta.2003.08.025. PubMed PMID: 18969333.
- ICH, Q2B, Harmonised tripartite guideline, Validation of analytical procedure: Methodology, International conference on harmonization, Geneva, Switzerland, March 1996.
- Rockville M. The United States Pharmacopoeia 30, the National Formulary 25 US Pharmacopeial Convention. Electronic version. 2007. p2287- 2288, 3102.
- H. Y. Wang, L. X. Xu, Y. Xiao and J. Han, Spectrochimica Acta Part A, 60, 2004, 2933.
- Ahmed SM, Elbashir AA, Aboul-Enein HY. New spectrophotometric method for determination of cephalosporins in pharmaceutical formulations. Arabian Journal of Chemistry. 2015 Mar 1;8(2):233-9.
- Darwish IA. Kinetic spectrophotometric methods for determination of trimetazidine dihydrochloride. Analytica Chimica Acta. 2005 Oct 17;551(1-2):222-31.
- Ebraheem SA, Elbashir AA, Aboul-Enein HY. Spectrophotometric methods for the determination of gemifloxacin in pharmaceutical formulations. Acta Pharmaceutica Sinica B. 2011 Dec 1;1(4):248-53.
- Elbashir AA, Ahmed AA, Ali Ahmed SM, Aboul-Enein HY. 1, 2-Naphthoquinone- 4-sulphonic acid sodium salt (NQS) as an analytical reagent for the determination of pharmaceutical amine by spectrophotometry. Applied Spectroscopy Reviews. 2012 Apr 1;47(3):219-32.
- Elbashir AA, Elwagee AH. Spectrophotometric determination of pyrimethamine (PYM) in pharmaceutical formulation using 1, 2-naphthoquinone-4-sulfonate (NQS). Journal of the Association of Arab Universities for Basic and Applied Sciences. 2012 Apr 1;11(1):32-6.
- Hasani M, Yaghoubi L, Abdollahi H., A kinetic spectrophotometric method for simultaneous determination of glycine and lysine by artificial neural networks. Anal Biochem. 2007 Jun 1;365(1):74-81. PubMed PMID: 17374354.
- Li Q, Zhang H. A novel spectrophotometric method for the determination of aminophylline in pharmaceutical samples in the presence of methanol. Spectrochim Acta A Mol Biomol Spectrosc. 2008 Jul;70(2):284-9. PubMed PMID: 17875399.
- Li QM, Yang ZJ. Spectrophotometric determination of aminomethylbenzoic acid using sodium 1,2-naphthoquinone-4-sulfonate as the chemical derivative chromogenic reagent. Spectrochim Acta A Mol Biomol Spectrosc. 2007;66(3):656-61. PubMed PMID: 17110157.
- G. Altiokka, D. Dogrukol-Ak, M. Tuncel, H. Y. Aboul-Enein, “Determination of Amlodipine in Pharma-ceutical Formulations by Differential-Pulse Voltammetry with a Glassy Carbon Electrode,” Arch Pharm (Weinheim). 2002;335(2-3):104-8. PubMed PMID: 12043455.
- ICH I. Q2 (R1): Validation of analytical procedures: text and methodology. International Conference on Harmonization, Geneva.2005. Available from: https://www.ema.europa.eu/en/documents/scientific-guideline/ich-q-2-r1-validation-analytical-procedures-text-methodology-step-5_en.pdf
- American Pharmaceutical Association. USP, 31 and NF 26. Washington, DC, 2008.
- ICH Expert Working Group. Stability testing of new drug substances and products Q1A (R2). InInternational Conference on Harmonization of Technical Requirements for Registration of Pharmaceuticals for Human Use. February 2003 . 1-24. Available from: https://database.ich.org/sites/default/files/Q1A_R2_Guideline.pdf.
- United States Pharmacopeial Convention. The United States Pharmacopeia; The National Formulary. Rockville, Maryland, 2008.


