Validated HPLC Method for the Determination of Fenofibric Acid in Rat Plasma and its Application to a Comparative Pharmacokinetic Study of Prodrugs JWU102 and Fenofibrate
Kim TK1*, Jung OH1
College of Science and Engineering, Jungwon University, 85 Munmu-ro, Geosan-gun, Chungbuk, South Korea.
*Corresponding Author
Tae Kon Kim,
College of Science and Engineering,
Jungwon University, 85 Munmu-ro,Geosan-gun,
Chungbuk 367-700, South Korea.
Tel: +82-43-830-8619
Fax: +82-43-830-8579
E-mail: tkkim@jwu.ac.kr
Article Type :Research Article
Received: August 24, 2015; Accepted: September 18, 2015; Published: September 24, 2015
Citation: Kim TK, Jung OH (2015) Validated HPLC Method for the Determination of Fenofibric Acid in Rat Plasma and its Application to a Comparative Pharmacokinetic Study of Prodrugs JWU102 and Fenofibrate. Int J Bioanal Methods Bioequival Stud, 2(3), 41-46. doi: dx.doi.org/10.19070/2470-4490-150005
Copyright: Kim TK© 2015. This is an open-access article distributed under the terms of the Creative Commons Attribution License, which permits unrestricted use, distribution and reproduction in any medium, provided the original author and source are credited.
Abstract
In this study, a sensitive and reliable method for the quantitation of fenofibric acid in rat plasma was developed and validated using high performance liquid chromatography (HPLC). The plasma samples were prepared by deproteinization, and sildenafil was used as an internal standard. Chromatographic separation was achieved using a reversed-phase (C18) column. The mobile phase, 0.02 M ammonium acetate buffer: acetonitrile (35:65, v/v), was run at a flow rate of 1.0 mL/min, and the column eluent was monitored using an ultraviolet detector at 280 nm at room temperature. The retention times of sildenafil (an internal standard), and fenofibric acid were approximately 5.9 and 7.7 min, respectively. The quantitation limit of fenofibric acid in rat plasma was 0.03 μg/mL. Pharmacokinetic parameters of fenofibric acid was evaluated after oral (at doses of 20 mg/kg) administration of JWU102 and fenofibrate in rats. The relative bioavailability of JWU102 was approximately 272.8% compared to fenofibrate.
2.Introduction
3.Materials and Methods
3.1.Materials
3.2.Animal Experiments
3.3.Preparation of calibration standards and quality control samples
3.4.Preparation of plasma samples
3.5.HPLC analysis
3.6.Analytical method validation
3.7.Pharmacokinetic and statistical analysis
4.Results and Discussion
4.1.Development and validation of the HPLC method
4.2.Comparative pharmacokinetics of JWU102 and fenofibrate after oral administration to rats
5.Conclusion
7.Acknowledgements
8.References
Keywords
JWU102; Fenofibric Acid; HPLC; Bioavailability; Rats.
Introduction
Cardiovascular disease (CVD) and coronary heart disease (CHD) are leading causes of death in worldwide. Risk factors for CHD include elevated low-density lipoprotein cholesterol (LDL-C), elevated triglycerides, and decreased concentrations of high-density lipoprotein cholesterol (HDL-C) [1]. Due to the overwhelming evidence generated from outcome trials, statins remain the primary method for lowering LDL-C and reducing the incidence of cardiovascular events in these patients [2]. Although statin therapy plays an important role in improving the lipid profile of patients, approximately 10% to 22% of individuals in clinical studies experience muscle pain during statin therapy [3]. Mixed dyslipidemia characterized by low levels of HDL-C and high levels of triglycerides and LDL-C is highly prevalent in the general population, particularly in obese patients with metabolic syndrome [4]. If a patient at high risk has high triglycerides or low HDL-C, consideration can be given to combining a fibrate or nicotinic acid with an LDL-C lowering drug.
Fenofibrate acts by stimulating the activity of peroxisome proliferator- activated receptor-α (PPAR-α), a member of the PPAR subfamily of nuclear receptors that modulate the transcription of genes that regulate fatty acid and cholesterol metabolism [5]. Fenofibrate (Figure 1B), a prodrug, is pharmacologically inactive and undergoes rapid hydrolysis at the ester bond to form the active metabolite fenofibric acid (Figure 1C) [6]. However, fenofibrate is a neutral, lipophilic compound that is practically insoluble in water, making it challenging to consistently achieve therapeutic levels [7]. Thus, several different formulations of fenofibrate have been developed in an attempt to increase its overall solubility since its introduction in the United States.
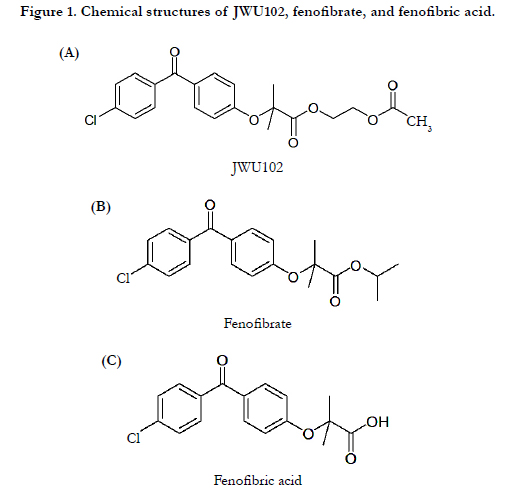
Figure 1. Chemical structures of JWU102, fenofibrate, and fenofibric acid.
The purpose of this study was to develop and validate a sensitive and reliable high-performance liquid chromatographic (HPLC) method of fenofibric acid. Based on the developed method, we determined the pharmacokinetic properties of fenofibric acid after oral administration of JWU102 and fenofibrate at a dose of 20 mg/kg to rats to evaluate the relative bioavailability of JWU102 in rats.
Materials and Methods
JWU102, fenofibrate, and fenofibric acid were supplied from Jungwon university (Chungbuk, South Korea). Sildenafil, an internal standard (IS) for the high-performance liquid chromatographic (HPLC) analysis was purchased from Sigma–Aldrich Corporation (St. Louis, MO). Acetonitrile and methanol were products from Burdick & Jackson (Muskegon, MI, USA). Polyethylene glycol 400 (PEG 400) was a product from Showa Chemical Company (Tokyo, Japan). Other chemicals were of reagent grade or HPLC grade.
Male Sprague–Dawley rats, 6–8 week old and weighing 220–300 g, were purchased from the Samtako Bio Korea (Osan, South Korea). Rats were maintained in a Clean room at a temperature of between 23±2°C with 12-h light (07:00–19:00) and dark (19:00–07:00) cycles, and a relative humidity of 55%±5%. Rats were housed in metabolic cages (Tecniplast, Varese, Italy) under filtered pathogen-free air and with food (Sam Yang Company, Pyeongtaek, South Korea) and water available ad libitum. The rats were fasted overnight before drug administration and for 4 hr after dosing. JWU102 was dissolved in PEG400: distilled water=1:1 (v/v) to make a concentration of 5 mg/mL. The rats were placed in a restrainer and were orally administered a dose of 20 mg/kg. Blood was collected in a heparinized tube at the pre-dose stage, and at 0.25, 0.5, 1, 2, 4, 6, 8, 10, and 12 h after oral administration. Plasma was harvested after centrifugation at 3,000 rpm and 4°C for 10 min and stored frozen at -70°C until it was analyzed.
Stock solutions of fenofibric acid (1 mg/mL) were prepared in methanol. Appropriate dilutions of the stock solutions of fenofibric acid were made with methanol (0.003, 0.005, 0.01, 0.02, 0.05, 0.1, 0.2, 0.5, or 1 mg/mL). Standard solutions of fenofibric acid in rat plasma were prepared by spiking with an appropriate volume (10 μL/mL of plasma) of the diluted stock solutions, giving final concentrations of 0.03, 0.05, 0.1, 0.2, 0.5, 1, 2, 5, or 10 μg/mL for plasma. The IS working solution was prepared by dissolving sildenafil in acetonitrile to give a final concentration of 10 μg/mL.
A 50 μL aliquot of sample was deproteinized with a 75 μL of acetonitrile containing 1 μg/mL sildenafil (an IS). After vortexmixing and centrifugation at 3,000 rpm for 10 min, the supernatant was transferred into a vial and a 20 μL aliquot was injected directly onto the HPLC column.
The HPLC system consisted of a Gilson-234 autosampler (Gilson, Middleton, WI, USA), a Gilson 307 pump (Gilson), a CapcellPACK (C18) column (250 mm×4.6 mm, i.d.; particle size, 5 μm; Shiseido, Tokyo, Japan), a model UV-118 UV/VIS detector (Gilson), and a model Gilson unipoint system software (Gilson). The mobile phase, 0.02 M ammonium acetate buffer:acetonitrile (35:65, v/v), was run at a flow rate of 1.0 mL/min, and the column eluent was monitored using an ultraviolet detector at 280 nm at room temperature. The retention times of IS and fenofibric acid were approximately 5.9 and 7.7 min, respectively.
The analytical method was validated with regards to its specificity, linearity, intra- and interday precision and accuracy, matrix effect, and stability according to the US Food and Drug Administration’s “Guidance for Industry, Bioanalytical Method Validation, 2001 [8]”
The total area under the plasma concentration-time curve to the last time (AUClast), the maximum plasma concentration (Cmax), the time to reach Cmax (Tmax), and the half-life (T1/2) were estimated using noncompartmental calculations carried out within Win- Nonlin™ 5.2 (Pharsight, Sunnyvale, CA, USA). All data are expressed as the mean ± standard deviation (SD). The statistical significance of the differences between the 2 groups was analyzed using Student’s t-tests carried out within SPSS (IBM, Yorktown Heights, NY, USA). A p value of <0.05 was considered statistically significant.
Results and Discussion
Representative chromatograms of the deproteinized drug-free rat plasma, drug standards in rat plasma spiked with 0.03 μg/ mL (LLOQ) of fenofibric acid and 6 μg/mL of IS, and plasma collected 1 hr after oral administration of 20 mg/kg of fenofibrate to a male Sprague–Dawley rat were shown in Figure. 2 (A), (B), and (C), respectively. No interferences from endogenous substances were observed in the blank rat plasma samples. The retention times of IS and fenofibric acid were 5.9 and 7.7 min,respectively. The analytical method used was linear over the range of 0.03–10 μg/mL, with correlation coefficients (r values) greater than 0.9997. The lower limit of quantitation was 0.03 μg/mL with relative standard deviation (RSD) values less than 20% and relative errors within ± 20%. Intra- and inter-day accuracies (as relative error values) ranged between 1.0% and 11.5% and intra- and inter-day precision (as RSDs) were 3.0–10.1% for all QC (quality control) samples, with the result that they all met the criteria for bioanalysis method validation (Table 1).
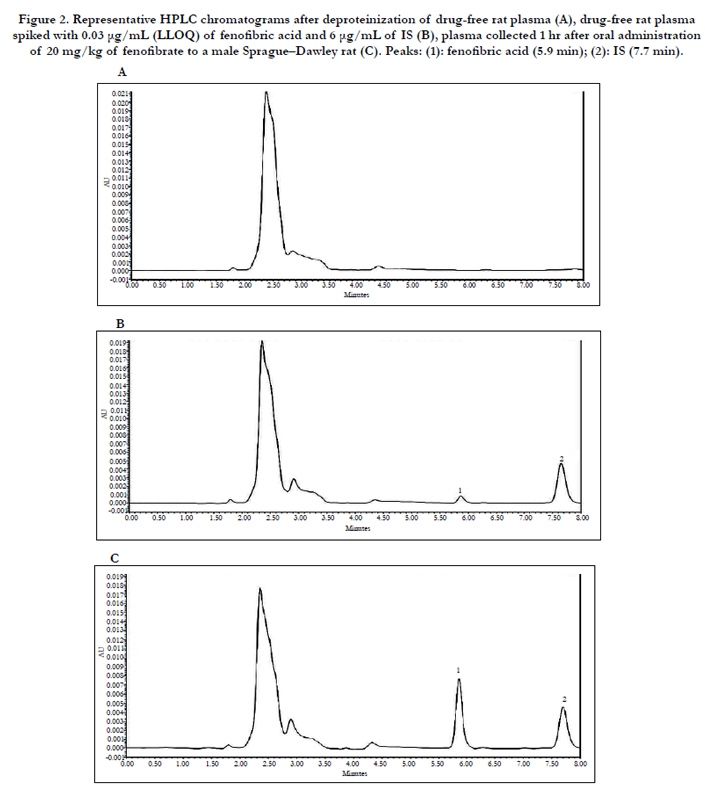
Figure 2. Representative HPLC chromatograms after deproteinization of drug-free rat plasma (A), drug-free rat plasma spiked with 0.03 μg/mL (LLOQ) of fenofibric acid and 6 μg/mL of IS (B), plasma collected 1 hr after oral administration of 20 mg/kg of fenofibrate to a male Sprague–Dawley rat (C). Peaks: (1): fenofibric acid (5.9 min); (2): IS (7.7 min).
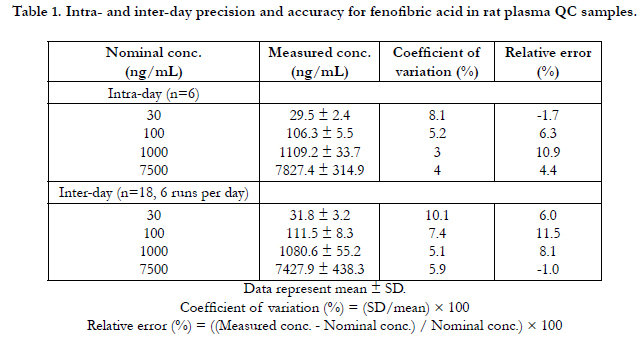

Table 1. Intra- and inter-day precision and accuracy for fenofibric acid in rat plasma QC samples.
The matrix effect, recovery, and process efficiency values for fenofibric acid and IS in rat plasma are provided in Table 2. The recovery was, on average, more than 90% for both compounds. Fenofibric acid was found to be stable under various conditions, whether in the plasma or in the stock solution, and the detailed stability data are presented in Table 3. In summary, the HPLC method developed in the current study was found to be suitable for the quantitation of fenofibric acid in rat plasma with acceptable specificity, linearity, accuracy, precision, and stability. On the basis of this HPLC method, fenofibric acid concentrations in rat plasma were determined and pharmacokinetic parameters were calculated.
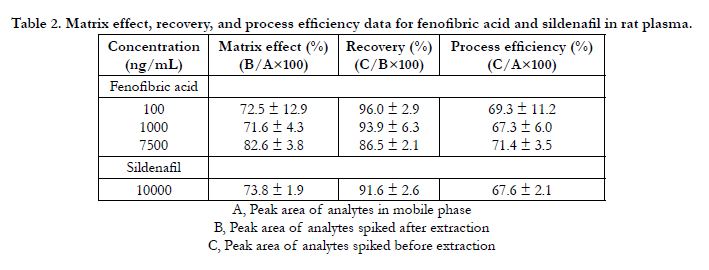
Table 2. Matrix effect, recovery, and process efficiency data for fenofibric acid and sildenafil in rat plasma.

Table 3. Stability of fenofibric acid in rat plasma and stock solutions (n=3).
Plasma samples were collected after the oral administration of JWU102 and fenofibrate and the concentrations of fenofibric acid were determined using the validated HPLC method. Figure. 3 shows the mean plasma concentration-time curves for fenofibric acid after the oral administration of JWU102 and fenofibrate in rats; the pharmacokinetic parameters are presented in Table 4. After oral administration of JWU102, absorption of fenofibric acid from the rat portal vein was slow and the plasma concentrations of fenofibric acid declined in delay-released manners with a Tmax and a half-life of 6.0 hr and 7.9 hr, respectively. The estimated total body clearance was 33.0 mL/min/kg which was considerably smaller than the reported cardiac output of 295 mL/min/kg based on blood data [9] in rats. This suggests that the first-pass effect of JWU102 in the lung and heart could be almost negligible in rats.
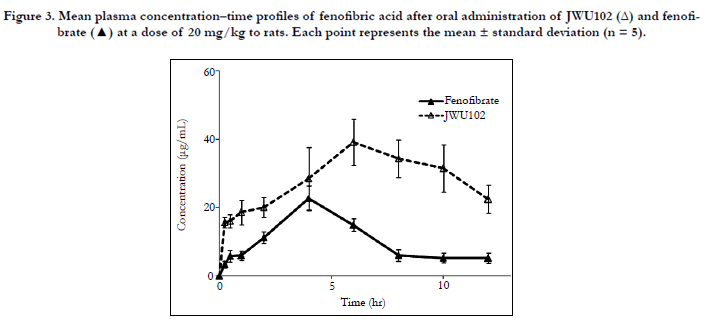
Figure 3. Mean plasma concentration–time profiles of fenofibric acid after oral administration of JWU102 (Δ) and fenofibrate (▲) at a dose of 20 mg/kg to rats. Each point represents the mean ± standard deviation (n = 5).
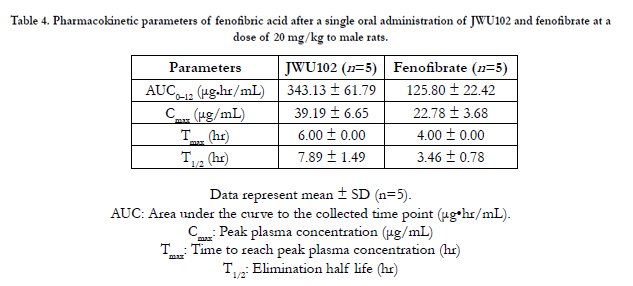
Table 4. Pharmacokinetic parameters of fenofibric acid after a single oral administration of JWU102 and fenofibrate at a dose of 20 mg/kg to male rats.
The maximum plasma concentrations of fenofibric acid were achieved 6.0 and 4.0 hr after oral administration for JWU102 and fenofibrate, respectively. The Cmax values were 39.19 ± 6.65 and 22.78 ± 3.68 μg/mL, and the AUClast values were 343.13 ± 61.79 and 125.80 ± 22.42 μg•h/mL for JWU102 and fenofibrate, respectively. The Cmax value of JWU102 was 1.7 times higher than that of fenofibrate and AUClast value of JWU102 was 2.7 times higher than fenofibrate. JWU102 appeared to have been significantly well absorbed more than fenofibrate from the gastrointestinal tract. The p-value of Cmax and AUClast between 2 groups were 0.020 and 0.005, respectively. This suggests that JWU102 was well absorbed via peptide transporter 1 from the gastrointestinal tract [10, 11]. The considerable effect of JWU102 on peptide transporter 1 is being tested based on the homogenate studies. The relative bioavailability of JWU102 was 272.8% compared to fenofibrate. This implies that the dosage of JWU102 could be smaller than fenofibrate about 2.5–3.0 folds in clinical studies.
Conclusion
The developed HPLC method was suitable for the quantification of fenofibric acid in rat plasma with acceptable specificity and linearity. Intra- and inter-day accuracies and intra- and interday precision met the criteria for bioanalysis method validation. Fenofibric acid was found to be stable under various conditions, whether in the plasma or in the stock solutions. The recovery of fenofibric acid from the processed plasma indicated that there is no significant matrix effects. According to this method, the concentrations of fenofibric acid in rat plasma were determined and pharmacokinetic parameters were calculated. The pharmacokinetic parameters of JWU102 was higher than that of fenofibrate and relative bioavailability was 272.8% compared to fenofibrate. This implies that the dosage of KB002 could be smaller than fenofibrate about 2.5–3.0 folds in clinical studies.
Acknowledgements
This work was supported by the J2H Research Grants.
References
- Rosamond W, Flegal K, Furie K, Go A, Greenlund K, et al. (2008) Heart disease and stroke statistics: a report from the American Heart Association Statistics Committee and Stroke Statistics Subcommittee. Circulation 117(4): e25-146.
- Grundy SM, Cleeman JI, Merz CN, Brewer HB, Clark LT, et al. (2004) Implications of recent clinical trials for the National Cholesterol Education Program Adult Treatment Panel III guidelines. Circulation 110(2): 227-239.
- Fernandez G, Spatz ES, Jablecki C, Phillips PS (2011) Statin myopathy: a common dilemma not reflected in clinical trials. Cleve Clin J Med 78(6): 393-403.
- Saurav A, Kaushik M, Mohiuddin SM (2012) Fenofibric acid for hyperlipidemia. Expert Opin Pharmacother 13(5): 717-722.
- Staels B, Dallongeville J, Auwerx J, Schoonjans K, Leitersdorf E, et al. (1998) Mechanism of action of fibrates on lipid and lipoprotein metabolism. Circulation. 98(19): 2088-2093.
- Adkins JC, Faulds D (1997) Micronised fenofibrate: a review of its pharmacodynamic properties and clinical efficacy in the management of dyslipidaemia. Drugs 54(4): 615-633.
- Vogt M, Kunath K, Dressman JB (2008) Dissolution enhancement of fenofibrate by micronization, cogrinding and spray-drying: comparison with commercial preparations. Eur J Pharm Biopharm 68(2): 283-288.
- www.fda.gov/downloads/Drugs/GuidanceComplianceRegulatoryInformation /Guidances/ucm070107.pdf.
- Davies B, Morris T (1993) Physiological parameters in laboratory animals and humans. Pharm Res 10(7): 1093-1095.
- Spanier B (2014) Transcriptional and functional regulation of the intestinal peptide transporter PEPT1. J Physiol 592(Pt 5): 871-879.
- Cao F, Gao Y, Wang M, Fang L, Ping Q (2013) Propylene glycol-linked amino acid/dipeptide diester prodrugs of oleanolic acid for PepT1-mediated transport: synthesis, intestinal permeability, and pharmacokinetics. Mol Pharm 10(4): 1378-1387.
- Chiou WL (1978) Critical evaluation of potential error in pharmacokinetic studies using the linear trapezoidal rule method for the calculation of the area under the plasma level–time curve. J Pharmacokinet Biopharm 6(6): 539-546.
- Choi YH, Kim SG, Lee MG (2006) Dose-independent pharmacokinetics metformin in rats: hepatic and gastrointestinal first-pass effects. J Pharm Sci 95(11): 2543-2552.
- Shim HJ, Lee EJ, Kim SH, Kim SH, You M, et al. (2000) Factors influencing the protein binding of a new phosphodiesterase V inhibitor, DA-8159, using an equilibrium dialysis technique. Biopharm Drug Dispos 21(7): 285-291.


