Microsatellite DNA Marker Based Genetic Polymorphism in Wallago attu
Muddassar Zafar M1, Abbas K1*, Basharat H2, Ahmad T1, Hussain U1
1 Aquaculture Biotechnology Laboratory, Department of Zoology, Wildlife and Fisheries, University of Agriculture, Faisalabad, Pakistan.
2 Department of Zoology, University of Sargodha (Faisalabad Campus), Faisalabad, Pakistan.
*Corresponding Author
Dr. Khalid Abbas
Department of Zoology, University of Sargodha (Faisalabad Campus),
Faisalabad-38040, Pakistan.
Email: dr.abbas@uaf.edu.pk
Received: June 22, 2016; Accepted: August 02, 2016; Published: August 05, 2016
Citation: Muddassar Zafar M, Abbas K, Basharat H, Ahmad T, Hussain U (2016) Microsatellite DNA Marker Based Genetic Polymorphism in Wallago attu. Int J Bioinform Biol Syst.1(2), 18-24.
Copyright: Abbas K© 2016. This is an open-access article distributed under the terms of the Creative Commons Attribution License, which permits unrestricted use, distribution and reproduction in any medium, provided the original author and source are credited.
Abstract
Genetic diversity and structure of six Populations of Wallago attu were studied from Jhelum River, Pakistan using five species specific microsatellites loci. Genotypic data of all the samples were generated through PCR amplification of targeted loci. A total of 23 alleles were found in 177 fish samples. All the microsatellite loci were found to be polymorphic. The mean FST value (0.0248) showed little genetic differentiation. The average observed heterozygosity values were measured in range from 0.3450 to 0.4400 whereas average expected heterozygosity ranging from 0.5363 to 0.5777 were recorded in all the population. Majority of examined loci significantly deviated (p<0.05) from Hardy Weinberg Equilibrium (HWE). Analysis of Molecular Variance (AMOVA) indicated that majority of the variation lies within the individuals (81.10%) than among the individuals with in populations (16.4%). The results showed genetic decline in this valuable fish resource. The findings of the present study will be helpful for management, conservation as well as least kinship selective breeding programs for W. attu.
2.Introduction
3.Materials and Methods
3.1.Sampling and DNA isolation
3.2.DNA Extraction
3.3.PCR amplification of microsatellite loci
3.4.Gel electrophoresis
3.5.Data analyses
4.Results
4.1.Number of Alleles (Na) and Allelic Richness (Ar)
4.2.Observed (Ho) and expected (He) heterozygosity
4.3.Population Differentiation (D)
4.4.Number of migrants (Nm)
4.5.Analysis of Molecular Variance
4.6.UPGMA dendrogram anaylsis
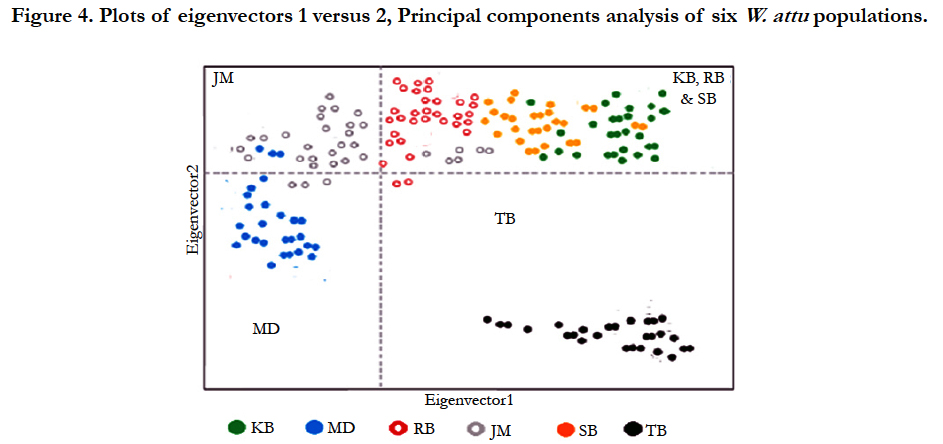
4.7.Principal components analysis (PCA)
5.Discussion
6.Acknowledgements
7.References
KeyWords
Genetic Variation; Freshwater Shark; Population Structure; Molecular Marker..
Introduction
Genetic diversity of freshwater fish has been declining due to ecological reasons and various anthropogenic activities, which result in extirpated thousands of fish species [1].
Wallago attu that usually known as freshwater shark is an important fresh-water catfish that resides in various riverine systems of South East Asia. Due to high nutritional quality of its meat and fast growth rate increase its potential as important species for aquaculture [5]. Habitat loss, over exploitation and cannibalism, are the causes of its declining in its natural distribution [14].
Population genetics is the science of how genetic variation is dispersed among species, individuals and populations. Fundamentally, it is concerned with how the distribution of genetic diversity is affected by the selection, evolutionary forces of mutation, migration and random genetic drift. The evidences to the population degree of evolutionary isolation and life histories can be provided by patterns of genetic diversity and variations among populations [14].
Microsatellites markers are Randomly repeated stretches, generally specific and conserved that are proven to be very beneficial in genetic study of animals because of their vast applications such as marker assisted selection, mapping and evaluation of genetic variation [9].
Finally, the authors would like to draw the reader’s attention before this fact that species W. attu and all of its subpopulations has been acknowledged as near threatened species (IUCN, 2014). The situation is so overwhelming; that any further declining event will deprive its integrity from the natural ecosystem. Globally, so trivial has documented and so much leftovers to be discovered about this valuable resource. No study has been reported with respect to microsatellites on this species up to now in Pakistan. The prime objective of this study is to monitor the genetic status of W. attu in Jhelum River using molecular techniques to make the strategies for effective management as well as conservation of this valuable fish resource.
Materials and Methods
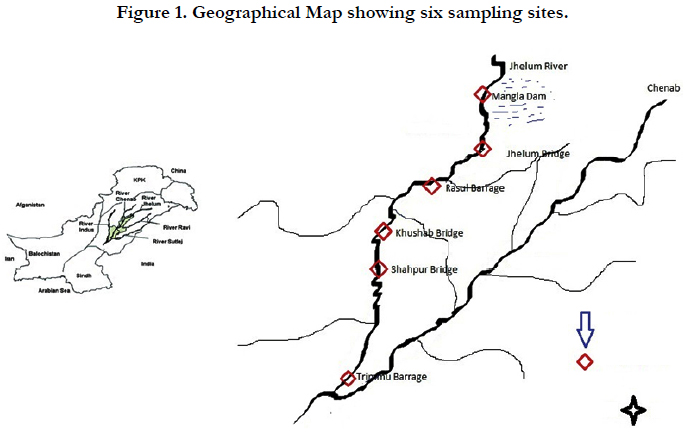
Total of 177 individuals of W. attu were collected from six different sites i.e. of Jhelum River (Figure 1) Mangla Dam (MD), Jhelum Bridge (JM), Rasul Barrage (RB), Khushab Bridge (KB), Trimmu Barrage (TB). The populations were named after the initial letters of sampling localities. Fish samples were placed in crushed ice boxes by keeping them polyethylene bags which were tagged according to sampling site for identification. Fish samples containing boxes were transported to Aquaculture Biotechnology Laboratory, Department of Zoology, Wildlife and Fisheries, University of Agriculture Faisalabad for freezing at -20°C.
Dorsal muscle tissues of freezed fish samples were used for the total genomic DNA extraction by using traditional proteinase-K digestion and phenol/chloroform isolation method of [20]. The isolated genomic DNA was confirmed through 0.8% agarose gel in TAE buffer. The DNA solutions that showed positive results were made subjected to polymerase chain reaction (PCR) for amplification.
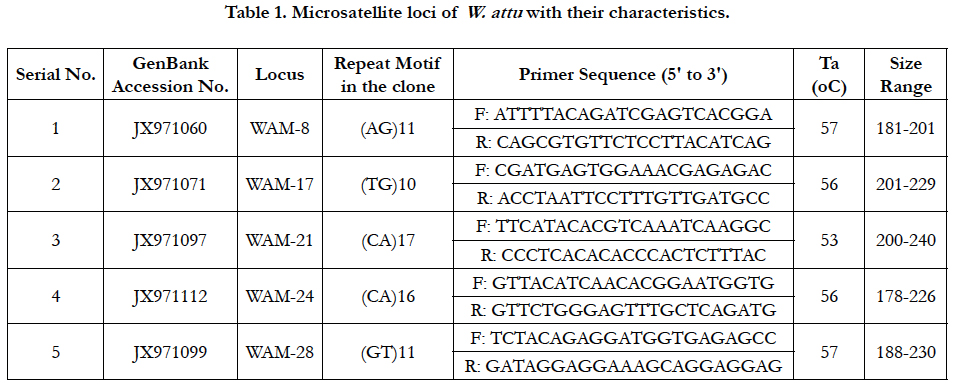
Total five species specific microsatellite loci (WAM-8, WAM-17, WAM-21, WAM-24 and WAM-28) developed by [18] were amplified through PCR (Table 1). The primers were synthesized by eoligos, Gene LinkTM, New York. The PCR amplification was carried out in 20µL reaction mixture that contained template DNA (approximately 50ng), Taq polymerase (0.4µL), dNTPs (0.4µL) , 0.4µL of each primer and reaction buffer that include tris HCl, gelatin- 0.01%, MgCl2 and KCl (2.0µL) in a thermocycler. The denaturation was carried out at 94°C for 5min, 32 cycles of 1min at 94°C and elongation for 4min at 72°C.

After amplification of microsatellite loci, 5µl of the PCR product was mixed with 1µl DNA loading dye. The mixture was loaded onto polyacrylamide gel for resolution at standard conditions. The bands in gel was be produced by silver staining and visualized in UV trans-illuminator for gel imaging. The bands were scored manually.
The genotypic data of each locus was subjected to rigorous analysis to compute allele frequency, population differentiation, heterozygosity, linkage disequilibrium, deviation from Hardy-Weinberg Equilibrium (HWE), and inbreeding coefficient (FIS). Software FSTAT Ver.2.9.3.2 [7] was used to analyze allele frequency, heterozygosity allelic richness and inbreeding coefficient by the F-statistics. The program GENEPOP 1.2. [16] was used for testing the linkage disequilibrium and deviation from HWE. The population differentiation was determined and dendrogram constructed by the TFPGA [19]. A multivariate ordination was conducted to visualize the genetic relationships among populations by Principal components analysis (PCA) carried out by EIGENANALYSIS 2.4.1. [15].
Results
Genetic variations were analyzed by determination of number of alleles (Na), allelic richness (Ar) and heterozygosity measures among populations. Expected heterozygosity and the number of alleles are usually applied as the measures of genetic diversity as described by [3].
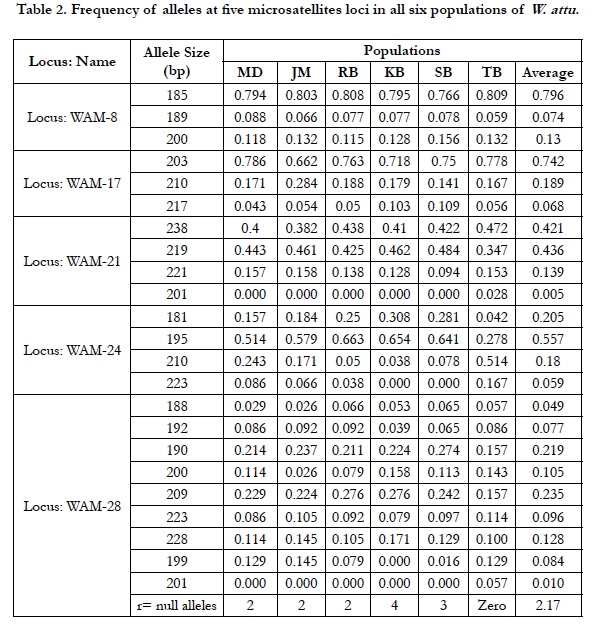
Total 23 alleles were found at five studied microsatellite loci in a total 177 samples from six W. attu populations. All microsatellite loci were found to be polymorphic with number of alleles ranged between 3 (WAM-8, WAM-17) to 9 (WAM-28) were recorded and the mean allelic richness per population were between 3.8 (KB) to 4.6 (TB), whereas mean number of allele per Population was between 3.8 (KB) to 4.8 (TB). Allele frequencies of five microsatellite loci in each of six W. attu populations could be seen in Tables 2. The difference in Ar values indicated the geographical variations among all the populations. (Table 3).
Heterozygosity (H) is the central parameter to assess the genetic diversity. The observed and expected heterozygosities for each locus were calculated for all the studied populations (Tables 3). Average expected heterozygosities (He) for each population was observed in the range between 0.5363 (RB) to 0.5777 (JM) whereas the average observed heterozygosity (Ho) was measured in range from 0.3450 (RB) and 0.4400 (MD).
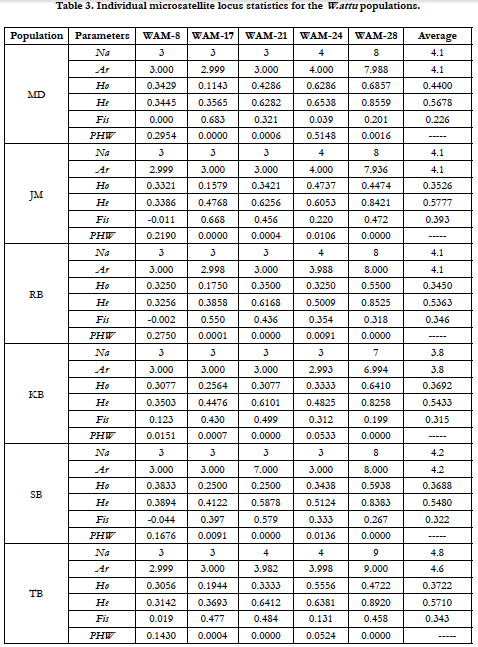
Deviation from Hardy-Weinberg Equilibrium (HWE) were noticed at all loci for all the studied populations of 30 population-locus combinations significant (p<0.01), from which 20 loci deviated statistically at p<0.05 (Table 4).
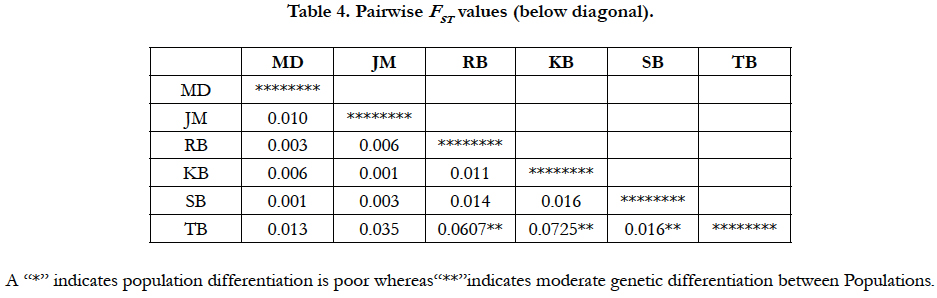
A poor genetic structure is observed in pairwise differentiation of W. attu populations. The FST estimates show low to moderate level of genetic differentiation between populations. The minimum pairwise population differentiation was observed between population JM and KB i.e. 0.0013. The highest pairwise FST value 0.0725 was observed between KB and TB that revealed population pair is moderately differentiated, mild to moderate level of population differentiation was found between rest of the populations pair which shows that the all the populations are genetically distinct from each other (Table 5).
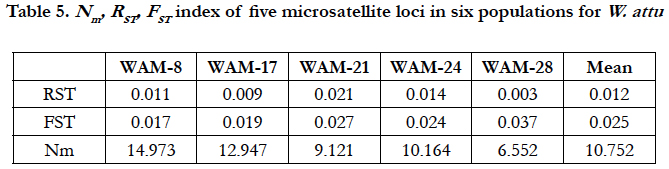
Number of migrants after correction for size was 1.96121. Both FST and RST for all populations across all loci show that there was insignificant population structuring among all populations.
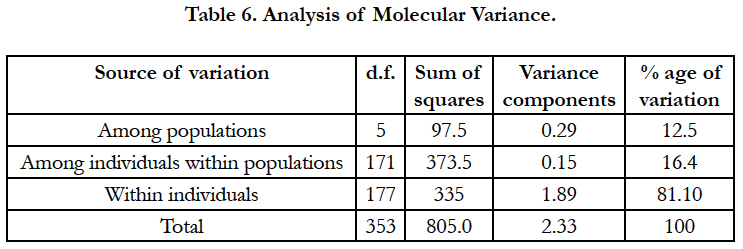
Hierarchical partition of genetic diversity was assessed by AMOVA using ARLEQUIN, which estimates the population structure at different levels i.e. within population, among sub populations. The results of AMOVA showed structuring in the sample populations. So, prominent diversity existed within populations (Table 6) percentage of variation among populations is 12.5% which was lower than variation within populations (16.4%).
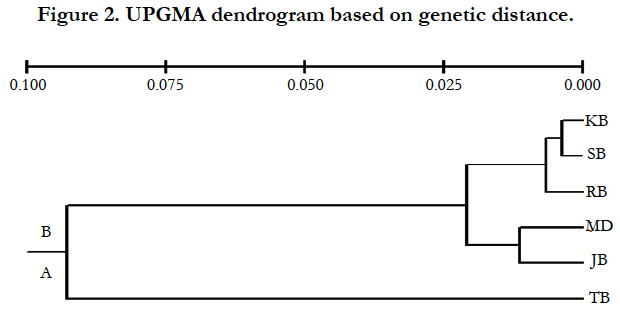
The UPGMA dendrogram obtained from cluster analysis exhibited two distinct clusters corresponding to six populations that are represented by A and B (Figure 2). The cluster (A) encompassed only one population that is TB whereas cluster (B) included all remaining five populations. The UPGMA demonstrated that there is no gene flow between A and B clusters from decades. The largest value for genetic distance was 0.1268, found between KB and TB, whereas the smallest value of genetic distance was 0.0038, obtained from KB and SB. The UPGMA dendrogram depicted the underlying structure of population differentiation. It demonstrated two distinct groups however the genetic relatedness among the population was revealed by microsatellites analysis.
A multivariate ordination was conducted to visualize the genetic relationships among populations by Principal components analysis (PCA) carried out by EIGENANALYSIS 2.4.1. This approach not only useful to demonstrate population structure, but also delivers a formal approach for allocating statistical significance to population subdivision [15]. The results support four discontinuous populations with gene flow. The results were more are less same as revealed by UPGMA.
Discussion
The genetic structure of any population is not a fixed phenomenon and it is exposed to change over time. The extent and trends of the variations principally depend on the intensity of anthropogenic interventions. The present study identified a reducing trends in the effective population size (Ne) of W. attu in the Jhelum river as revealed by insufficiency in heterozygotes and enhancing inbreeding (FIS values). Genetic diversity of larger populations decline at a slower rate than that of a smaller population and loss of genetic diversity is thought to be the loss of suitability of a population.
Several previous studies on genetic variation revealed that narrow distribution or small population size tend to maintain low degree of genetic variability due to the impact of genetic drift, the founder effect, directional selection and with high levels of inbreeding [8]. Several natural factors and anthropogenic involvements, for example fluctuating environment, habitats destruction and severe exploitation have caused an intense decline in freshwater populations [6].
All five microsatellite loci were found to be polymorphic and showed multiple alleles in all populations of W. attu. Two loci, WAM-8 and WAM-17 showed very low diversity (Na= 3) whereas locus WAM-28 exhibited maximum diversity (Na= 9) among samples. The mean number of alleles per locus were varied between 3.8 (JM) to 4.8 (TB). A total of 23 alleles were discovered against five microsatellite loci the effective number of alleles varied between 1.5117 to 6.6461. More or less all six populations shared the most of the alleles at each locus. The average allelic richness (Ar) at each locus varied from 2.991 to 8.420 with grand mean of 4.33, the difference in Ar values indicates geographic variations among all populations. The results of this study were in corroboration with [21] who studied the population structure of Clarias batrachus.
In term of Ho and Na results were lower than that reported generally for freshwater fish species i.e. Ho = 0.54 ± 0.25, and Na = 9.1 ± 6.1 and anadromous fish species Na = 10.8 ± 7.2, [3]. Prrior to heterozygosity, the Na is used as central parameter to assess the diversity of a species in genetic monitoring, for the reason that Na may be lost more rapidly than heterozygosity, and frequency of alleles have little influences on overall heterozygosity [10]. The genetic drift and bottleneck are significant factors which contribute in reduction of Na without having apparent effect on Ho and He [12]. Both the heterozygosity and the number of allele are indicative of population structure, but the allele number is much more reliant on population effective size ( Ne) than heterozygosity [13]. Thus, Na is more reliable to evaluate genetic diversity of a population for conservation, selection and enhancement programmes [4].
The results revealed that the mean observed heterozygosity was lesser than mean Expected heterozygosity (Table 3). The high Nm values, error in manual alleles scoring and a small sample size are the few causes for a low Ho as described [10].
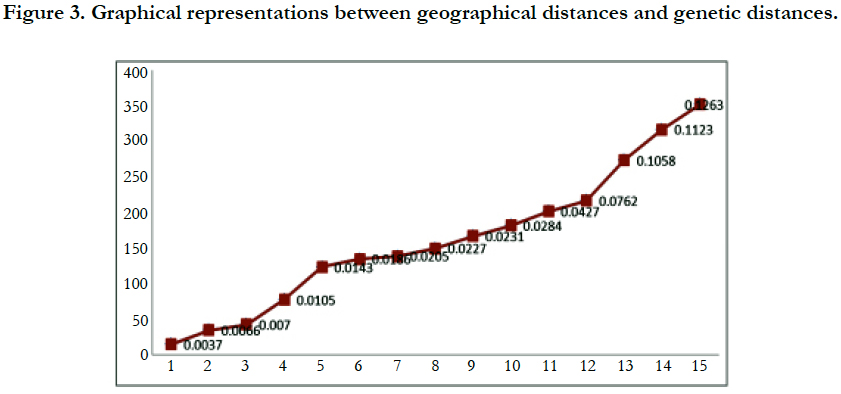
Even though there were no significant statistical differences in number of allele but this study revealed that there was significantly higher diversity in TB population than that of other five populations. The largest geographical distance was between TB population and MD populations i.e. 352km. The differentiation may result from different selection procedures, different environment and difference in geographical area. There was no genetic differentiation between KB and the SB populations. It may result from large number of population sizes or little distance between of these two sites which was almost 17 Km.
Deviations to HWE may be due to high Nm values, low number of specimens, selection programs, inbreeding propagation and genetic drift [2,11]. This species do not have any selection programs in Pakistan and no significant bottlenecks revealed in any exmined population in this study, so the deviation from the HWE may be associated to the causes mentioned previous.
In summary, the present research work is the first report on population genetics of W. attu from the Jhelum river. Microsatellites maker used in this study proved very useful analyzing instruments in genetic monitoring. All the five microsatellite loci were polymorphic (100%). Therefore, these primers are recommended for other researcher to explore the genetic structure of W. attu. Results revealed that diversity of W. attu was rather high in the TB (intra population), but genetic variation among six populations was extremely low (12.5%) due to certain reasons like high gene flow, overfishing, habitats degradation, expansion of industries near the river and waste water pollution.
This document defines the genetic computational methodologies and their practices in learning about genetic structure and more customarily about the demographic account of populations. The present-day W. attu populations still maintain high degree of intra-population genetic diversity and exhibit low levels of interpopulation differentiation as evinced by the present microsatellite analysis. According to results this species might have suffered heavy losses of genetic diversity from a current habitat loss and a decline in population size. Hence, if it continues to decline at present rate, this fish will be endangered species soon; it is quite possible that the process of habitat isolation will lead to a loss of genetic diversity by dramatically increasing mating opportunities between relatives and intra-clones within small populations. Appropriate conservation strategies are required for the long-time survival of this species.
Acknowledgements
The authors express their sincere thanks to Irum Qadeer and Nadia Nazish doctorate scholars, Aquaculture Biotechnology Lab. Department of Zoology, Wildlife and Fisheries for their scholarly guidance and constant encouragement during the course of research work.
References
- Ciftci Y, I Okumus (2002) Fish population genetics and applications of molecular markers to fisheries and aquaculture: Basic principles of fish population’s genetics. Turk J Fish Aquat Sci. 2(2): 145-155.
- Dahle G, KE Jorstad, HE Rusaas, H Ottera (2006) Genetic characteristics of brood stock collected from four Norwegian coastal cod (Gadus morpha) populations. Marine Sci. 63(2): 209- 215.
- DeWoody JA, JC Avise (2000) Microsatellite variation in marine, freshwater and anadromous fishes compared to other animals. J Fish Biol 56(3):461–473.
- Diz AP and P Presa (2009) The genetic diversity pattern of Mytilus galloprovincialis in Galician Rias (NW Iberian estuaries). Aquaculture 287(3): 278-285.
- Dutta-Munshi JS, ON Singh and DK Singh (1990) Food feeding relationships of certain aquatic animals in the Ganga ecosystem. Tropical Ecol 31(2): 138-144.
- Fu CZ, JH Wu, JK Chen, QH Qu and GC Lei (2003) Freshwater fish biodiversity in the Yangtze River basin of china: patterns, threats and conservation. Biodivers. Conserve 12(8): 1649–1685.
- Goudet J (2002) FSTAT, version 2.9.3.2. A program to estimate and test gene diversities and fixation indices. Lausanne, Switzerland.
- Hamrick JL, Godt MJW ( 1996) Effects of life history traits on genetic diversity in plant species. Philos Trans R Soc Lond. 351(1345): 1291-1298.
- Li J, G Wang, Z Bai (2009) Genetic variability in four wild and two farmed stocks of the Chinese freshwater pearl mussel (Hyriopsis cumingii) estimated by microsatellite DNA markers. Aquaculture 287(3): 286-291.
- Lind CU, BS Evans, J Knauer, JJU Taylor, DR Jerry (2009) Decreased genetic diversity and a reduced effective population size in cultured silver-lipped pearl oysters (Pinctada maxima). Aquaculture 286(1): 12-19.
- Lucentini L, A Palomba, H Lancioni, L Gigliarelli, M Natali ( 2006) Microsatellite polymorphism in Italian populations of northern pike (Esox lucius). Fish. Res 80(2): 251-262.
- Lundrigan TA, JD Reist, MM Ferguson (2005) Microsatellite genetic variation within and among Arctic charr (Salvelinus alpinus) from aquaculture and natural populations in North America. Aquaculture, 244(1): 63-75.
- Nei M, T Maruyama, R Chakraborty (1975) The bottleneck effect and genetic variability in populations. Evolution 29(1): 1-10.
- Okumus I, Y Çiftci (2003) Fish Population Genetics and Molecular Markers: II- Molecular Markers and Their Applications in Fisheries and Aquaculture. Turkish J. Fish. Aquat Sci. 3(1): 51-79.
- Patterson N, Price AL, Reich D (2006) Population structure and eigenanalysis. PLoS Genet. 2(12)e190.
- Raymond M, F Rousset (1995) GENEPOP, version 1.2. Population genetics software for exact tests and ecumenicism. J Hered 86(3): 248-249.
- Sahoo SK, SS Giri and AK Sahu (2002) Cannibalism a cause of high mortality in Wallago attu (Schneider) larvae. India. J Fish. 49(2): 173-177.
- Singh AW, S Lakra, RP Mandhan, M Goswami, K Yadav, BS Sharma (2013) Isolation and characterization of polymorphic microsatellite loci in Wallago attu (Teleostei, Siluridae). Mol. Ecol. Res., 13: 546-549.
- Weir BS, CC Cockerham (1984) Estimating F-statistics for the analysis of population structure. Evolution 38(6): 1358-1370.
- Yue GH and L Orban (2005) A simple and affordable method for high through put DNA extraction from animal tissues for polymerase chain reaction. Electrophoresis 26(16) : 3081-3083.
- Yue GH, B Kovacs, L Orban (2003) Microsatellites from Clarias batrachus and their polymorphism in seven additional catfish species. Mol. Ecol. Notes 3(3): 465-468.


