The Variation Of The Natural Frequencies With Increasing Pure Shear Loads For Rectangular Isotropic Plates
Zazon, M., Klein, G, Abramovich H*
Faculty of Aerospace Engineering, Technion, I.I.T., 32000 Haifa, Israel.
*Corresponding Author
Abramovich, H,
Faculty of Aerospace Engineering, Technion, I.I.T., 32000 Haifa, Israel.
Email: abramovich.haim@gmail.com
Received: March 29, 2022; Accepted: April 09, 2022; Published: April 13, 2022
Citation:Zazon, M., Klein, G, Abramovich H. The Variation Of The Natural Frequencies With Increasing Pure Shear Loads For Rectangular Isotropic Plates. Int J Aeronautics Aerospace Res. 2021;09(01):262-269. doi: dx.doi.org/10.19070/2470-4415-2200034
Copyright: Abramovich H© 2022. This is an open-access article distributed under the terms of the Creative Commons Attribution License, which permits unrestricted use, distribution and reproduction in any medium, provided the original author and source are credited.
Abstract
A numerical study was performed,to investigate the influence of applied pure shear on the natural frequencies of flat isotropic
rectangular plates with simply supported boundary conditions all around their perimeter. Various aspect ratios were
investigated,and their relevant buckling loads and modes were calculated using the ANSYS Workbench 2020 FE code. It
was found that the frequency squared vs. the applied pure shear relationship displays a non-linear behavior. This behavior
can be approximated with a high confidence when fitting a 4th order polynomial equation to the numerical curve. The
number of points used to fit the polynomial equation and predict the flat plate pure shear-buckling load was investigated
yielding a recommended value of points till 70%Nxycr to be used for engineering purposes.
2.Introduction
3.Literature Review
4.Dimensional analysis and Similitude
5.Design procedure of gating and runners
6.Experimental Procedures
7. Conclusion
8. References
Keywords
VCT, Buckling; Thinwalled Isotropic Rectangular Plate; Natural Frequencies; Relationship Between Frequencies Squared And Applied Shear Load.
Introduction
Thin walled structures, like columns, plates and shells are liable
to buckling when subjected to axial compressive loads. Although
the buckling loads of those basic structures can be analytically
calculated, their experimental values are found to be less than the
numerical predictions. This is due to the real boundary conditions
of the tested specimens, the initial imperfections of the
structure and the load eccentricity induced during the tests. Not
all those factors can be a priori taken into account, leading to
over prediction of the buckling loads using analytical formulas
of by modeling the thin structure with a finite element code. The
discrepancy between the experimental and numerical/analytical
predictions leads to the including of a knockdown factor (less
that unity). This factor multiplies the numerical/analytical buckling
load value to yield a design buckling value for the thin walled
structures. As the knockdown factor is based on the lower value
for all the experimental results included in the database for a certain
thin walled structure, the resulting structure will have higher
thickness, thus reducing its stiffness/mass advantage. The striving
of an engineer is to be able to nondestructive predict the actual
in-situ buckling loads of a thin walled structure, and thus save
weight of the structure. One of those methods is the VCT (vibration
correlation technique).
The vibration correlation technique (VCT) consists of measuring
the natural frequencies of a loaded structure, and monitoring
their change, while increasing the applied load. Assuming that the
vibrational modes are similar to the buckling ones, one can draw
a curve, displaying the natural frequencies squared vs. the applied
load, and extrapolating the curve to zero frequency would yield
the predicted buckling load of the tested structure. In [1] Abramovich,
dedicated a whole chapter in his book, to review the VCT
approach and its applications. The subject was also presented in
details in [2].
Besides its capability to nondestructively predict the buckling load
of thin walled structures, the approach can also determine the
actual in situ boundary condition of the structures, and therefore
the VCT is usually classified in two main groups according to their
approach: (1) determination of in situ boundary conditions, and
(2) direct prediction of buckling loads.
The VCT method has been successfully applied to beams and
columns axially loaded, (see for example Refs.[2-17]), yielding a
straight line between the frequency squared and the compressive load for both theoretical and experimental cases. Taking into
account the differential equation for an isotropic column with
constant properties EI along its length L, compressed by an axial
loading P and undergoing small vibrations at a circular frequency
ω, which can be presented as:

one can easily find the buckling load Pcr and its fundamental frequency
f1 for a column on simply supported boundary conditions.
Their relevant expressions are

where ρA is the mass per unit length. Using the definitions in
Eq. 2, it is easy to find the following relationship between the
compressive load and the natural basic frequency of the column:

where f and f1 are the measured frequency and its value at zero
compressive load, respectively and p and Pcr are the experimental
applied compressive load and its buckling value at zero frequency,
respectively.
One should note that other cases of columns, like a compressed
column on Winkler-type foundation, laminated symmetric and
non-symmetric compressed columns using either CLT (Classical
Lamination Theory) or FOSDT (First Order Shear Deformation
Theory) theories [1] would also comply with the expression presented
by Eq.3.
The application of VCT on perfect plates and shells, for compressive
loading has also being dealt in the literature as presented
in Refs. [17-26] and [27-44], respectively. For perfect rectangular
isotropic plates the differential equation of motion can be written
as [1]

where E is the Young' modulus, h=plate thickness and ρh=mass
per unit area of the plate.
Nx and Ny are the in-plane loads per unit length in the x and y
directions, respectively.
For a simply supported all around case, one obtains the following
expressions for the natural frequencies and the buckling loads for
compression in the x only or y only directions:

Keeping in mind the expressions in Eq. 5, and using Eq. 4 one
obtains the following equation

which is similar to Eq. 3, namely the frequency squared is linearly
dependent on the compressive loads, as was shown above
for columns. This linear equation was shown to be also true in
experiments, see for example [18]. However, as in real life plates
have some initial imperfections, the theoretical linear relationship
cease to be true as the compressive load is approaching the
buckling load [21]. At the buckling load, which does not occur
at zero frequency, and afterwards, the curve starts to raise again
with the increasing of the compressive load. Experimentally, the
point where the curve changes its tendency would be the VCT
predicted buckling load.
As pointed out in [1, 2], also for cylindrical shells compressed
axially a linear theoretical curve exists for the square of the lowest
natural frequency and the applied compressed load. However,
when trying to apply the VCT to a cylindrical compressed shell,
the linear relationship predicts higher and wrong buckling loads.
The literature presents two applications to correctly predict the
buckling loads of cylinders. The first one is attributed to Souza et
al. [30-32] that suggested using the following relationship

where ξ is the “experimental” knock-down factor based on the results
of the test, at relatively low loads. The procedure starts with
the acquisition of the natural frequencies at zero axial load. Then
the load is increased and the nondimensional frequency f is calculated
for each load step, by normalizing the measured frequency
at a compression load P by the frequency at zero compression.
Then the load P is also normalized by the numerical buckling
load Pcr to yield the variable p. At about 60% of the calculated
buckling load the test is stopped, a straight line is drawn, starting
at point [(1-f4)=0,(1-p)2=1] till point (ξ2,(1-f4)=1]. The value of ξ2
is determined as thecross point between the oblique line and the
vertical line from (1-f4)=1. The application of Eq. 7 was shown to
provide good results for stringer stiffened circular isotropic shells
[30]. Another application is the empiric relationship suggested by
Arbelo et al. [34, 35]. The empirical approach is based on the
modification of Eq. 7 yielding the following relationship

Then a graph of (1 - p)2 vs. (1 - f2) is constructed based on a typical
test. Following the definitions of p and f, presented in Eq. 7,
a best fit second order equation is approximated based on the
experimental points. The fitted second order polynomic curve of
the measured experimental natural frequencies would have the
following expression:

with the values of the constants α, β and χ being determined by
the best fit process. Finding the minimal point of the second order
equation presented in Eq. 9 yields

with ξ being the "knock-down factor" which represents the drop
in the shell load carrying capacity, like Souza et. al [30] method,
presented above, leading to the prediction of the in-situ tested
specimen using the following form:

The use of Arbelo's empirical method provided very good results,
as shown in Ref. [33-44].
When trying to apply the VCT to plates loaded in pure shear ,due
to the complexity of the problem , the linear relationship presented
before does not hold anymore, and a new procedure should
be used. The influence of shear on the natural frequencies of a
flat plate was rarely treated in the literature (see [45-60]) with no
decisive formulation. Therefore, the present study is intended to
provide an application aimed to allow predicting the buckling of a
flat plate under pure shear, by monitoring its natural frequencies.
A flat isotropic plate under shear
Figure 1 presents a rectangular isotropic flat plate, having the
thickness h, length a and width b under shear loads Nxy per unit
length.
The differential equation for this case can be written as

Due to its problematic appearance of Eq. 12, there is no closed
form expression for the critical shear (or shear stress) loading.
Only approximate solutions are available in the literature. One of
those solutions is the one presented by Timoshenko & Gere [61]
and can be presented as

The factor k depends on the aspect ratio (a/b) on the flat rectangular
plate as presented in Table 1 (from [61]).
For larger aspect ratios, the following approximation should be
used (see [61]):

The natural frequency expression for the unloaded case keeps it
value as it was shown above in Eq. 5.
To investigate the relationship between the shear load and the natural
frequency of a flat rectangular plate, a finite element model
using ANSYS Workbench 2020 (Student Version) [62] was constructed
and its results are next presented.
The finite element model consists of a 100 x 100 mm2 plate with
a thickness of 1 mm. The chosen material has a Young's modulus
of 200 GPa, a Poisson's ratio of 0.3 and a density of 7850 kg/m3.
The basic square model had 50 x 50 Quad elements. To enable
simulations for various aspect ratios (AR=a/b) the basic model
was enlarged in the x direction, yielding 50*AR elements. Figure
2 presents the application of the shear forces and the applied
boundary conditions to simulate the demanded simply supported
all around the plate circumference.
Results
The buckling load calculated by the finite element code are presented
in Table 2 for various aspect ratio of the plate and compared
to the theoretical values obtained thru Eqs.13 and 14.
As one can see, the results from the finite element code are in very
good agreement with the theoretical ones, the largest deviation
being 1% for AR=3. The buckling mode shapes are presented in Fig. 3.
Next, the natural frequencies for various levels of the shear load
were calculated and presented in Figs. 4-7, for AR=1, AR=1.5,
AR=2 and AR=3, respectively.
As can be seen from Figs. 4-7, the first frequency mode of bending
changes its shape and rotates along the main diagonal line of
the plate's surface, till its shape is identical to the buckling mode
shape (see Fig. 3). Note the interesting phenomenon presented in
Fig. 6 , where for an aspect ratio of AR=3, the frequency mode
shape changes it shape from one a single oblique half at 70% of
FE buckling load wave to two oblique half waves at 90% of the
FE buckling load, which is the exact buckling mode as displayed
in Fig. 3.
Figure 8 displays the variation of the frequency squared with the
increasing of the shear load, for aspect ratios of AR=1, 1.5, 2 and
3. The fourth order polynomial equation fitted to the FE calculated
values is presented for each graph and includes its relevant R2
value (how good is the fitted polynomial equation for the given
data, with R2=1 been a 100% fitting).
The calculated buckling loads, using the various fitted polynomial
equations are presented in Table 3, together with the referencebuckling
load, as calculated by the FE code.
Table 4 presents the various deviations of the predicted buckling
loads from its relevant numerical buckling loads for various aspect
ratios. One can see that the predicted buckling loads when taken into account 100% Nxycr of the points are in a very close proximity
with the numerical buckling loads (deviations between 0.33%
and -1.83%). However, the prediction procedure should use much
less points to be used as a VCT approach. As is depicted in Table
3, taking into account 70% Nxycr points also leads to a good proximity
to the numerical buckling loads (deviations between -1.56%
and 4.32%). This proximity deteriorates for points up to 60% Nxycr
(deviations between -4.98% and 16.44%) and up to 50% Nxycr
(deviations between -7.10% and 40.53%).
Based on the above results, to use the present method as a VCT
approach, it is recommended to use points up to 60% or 70% of
the calculated buckling loads.
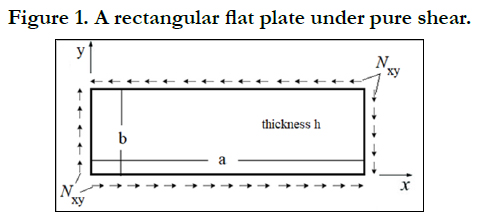
Figure 1. A rectangular flat plate under pure shear.
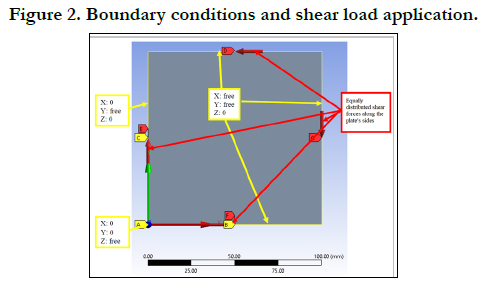
Figure 2. Boundary conditions and shear load application.
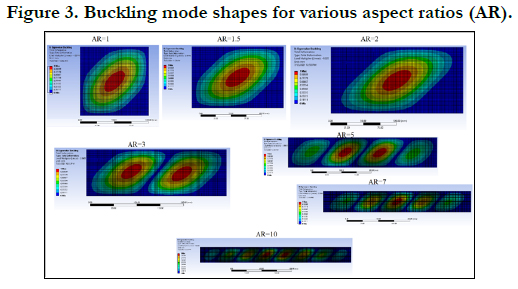

Figure 3. Buckling mode shapes for various aspect ratios (AR).
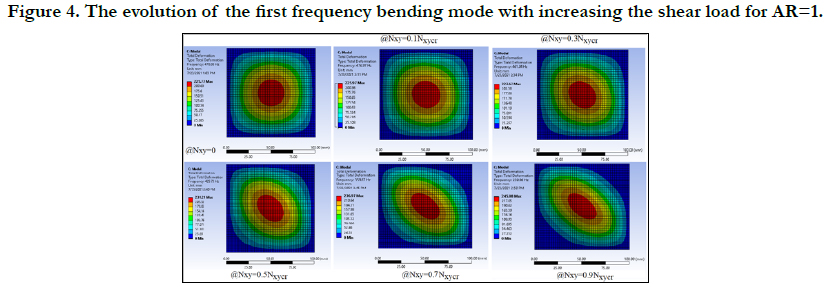
Figure 4. The evolution of the first frequency bending mode with increasing the shear load for AR=1.
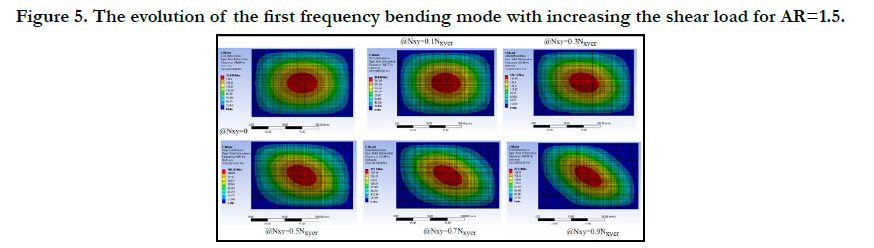
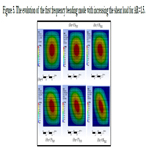
Figure 5. The evolution of the first frequency bending mode with increasing the shear load for AR=1.5.
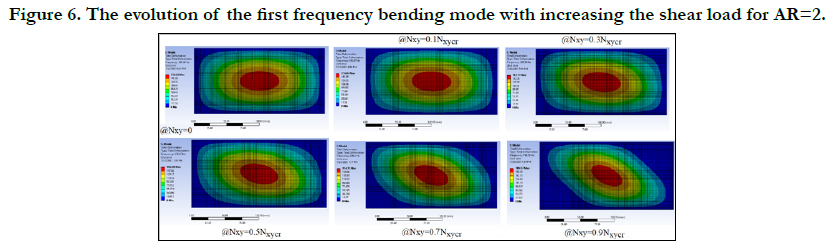
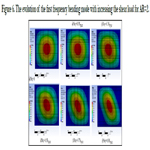
Figure 6. The evolution of the first frequency bending mode with increasing the shear load for AR=2.
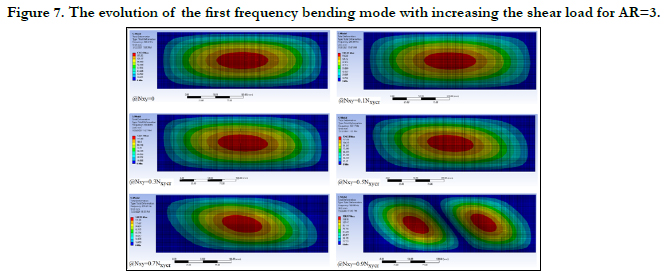
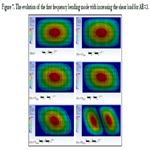
Figure 7. The evolution of the first frequency bending mode with increasing the shear load for AR=3.
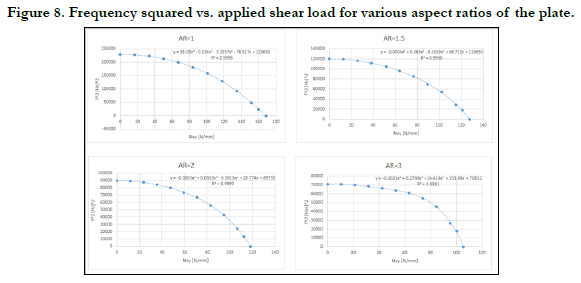
Figure 8. Frequency squared vs. applied shear load for various aspect ratios of the plate.
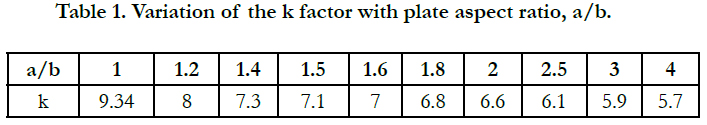

Table 1. Variation of the k factor with plate aspect ratio, a/b.
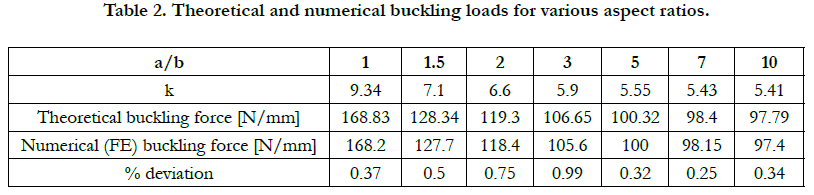
Table 2. Theoretical and numerical buckling loads for various aspect ratios.
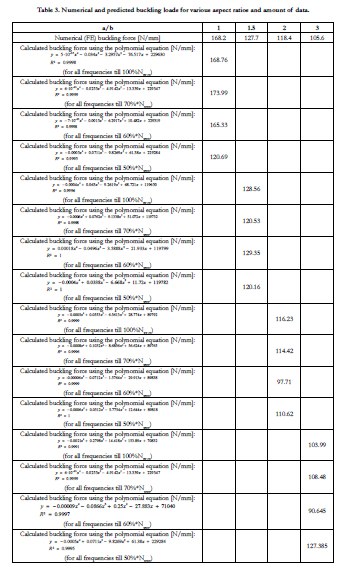
Table 3. Numerical and predicted buckling loads for various aspect ratios and amount of data.
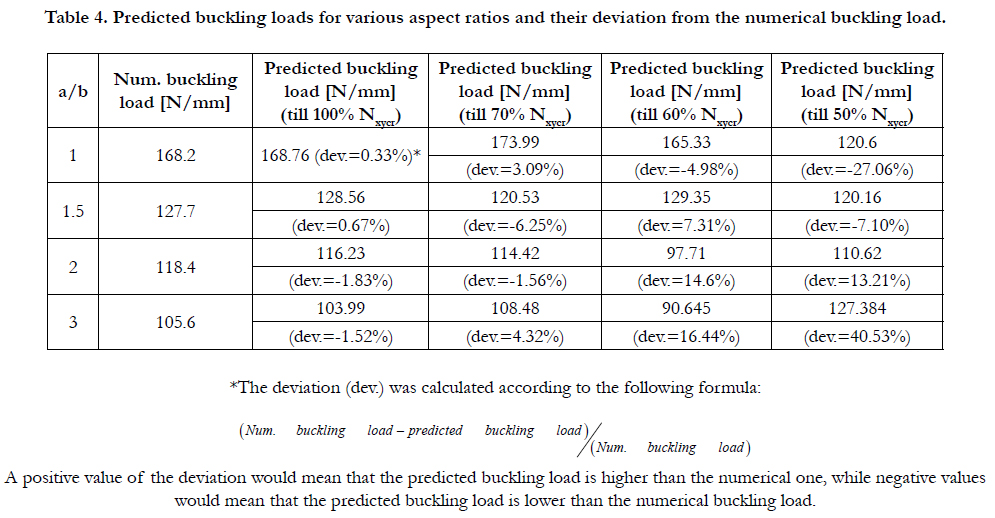
Table 4. Predicted buckling loads for various aspect ratios and their deviation from the numerical buckling load.
Conclusions
A study was initiated to investigate the changes in the natural frequencies
of flat isotropic rectangular on all around simply supported boundary conditions under increasing pure shear, till buckling.
This case differs completely from the cases of plates under
compressive loads for which the square of the natural frequency
is inverselinearly to the applied compressive loads. The frequency
squared for a plate under increasing shear shows a non-linear behavior,
which should be defined. The results of the investigation
for flat plates with aspect ratios of AR=1, 1.5, 2 and 3, show that:
• The relationship between the applied shear load and the frequency
squared can be approximated using a fitted 4th order polynomial
equation, when using frequencies from zero till buckling.
The deviation between the predicted buckling load and the calculated
FE buckling load is very low and ranges from 0.33% to
-1.83%.
• Using only part of the points, from zero to 70%Nxycr and fitting
a 4th order polynomial equation, yield also good results with
deviations ranging between -1.56% and 4.32%, which, from the
engineering point of view can be considered a good tool to predict
buckling under pure shear.
• Trying to reduce the points used to fit a 4th order polynomial
equation up to 60%Nxycr or 50%Nxycr would predict buckling
loads with large deviations (larger than 5%) from the numerical
FE buckling load.
• It is recommended that the user would use points up to 70%Nxycr,
to predict the pure shear buckling load of a flat isotropic
rectangular plate on simply supported boundary conditions with
a high level of confidence.
• It was observed that the first mode changes its shape during
the increasing of the shear load and rotates to yield the inclined
buckling mode of the plate under shear.
• Moreover, for an aspect ratio of AR=3, the one oblique half
wave frequency mode, would jump to two inclined half waves
frequency modes when applying 70% Nxycr and it keeps this form
up to buckling under shear.
• One has to remember, that once geometric imperfections are
taken into account, and the plate is no more flat, the equations of
motion would change and the frequency squared vs. the applied
shear load relationship might be different. For plates under compressive
loads, experiments show that the frequency squared does
not diminish to zero at the buckling load. Instead, the reduction
of the frequency squared changes its tendency at the buckling
load and starts increasing its value. The load, at which the curve
changes its tendency, would be defined as experimental buckling
load. This behavior is expected to appear also in experiments on
plates under pure shear loads.
References
- Saha S, Majumdar B. Modeling and simulation on double delta wing. International Journal of Advanced Computer Research. 2013 Mar 1;3(1):201.
- Christopher J, Petter K. MODELING OF UNSTEADY AERODYNAMIC CHARACTERISTCS OF DELTA WINGS. ICAS 2002.
- Russell H, Williams RG. Cross Flow Over Double Delta Wings. CSA ENGINEERING INC PALO ALTO CA; 1994 Feb 1.
- Pirzadeh SZ. Vortical flow prediction using an adaptive unstructured grid method. NATIONAL AERONAUTICS AND SPACE ADMINISTRATION HAMPTON VA LANGLEY RESEARCH CENTER; 2003 Mar 1.


