Developing Airline Segmentation Based on The On-time Performance
Dothang Truong*
Embry-Riddle Aeronautical University, USA.
*Corresponding Author
Dothang Truong,
Embry-Riddle Aeronautical University, USA.
Tel: (386) 323-5080
Email: truongd@erau.edu
Received: October 03, 2016; Accepted: November 16, 2016; Published: November 17, 2016
Citation: Dothang Truong (2016) Developing Airline Segmentation Based on The On-time Performance. Int J Aeronautics Aerospace Res. 3(5), 131-140. doi: dx.doi.org/10.19070/2470-4415-1600016
Copyright: Dothang Truong© 2016. This is an open-access article distributed under the terms of the Creative Commons Attribution License, which permits unrestricted use, distribution and reproduction in any medium, provided the original author and source are credited.
Abstract
Flight delay is a critical nation wide issue that has negative impacts on both airlines and passengers. However, airlines do not perform equally in term of on-time arrival rates. The purpose of this paper is to develop airline segmentation in the market based on the on-time performance. Cluster analysis was performed using flight delay data collected from the Bureau of Transportation Statistics (BTS) databases. The results indicate three major segments in the airline market based on similarities among airlines in regard to their on-time performance. The differences of on-time performance across these segments and the airline profile of each segment provide airlines and passengers useful information to make meaningful decisions.
2.Introduction
3.Flight Delays and Literature Review
3.1.Flight Delays by Causes
3.2.Previous Works on Airlines and Flight Delays
4.Methodology
4.1.Data Collection
5.Results
5.1.Cluster Analysis
5.2.Cluster Interpretation
5.3.Cluster Profiling
7.Discussion and Conclusion
9.References
Keywords
Airline Segmentation; Flight Delay; On-Time Performance; Cluster Analysis; Airlines.
Introduction
The growing demand of air travels in the United States has driven airlines to increase the number of flights. Airlines for America (A4A) projected 15.6 million passengers would travel by air during the Labor Day holiday period in 2016, a four percent increase from the 2015 Labor Day period. On average, US airlines serve 2.2 million passengers on 27 thousand flights each day [1]. In the airline business, flight on-time performance is important to the airline success since it affects both airlines and passengers. However, flight delay has become a chronical issue nationwide. Bureau of Transportation Statistics (BTS) reported an on-time arrival rate of 75.2 percent in July 2016, decreased from the 78.1 percent on-time rate in July 2015 [5]. Flight delays have negative impacts on the airline industry, in general, and on individual airlines and passengers, in particular. Flight delays create great challenges to airlines in term of lost productivity, increased lodging and food expenses for the flight crews, passenger complaints, increased flight time, passenger loss, increased operating and fuel costs, and, most importantly, poor airline image. From the passenger perspective, flight delays may cause stress, cancelled flights, missing connected flights, disrupted schedule, and health issues. It was estimated that the per-minute-cost of delays to U.S. airlines was $65.43 per minute in 2015 [2].
Flight delays have attracted great attention from the academia. However, the majority of studies in flight delays focus on delays at airports rather than at the airline level. In addition, these studies mainly involve building a model to predict flight delay incidents and determining factors that influence the delays. A very few studies examined flight delays at the airline level, but rather focused on economic impacts of flight delays to airlines [29], or drivers to improving the flight on-time performance for individual airlines [15, 30]. Very little attention has been paid to how airlines perform differently in term of on-time arrival rates and the market segmentation based on airlines’ on-time performance. In this competitive market, airlines need to differentiate themselves from the competitors to survive and succeed. While causes for delays such as extreme weather, airport capacity, traffic volume, and security are not in the control of airlines, they should have some control on their own maintenance or crew problem, aircraft cleaning, baggage loading, fueling, etc.
Statistics shows that not all airlines perform equally in term of the flight on-time performance. In the period from July 2015 to June 2016, Delta Airlines and Alaska Airlines were the ones that achieved the highest on-time arrival rate of more than 87 percent, while Spirit Airlines was the one with the lowest on-time arrival rate of 70.86 percent followed by Jet Blue Airway with the on-time arrival rate of 76% [6]. These numbers indicate the-heterogeneity of the on-time performance among airlines in the US market. Since 2010, the airline industry has experienced many structural changes: the merger between Delta and Northwest in 2010, the mergers between United and Continental and between Atlantic Southeast and Express Jet in 2012, the merger between Southwest and Air Tran in January 2015, and the merger between American and US Airways in July 2015. These changes have impacts on the competitiveness in the airline market, since some airlines have grown in size and also experienced the operational transitions after the mergers. These changes along with the heterogeneity of the on-time performance among airlines highlight the importance of grouping airlines based on their similarities in flight delays to provide a more accurate picture of the US airline market.
The purpose of this paper is to develop airline segmentation of US airlines based on their on-time performance using the cluster analysis, compare these segments, and profile the characteristics of airlines in each segment. The results of this study provide a complete picture of the airline on-time performance in the market, which would benefit both airlines and passengers. This market segmentation can help airlines realize their current position in the market and provide them with useful information to form necessary strategies to stay competitive. Passengers can also use the airline segmentation to view the on-time performance of airlines in the market to make meaningful decisions on selecting airlines for travel.
The paper is structured as follows. The next section provides background on flight delays and reviews the relevant literature. The following section describes the methodology and data collection process. Then, results of the cluster analysis are presented and interpreted. Finally, discussions and conclusions on the implications of the study are provided.
Flight Delays and Literature Review
According to BTS, a flight is considered “delayed” when it arrives 15 minutes later than the scheduled arrival time
(www.rita.dot.gov/bts/help_with_data/aviation/index.html). The frequency of delays and delayed minutes are the main concerns to airlines because these variables are linked to direct costs due to the “loss of productivity” as well as to indirect costs due to “the invisible loss of time and loyalty of passengers” [32].
Flight delays could occur for different reasons. BTS classify causes of flight delays into five major categories as follows [7].
- Situations under the airline's control (e.g. maintenance issues, crew problems, aircraft cleaning, baggage loading, fueling, etc.).
- Significant meteorological conditions (e.g., tornado, blizzard or hurricane) that delays a flight or prevents the operation of a flight
- Non-extreme weather conditions, airport operations, heavy traffic volume, and air traffic control.
- The late arriving of a previous flight with same aircraft, which causes the delay of the present departing flight.
- Situations such as security breach, inoperative screening equipment, or long lines in excess of 29 minutes at screening areas, which cause evacuation of a terminal or re-boarding of aircraft.
Table 1 shows the overall flight on-time performance statistics in the US in 2016 in both percentage of delays and delayed minutes (note that BTS reports the delay and airline data for 2016 beginning in July 2015 and ending in June 2016). The statistics show the on-time operations, delays by five causes, and cancelled and diverted flights. Overall, it can be seen that in 2016, 81.52% of flight operations were on-time. As for delayed flights, the major cause was the late arriving of the aircraft (6.21%) followed by air carrier and NAS causes (5.15%). Less than 1% of flights was delayed due to extreme weather (0.53%), whereas the percentage of delays due to security was very small (0.04%). In term of delayed minutes, delays caused by late arriving of aircraft accounted for most of delay time (39.68%) followed by air carrier delay (32.58%) and NAS delay (23.05%). It is worthy to note that delays caused by air carrier conditions seem substantial both in term of frequency and delay time. While other factors such as extreme weather, airport conditions, or schedule are not in the control of airlines, they have more control on their maintenance operations, aircraft cleaning, fueling, or baggage loadings.
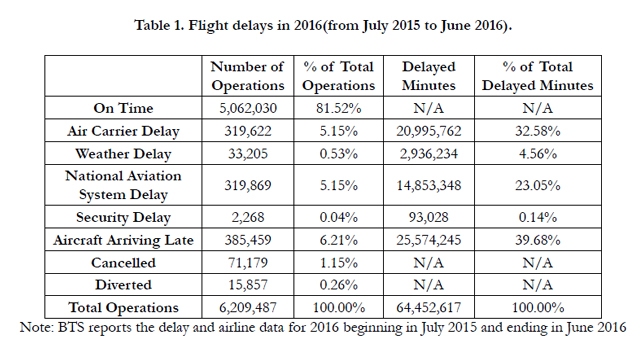

Table 1. Flight delays in 2016(from July 2015 to June 2016).
The uneven number of delayed operations across five delay causes indicates heterogeneity of flight delay situations in the airline market. Due to the significant impact of flight delays on the airline industry, segmenting airlines based on their on-time performance would be useful for both airlines and passengers.The segmentation would provide airline executives with a better picture of the airline performance in relative to other airlines in the same market, which allows them to develop necessary strategies to improve their on-time performance to become more competitive. Passengers can also use the information from the segmentation to gain more understanding about differences among airlines in the market in term of on-time arrival rates and make meaningful decisions on selecting an airline for travel. However, development of such airline segmentation based on the on-time performance is lacking in the literature.
The existing airline literature mainly differentiate airlines based on their business model: low cost carriers vs. full cost carriers [10, 13, 16, 26, 27], or low cost long haul carriers vs. low cost short haul carriers [12, 14, 28, 31]. These studies examined various factors that affected passengers in selecting an airline based on their business model.While on-time performance was included in a few models [21, 24], it was typically considered part of service quality. There have been no differentiation among airlines explicitly from the airline on-time performance perspective nor the segmentation of airlines.
In another trend, airlines are compared in regard to their efficiency, either fuel efficiency, energy efficiency, operational efficiency, technical efficiency, economic efficiency, or environmental efficiency [3, 9, 11, 22, 23, 32, 33]. These studies evaluated airlines’ relative efficiency to other competitors in order to determine the benchmark, or efficiency frontier, based on different input factors such as fuel consumption, operating costs, technical factors, economic factors, or environmental factors. The outputs are typically revenue passenger miles or available seat miles. While these studies provided useful results on airline efficiency and benchmarking, they focused on comparing individual airlines rather than grouping airlines by their similarities. In addition, flight on-time performance has not been incorporated in these studies.
Most current flight delay studies focused on examining factors that affected flight delays. Hansen and Zhang (2004)[35] studied factors such as daily average arrival delay, deterministic queuing delay, cancellations, adverse weather, clearance time holding, and flight operations. In another paper, Abdelghany et al., (2004) [34] predicted down-line flight delays due to any operation irregularity. Hansen and Hsiao (2005) [17] constructed an econometric model of average daily delay and focused on the effects of arrival queuing, convective weather, and terminal weather. Similarly, Hsiao and Hansen (2006) [18] evaluated the effects of various factors such as arrival queuing, volume, terminal weather, en route weather, seasonal effects, and secular effects on airline’s delay times. Nonetheless, these studies do not differentiate among airlines and how they perform differently in term of on-time arrival rates.
Only a very few studies examined differences among airlines in the context of on-time performance. Peterson et al., (2013)[29] examined the economic impacts of flight delays, including airline costs, lost labor productivity for business travelers, opportunity cost of time for leisure travelers, and changes in consumer spending. The results indicated that a 10 percent reduction in flight delay would increase the US net welfare by $17.6 billion, and a 30 percent reduction in flight delay would increase the welfare by $38.5 billion [29].
Forbes et al., (2015) [15] examined a disclosure program for airlineon-time performance, which ranks airlines based on the proportion of their flights arriving less than 15 minutes of the scheduled time. The program creates incentives for airlines to focus their efforts on meeting that objective. The study found that airlines responded differently to these incentives. Despite the same incentives to increase the on-time arrival rates, airlines introduced different behaviors toward whether they should try to improve their on-time performance. Moreover, this heterogeneity correlates with internal airlines characteristics, including reporting technology and employee bonus [15].
Prince and Simon (2015) [30] examined whether incumbent airlines would improve their on-time performance in order to protect their market share upon the entry threats by Southwest Airlines. The study found that airlines did not improve their on-time arrival rates, and in fact, had worse on-time performance in that situation. This poor performance was explained by the cost-reduction strategy for intense post-entry price competition along with pre-entry deterrence, or by the post-entry differentiation strategy along with pre-entry accommodation.
Overall, while these studies provided some useful insights about how flight delays affected airlines and what had driven airlines to improve the on-time performance, they do not explicitly examine the difference of on-time performance among airlines. Additionally, no market segmentation has been developed for the airline market based on the on-time performance. This paper aims at filling this gap in the literature by conducting a cluster analysis of US airlines using the flight delay data.
Data was collected from the databases of Bureau of Transportation Statistics (BTS). The mission of BTS is “create, manage, and share transportation statistical knowledge with public and private transportation communities and the nation” (www.rita.dot.gov/bts/about). BTS databases provide data and statistics on flight on-time performance at both US airlines and US airports since January 1995. In addition, the site also provides demographic information of airlines. BTS compiles on-time performance data from monthly reports filed by commercial U.S. air carriers detailing operations and passenger traffic [5]. In order to ensure the quality of the data, BTS develops protocols to monitor the data collection process. Specifically, BTS implements a process control system to monitor data quality, verifies data entry to ensure the entry errors are within acceptable ranges, provides periodic training for data collectors, keeps track of the response rate, and evaluates the non-response bias [4]. Given these quality assurance efforts, this paper assumes that the on-time performance data provided by BTS is valid and usable at an acceptable confidence level.
In this paper, the on-time performance is measured by on-time arrival rate. The on-time performance data is affected by recent changes in the airline market. There are a number of structural changes in the airline market in the last decade including mergers between airlines and name changes that need to be taken into account during this data collection process [8].
- January 2006: US Airways (US) and America West (HP) merged and started to report jointly as US Airways (US).
- January 2010: Delta (DL) and Northwest (NW) merged and started to report jointly as Delta (DL).
- January. 2012: United (UA) and Continental (CO) merged and started to report jointly as United (UA).
- January 2012: Atlantic Southeast (EV) and ExpressJet (XE) merged and started to report jointly as ExpressJet (EV)
- August 2013: Pinnacle (9E) changed name to Endeavor.
- April 2014: American Eagle (MQ) changed name to Envoy.
- January 2015: Southwest (WN) and AirTran (FL) merged and startedto report jointly as Southwest (WN).
- July 2015: American (AA) and US Airways (US) merged and started to report jointly as American (AA).
In order to reflect the latest changes in the market, the merger between American and US Airways in July 2015, the data was collected between July 2015 and June 2016. This sample represents US airlines as they currently operate in the market, which provides more accurate interpretation of the airline segmentation. All demographic information of airlines was also collected during the same period of time.It is noted that BTS refers to airline data in 2016 using the data beginning in July 2015 and ending in June 2016.
The flight delay data is not available for following carriers: ATA, Aloha, America West, Atlantic Coast, Atlantic Southeast, Endeavor, and Mesa; so they were excluded from the analysis. In addition, there are only six months of delay data for Envoy Air (from July 2015 to December 15), and this airline was also omitted. Twelve US airlines included in this study are: Alaska Airlines Inc. (AS), American Airlines Inc. (AA), Delta Airlines (DL), ExpressJet Airlines (EV), Frontier Airlines Inc. (F9), Hawaiian Airlines (HA), JetBlue Airways (B6), SkyWest Airlines (OO), Southwest Airlines (WN), Spirit Airlines (NK), United Airlines Inc. (UA), and Virgin America (VX).
Table 2 presents the demographic information of these airlines. It can be seen that Southwest, American, and Delta are among the largest airlines in the market with more than one hundred million passengers in 2016, followed by United with more than 70 million passengers. Virgin America is the smallest one with merely seven million passengers this year. Revenue passenger miles (RPMs), the number of passengers multiplied by the number of miles flown, range from ten thousand miles (Express Jet) to more than 127 thousand miles (American). Similarly, available seat miles (ASMs), the number of seat available multiplied by the number of miles flown, range from twelve thousand miles (Express Jet) to 148 thousand miles (American). These numbers indicate that American has the highest capacity and air traffic, and Express Jet has the lowest capacity and air traffic. As for operating revenue and cost, Delta and American have the highest operating revenue of about $40 billion, while Express Jet has the lowest operating revenue of $908 million followed by Virgin America ($1.5 billion) and Frontier ($1.6 billion). On the other hand, Express Jet has the lowest operating cost of $926 million, followed by Virgin America ($1.2 billion) and Frontier ($1.3 billion). American has the highest operating cost of $34 billion, followed by Delta and United ($32 billion). As for the load factor, which equals RPM divided by ASM, there are not much differences among airlines. Frontier has the highest load factor of 87.9%, whereas Express Jet has the lowest load factor of 80.2%. Finally, the number of employees is proportional with the size of the airlines. American has the most full time and part time employees (more than 100 thousands employees), followed by United and Delta. On the other hand, Frontier and Virgin America have least employees (about three thousands).
Since different airlines have different total numbers of operations, delay data was scaled by the total operations to ensure the comparability among airlines. Thus, instead of using the raw numbers of delays and delayed minutes, this paper uses the percentage of flight delays and delayed minutes per operation. There are twelve delay variables included in the analysis: percentage of air carrier delay, percentage of extreme weather delay, percentage of NAS delay, percentage of security delay, percentage of late arriving delay, percentage of cancelled flights, percentage of diverted flights, air carrier delay time, extreme weather delay time, NAS delay time, security delay time, and late arriving delay time. Delay time is measured by delayed minutes per operation.
In addition, according to Hair et al., (2010) [36], cluster analysis using distance measures is quite sensitive to differing scales or magnitudes among the variables. Since the data still has different scales (percentage of delays and delayed minutes per operation), data standardization was performed to avoid circumstances, in which a variable’s influence on the cluster solution is greater than it should be. In order to standardize the data, the value of each variable was converted to a standard score, z-score, by subtracting the mean and dividing by the standard deviation. This conversion resulted in a standardized value with a mean of 0 and a standard deviation of 1, which eliminates the bias introduced by the differences in the scales of variables in the analysis [36]. Multicollinearity was not a concern with this data since these variables measure delays from different perspectives. In addition, SPSS 23 was used to detect outliers, and no extreme outliers were identified.
In order to segment airlines based on their on-time performance, a two-step cluster analysis was performed using SPSS 23 based on the recommendation of Hair et al. (2000) [36]. In step 1, a hierarchical cluster analysis was conducted to identify the number of clusters. In Step 2, a non-hierarchical cluster analysis was conducted to fine tune the clusters and then profile the cluster solution.
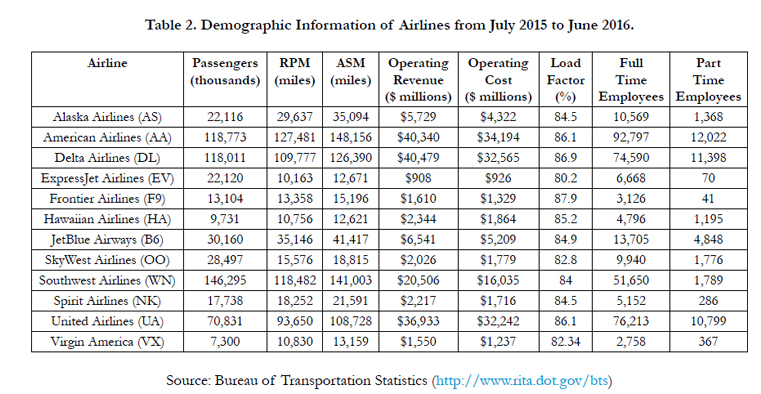
Table 2. Demographic Information of Airlines from July 2015 to June 2016.
The purpose of cluster analysis is to group airlines based on their similarities in on-time performance. A two-step cluster analysis was conducted as recommended by Hair et al., (2010)[36]. At Step 1, a hierarchical cluster analysis, a stepwise clustering procedure involving a combination of the objects into clusters, was conducted using SPSS 23. The Ward’s method was used as the clustering algorithm to generate clusters that are homogenous and relatively equal in size, and squared Euclidean distance was used to measure the similarity. The Ward’s method is a hierarchical clustering algorithm, in which the similarity used to join cluster is calculated as the sum of squares between the two clusters summed overall all variables. This method can deliver clusters of approximately equal size due to its minimization of within-group variation [25] Hair et al., 2010[36]). Additionally, Euclidean distance is the most commonly used measure of the similarity between two objects, or the length of a straight line drawn between two objectives when represented graphically [19]; Hair et al., 2010 [36]).
Figure 1 presents the dendrogram for this cluster analysis. Dendrogram indicates cases that are grouped together in a tree form. The squared Euclidean distance is shown on the horizontal axis. The dendrogram shows graphically how the clusters are combined at each step of the procedure. At first, each case is represented as a separate cluster then cases are gradually combined based on the similarities. The procedure stops when all cases are contained in single-member clusters. The heights of the tree branches indicate how different the clusters merged at that level of the tree are. The dendrogram indicated three possible clusters as shown by red dotted lines in Figure 1.
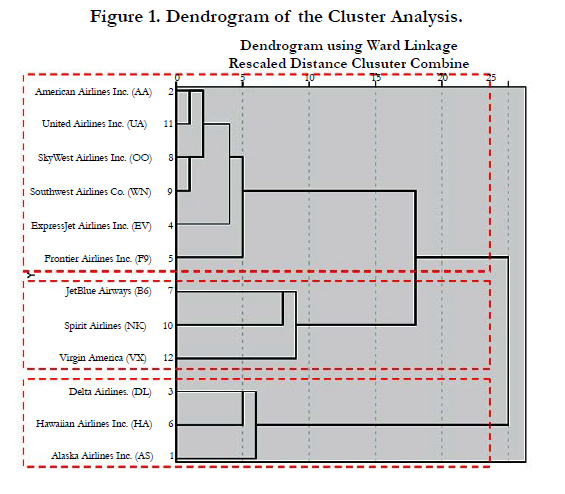
Figure 1. Dendrogram of the Cluster Analysis.
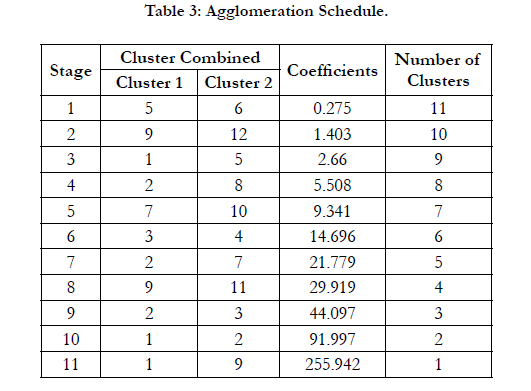
Table 3: Agglomeration Schedule.
The number of clusters was also determined by examining percentage changes in heterogeneity. The agglomeration coefficient was used for this purpose. Small coefficients indicate that fairly homogenous clusters are being merged, whereas joining two very different clusters results in a large coefficient. Table 3 shows the agglomeration schedule for this cluster analysis.It can be noted that there is a large increase of the agglomeration coefficient when moving from stage 9 to stage 10, suggesting a possible stopping point and indicating that the three cluster option is better than the two cluster option. Combining the dendrogram and agglomerations schedule, it was concluded that using three clusters was an appropriate choice.
At Step 2, a non-hierarchical cluster analysis using K-mean was conducted to fine-tune the cluster solution from the hierarchical process. According to Hair et al., (2010, p.531)[36], compared to hierarchical clustering method, non-hierarchical method has an advantage of being able to “better optimize cluster solutions by reassigning observations until maximum homogeneity within clusters is achieved”. The non-hierarchical cluster analysis has two steps: 1) specify cluster seeds, or starting points, for each cluster; 2) assign each case to one of the cluster seeds based on similarity. K-means clustering method was selected using three clusters. K-means algorithms partition data into a user-specified number of clusters and then iteratively reassign cases to clusters until a numerical goal related to cluster distinctiveness is met [36].
The results of K-means cluster analysis indicate the final cluster solution of three clusters with the cluster sizes of 3, 6, and 3. The final cluster solution is as follows.
• Cluster 1: Jet Blue, Spirit, Virgin America
• Cluster 2: American, Express Jet, Frontier, Sky West, Southwest, United
• Cluster 3: Alaska, Delta, Hawaiian
This cluster solution from K-means clustering isthe same as the clusters shown in the dendrogram in Step 1. It is noted that this cluster solution groups airlines based on their similarities in the on-time performance, not their size or financial status. There is a mix of large airlines and small airlines in some segments. For example, American, Southwest, and United are in the same segment with Express Jet, Frontier, and SkyWest, which are considerably smaller airlines. Similarly, Delta is in the same segment with Alaska and Hawaiian.
The model fit was evaluated using the F-value. MANOVA test shows the multivariate F-value of 15.14 (p<0.05), indicating the significant difference across three clusters. Table 4 presents standardized cluster means and univariate F-values of ANOVA test for each variable. F-values show that the means of seven out of twelve variables are significantly different across three clusters. The cluster distances also indicate the heterogeneity across three clusters. The larger the distance, the more the dissimilarity between two clusters. The distance between clusters 1 and 2 (3.642) is somewhat close to the distance between clusters 2 and 3 (3.85), while the distance between cluster 1 and 3 (5.422) is much larger than the other twos.
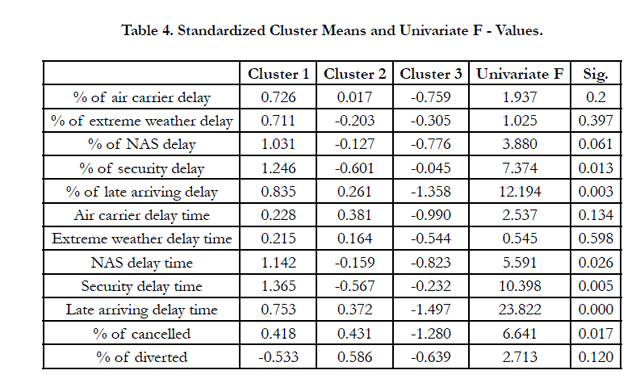
Table 4. Standardized Cluster Means and Univariate F - Values.
Figure 2 shows standardized mean differences across three clusters, while Figure 3 shows unstandardized cluster mean differences.The figures show that,in overall, cluster 3has the best ontime performance with the delay values below the average for all variables. Cluster 2 is about the average level, indicating acceptable on-time performance. Finally, cluster 1’s delay values are way above the average, indicating the worst on-time performance in the group. For the percentages of air carrier and extreme weather delays, differences among three clusters are non-significant, even though cluster 1 shows a little higher percentage of delays than clusters 2 and 3. More substantial differences can be seen on the percentages of NAS delay, security delay, and late arriving delay, with cluster 1 performing relatively worse than other twos. Figure 3 shows that the percentage of NAS delay for cluster 1 is almost 10%, whereas the percentage of NAS delay for cluster 3 is just over 3%. On the other hand, cluster 2 has the lowest percentage of security delay than clusters 1 and 3 (Figure 2). Cluster 3 again performs well in regard to late arriving delay (way below the average), while clusters 1 and 2 have the percentage of late arriving delay being above the average.
As for delayed minutes, cluster 3 has the lowest air carrier delay time and extreme weather delay time, while there are no differences between clusters 1 and 2 for these variables. On the other hand, cluster 1 has the worst NAS delay time and security delay time compared to clusters 2 and 3. As for late arriving delay time, cluster 3 again has the lowest delay time (way below the average), while clusters 1 and 2 have above average delay times.Finally, clusters 1 and 3 have the percentage of cancelled flights below average, while the percentage of diverted flights for cluster 2 is above the average.
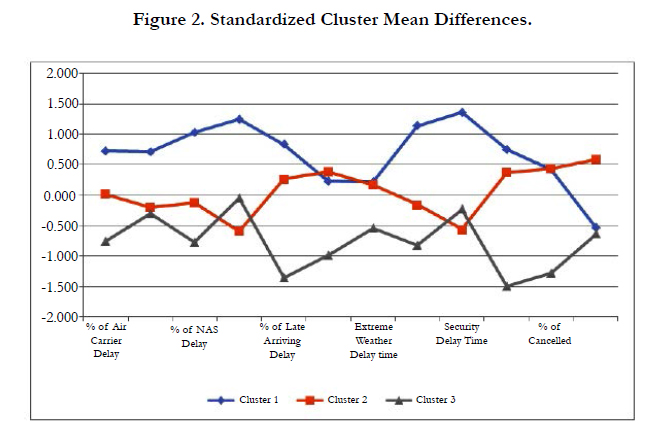
Figure 2. Standardized Cluster Mean Differences.
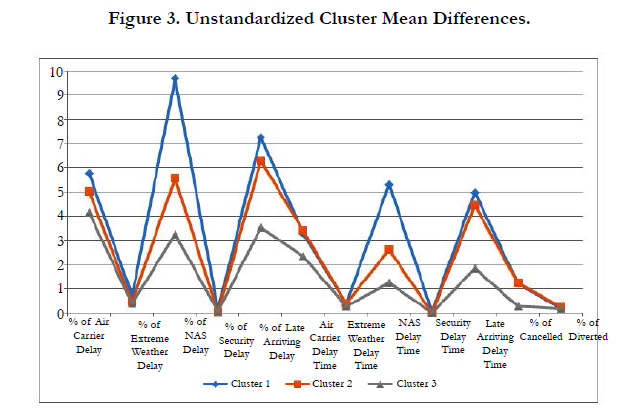
Figure 3. Unstandardized Cluster Mean Differences.
Overall, the cluster analysis indicates substantial differences of delay variables across three clusters. Based on these results, the on-time performance of each cluster can be interpreted as follows:
- Cluster 1 has three airlines (Jet Blue, Spirit, and Virgin America) and is most distinguished with the relative high mean for most delay variables, except for air carrier delay time, extreme weather delay time, and percentage of diverted flights. Thus, this cluster represents a segment characterized by poor ontime performance both in term of frequency of delays and delayed minutes.
- Cluster 2 has six airlines (American, Southwest, United, Express Jet, Frontier, and Sky West) and is distinguished by moderate delay values on the percentage of air carrier delay, percentage of extreme weather delay, percentage of NAS delay, extreme weather delay time, and NAS delay time. It has a relatively low percentage of security delay and security delay time compared to other clusters. On the other hand, it has above average percentage of late arriving delay, air carrier delay time, late arriving delay time, percentage of cancelled flights, and percentage of diverted flights. Overall, this cluster represents a segment characterized by moderate on-time performance.
- Cluster 3 has three airlines (Alaska, Delta, and Hawaiian) and is distinguished by a relatively low mean for most variables, except for the percentage of security delay which is at the average level. They perform particularly well in term of percentage of late arriving delay, air carrier delay time, NAS delay time, late arriving delay time, and percentage of cancelled flights. It is worthy to note that this cluster outperforms other two clusters in most delay variables, except for the percentage of security delay and security delay time, where it ties with cluster 2. Overall, this cluster represents a segment characterized by very good on-time performance in the market.
With all clusters being formed and interpreted, cluster profiling is needed to compare characteristics of these three clusters in order to help airline executives and passengers understand these segments in the market and make meaningful decisions. Clusters are profiled based on the number of passengers, revenue passenger miles (RPM), available seat miles (ASM), operating revenue, operating cost, load factor, and employment (full-time and part-time). Table 5 and Figure 4 show the comparison of these profiling characteristics across three clusters.
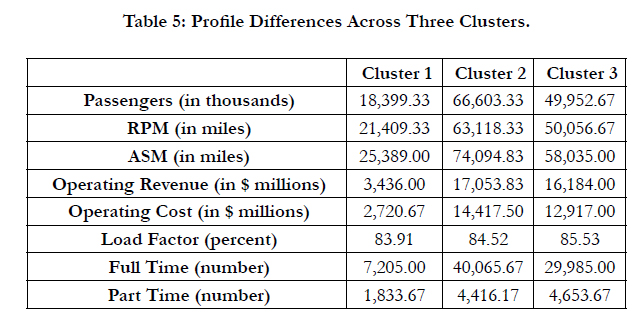
Table 5: Profile Differences Across Three Clusters.
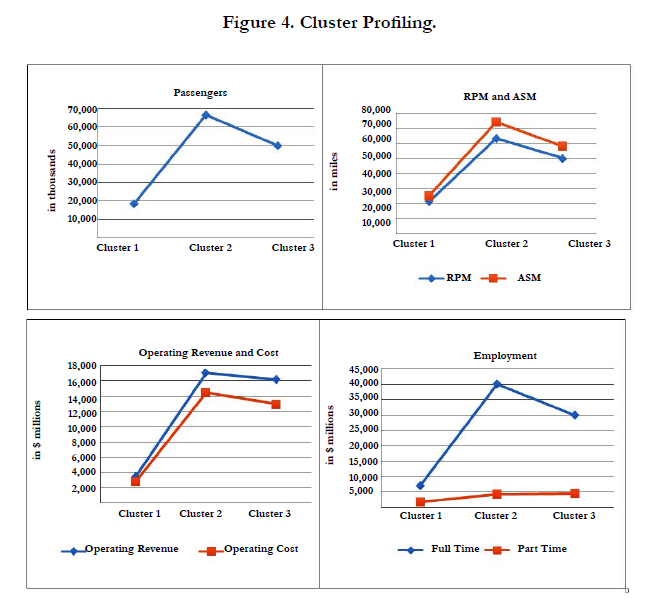
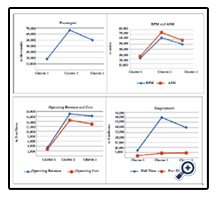
Figure 4. Cluster Profiling.
Overall, cluster 1 has a relative lower number of passengers, RPM, ASM, operating revenue, operating cost, and employment than other two clusters. These distinguished characteristics are explained by examining the airlines in this segment - Jet Blue, Spirit, and Virgin America. These are relatively small airlines in the market. Nevertheless, as discussed before, this cluster represents a segment with the lowest on-time performance in the market, which may affect their overall success. They will need to form necessary strategies to improve the flight on-time performance to be more competitive and attract more passengers. In addition, while the load factor of this segment is not far below the market average, this lowest load factor in the market suggests that they need to improve their operational efficiency as well.
Cluster 2 contains the highest number of airlines, in which American, United, and Southwest are large airlines. Note that American had merged with US Airways, United had merged with Continental, and Southwest had merged with AirTran. Accordingly, this cluster represents the largest segment with the highest average number of passengers, highest RPM and ASM, and largest employment in the market. However, it is noted that the operating revenue of this cluster is not much higher than cluster 3 (with a difference of less than $1 million). Along with the moderate load factor, this suggests that the efficiency of this segment can be further improved. Overall, this cluster represents a segment with moderate on-time performance in the market. To be more competitive and gain more market shares in the market, they still need to enhance strategies to improve their on-time performance further.
Cluster 3 has only one large airline, Delta that had merged with Northwest, and two small airlines, Alaska and Hawaiian. This cluster has a medium number of passengers, RPM, ASM, and employment. However, they have rather large operating revenue, almost the same as cluster 2, which is much larger in size. It also has the highest load factor among three clusters. This shows the efficiency of this segment in the travel business. As mentioned before, this cluster represents a segment with the best on-time performance in the market.
Discussion and Conclusion
Airline on-time performance has substantial economic impacts on the airline industry, in general, and on individual airlines and passengers, in particular. The frequency of delays and delayed times will cost airlines tremendously due to lost productivity, passenger complaints, increased flight time, passenger loss, food and lodging expenses, operating costs, fuel costs, and poor airline image. Passengers are also negatively affected by the delays, such as stress, cancelled flights, missing connected flights, disrupted schedule, and health impact. BTS (2016) classifies flight delay causes in to air carrier delay, extreme weather delay, NAS delay, security delay, and late arriving delay. In addition, there are cancelled and diverted flights. Airlines in the US have been performing differently in regard to on-time arrival rates; some do better than others. Understanding the similarities and differences of airline’s on-time performance in the airline market provides both airlines and passengers with useful information that would support them in the decision making process.
This paper fills the gap in the literature by developing airline segmentation based on the on-time performance using cluster analysis. The data from July 2015 to June 2016 in the US airline market was used for the cluster analysis based on delay variables - air carrier delay percentage, extreme weather delay, NAS delay, security delay, late arriving delay (both in percentage of delays and delayed minutes) – and percentages of cancelled flights and diverted flights. Results of the cluster analysis indicate three major segments of the US airline market in term of airline on-time performance. Cluster 1 consists of three relatively small airlines (Jet Blue, Spirit, and Virgin America). This segment has the lowest number of passengers, RPM, ASM, operating cost and revenue, load factor, and employment. It represents the segment with the worst on-time performance in the market, in which most delay frequencies and delay times are way above the average level. Cluster 2 consists of six airlines, three of them are large airlines (American, United, and Southwest) and others are smaller ones (Express Jet, Frontier, and Sky West). Compared to other segments, this cluster represents the largest segment in the US airline market. It has the highest number of passengers, RPM, ASM, operating cost and revenue, and employment. However, size is not necessarily proportional with good performance. This segment only has moderate on-time performance in the market. Finally, cluster 3 consists of three airlines (Delta, Alaska, and Hawaiian), in which Delta is the only large airline. While this segment has less passengers, RPM, ASM, operating costs, and employment than cluster 2, it is worthy to note that its operating revenue is close to cluster 2’s operating revenue, and it has the highest load factor among three segments. As for on-time performance, this segment has the lowest (way below the average) delay frequencies and delay times for most delay variables; in other words, it has the best on-time performance in the market. These indicate the high efficiency of airlines in this segment.
This paper provides important theoretical and practical implications. From the theoretical perspective, the paper is among first studies that develop the airline segmentation based on the ontime performance. The paper indicates three main clusters representing three segments in the US airline market. The results show how these segments perform differently in term of on-time arrival rates, and characteristics of airlines in each segment. From the practical perspectives, the developed airline segmentation provides both airlines and passengers with useful information to support their decision making process. Airlines can view their current segment in the market, and their on-time performance in comparison to other segments. This would help them evaluate the current economic impact of flight delays on their business and their current competitive status in the market, based on these they can form necessary strategies to enhance their performance and improve the competitiveness. Airlines in segment 1 perform worst in the market and are likely affected most by flight delays. They will need a lot of improvements in on-time performance and appropriate strategies to increase the efficiency to gain profitability and survive in this competitive market. Airlines in segment 2 are performing at the average level and need to continue to enhance their performance if they want to increase their profitability and gain more market shares. Airlines in segment 3 are performing well; nevertheless, they need to keep their strengths and continuous improvement to retain their current competitive status. Passengers can also benefit from these results. The segmentation in the US airline market provides passengers with useful information about how airlines are performing in term of on-time arrival rates. Through examining airlines in these segments, they can evaluate their priorities in regard to flight on-time performance and decide which airlines they should select for next travel.
This paper has some limitations. In order to reflect the current changes in the US airline market, the paper uses data collected from July 2015 to June 2016, so the segmentation only reflects that period of time. More data in the future can be collected to validate the segmentation. In addition, this paper focuses mainly on US airlines due to the availability of delay data on BTS website. It does not account for international airlines that fly from and to the US. Accordingly, international connecting flights are not included in the analysis even though they may have effects on the on-time performance of domestic airlines. In some cases, flights may have to be hold for international connecting passengers. Additionally, some airplanes arriving from aboard may be used for domestic operations.
Future research should focus on collect more delay data in the future and redevelop the clusters for US airlines. Airline segmentation can also be done with international airlines to provide a more comprehensive segmentation in the global market. In addition, the dynamism of the airline market may result in future airline mergers and/or structural changes. Future research should examine how these changes may affect the airline segmentation. Finally, more studies should focus on how the on-time performance can affect the load factors and popularity of airlines. A model evaluating the effects of on-time performance and other factors such as airline’s network and prices on the passenger choice for an airline can be developed and tested. The results of such study will provide airlines with useful information to improve their competitiveness and increase the market share.
References
- A4A (2016a) Airlines for America projects U.S. airlines to carry 15.6 million passengers over labor day travel period, an increase of 82,000 travelers a day over last year. Airlines for America Press.
- A4A (2016b) Per-minute cost of delays to U.S. airlines. Airlines for America.
- Barros CP, Liang QB, Peypoch N (2013) The technical efficiency of US airlines. Transportation Research Part A: Policy and Practice. 50: 139-148.
- BTS (2005) BTS Statistical Standards Manual. Bureau of Transportation Statistics, 2005.
- BTS (2016a) Airlines report 11 tarmac delays over three hours on domestic flights, 10 tarmac delays over four hours on international flights in July. Bureau of Transportation Statistics Press, 2016.
- BTS (2016b) Airline on-time statistics and delay causes. Bureau of Transportation Statistics Database, 2016.
- BTS (2016c) Understanding the reporting of causes of flight delays and cancellations. Bureau of Transportation Statistics, 2016.
- BTS (2016d) Airline on-time statistics. Bureau of Transportation Statistics.
- Chang Y, Park H, Jeong J, Lee J (2014) Evaluating economic and environmental efficiency of global airlines: A SBM-DEA approach. Transportation Research Part D: Transport and Environment. 27: 46-50.
- Choo YY, Oum TH (2013) Impacts of low cost carrier services on efficiency of the major U.S. airports. J Air Transp Manag. 33: 60-67.
- Cui Q, Li Y (2015) Evaluating energy efficiency for airlines: An application of VFB-DEA. J Air Transp Manag. 44/45: 34-41.
- Daft J, Albers S (2012) A profitability analysis of low-cost long-haul flight operations. J Air Transp Manag. 19: 49-54.
- Daraban B (2012) The low cost carrier revolution continues: Evidence from the US airline industry. JBER. 10(1): 37-44.
- Elking I, Windle R (2014) Examining differences in short-haul and longhaul markets in US commercial airline passenger demand. Transp J. 53(4): 424-452.
- Forbes SJ, Lederman M, Tombe T (2015) Quality disclosure programs and internal organizational practices: Evidence from airline flight delays. Am Econ J Microecon. 7(2): 1-26.
- Gillen D, Morrison W (2003) Bundling, integration and the delivered price of air travel: Are low cost carriers full service competitors? J Air Transp Manag. 9(1): 15-23.
- Hansen M, Hsiao C (2005) Going south?: Econometric analysis of U.S. airline flight delays from 2000 to 2004. Transp Res Rec: J Transp Res Board. 1915: 85-94.
- Hsiao C, Hansen M (2006) Econometric analysis of U.S. airline flight delays with time-of-day effects. Transp Res Rec: J Transp Res Board. 1951: 104-112.
- Jain AK, Murty MN, Flynn PJ (1999) Data clustering: A review. ACM Computing Surveys. 31(3): 264-323.
- Jiang H (2013) Service quality of low-cost long-haul airlines – The case of Jetstar Airways and AirAsia X. J Air Transp Manag. 26: 20-24.
- Lerrthaitrakul W, Panjakajornsak V (2014) The airline service quality affecting post purchase behavioral intention: Empirical evidence from the low cost airline industry. IJTEF. 5(2): 155-158.
- Mallikarjun S (2015) Efficiency of US airlines: A strategic operating model. J Air Transp Manag. 43: 46-56.
- Marti L, Puertas R, Calafat C (2015) Efficiency of airlines: Hub and spoke versus point-to-point. J Econ Stud. 42(1): 157-166.
- Mikulic J, Prebezac D (2011) What drives passenger loyalty to traditional and low-cost airlines? A formative partial least squares approach. J Air transp Manag. 17(4): 237-240.
- Milligan GW (1979) Ultrametric Hierarchical Clustering Algorithms. Psychometrika. 44(3): 343–346.
- Murakami, Hideki (2011) Time effect of low-cost carrier entry and social welfare in US large air markets. Transp Res Part E. 47(3): 306-314.
- O’Connell JF, Williams G (2005) Passengers’ perceptions of low cost airlines and full service carriers: A case study involving Ryanair, Aer Lingus, Air Asia and Malaysia Airlines. J Air Transp Manag. 11(4): 259-272.
- Pels E (2008) Airline network competition: Full-service airlines, low-cost airlines and long-haul markets. Res Transp Econ. 24(1): 68-74.
- Peterson EB, Neels K, Barczi N, Graham T (2013) The economic cost of airline flight delay. JTEP. 47(1): 107-121.
- Prince JT, Simon DH (2014) Do incumbents improve service quality in response to entry? Evidence from airlines' on-time performance. Manag Sci. 61(2): 372-390.
- Wensveen JG, Leick R (2009) The long-haul low-cost carrier: A unique business model. J Air Transp Manag. 15(3): 127-133.
- Wu CL, Caves R (2003) The punctuality performance of aircraft rotations in a network of airports. Transport Plan Techn. 26(5): 417-436.
- Zou B, Elke M, Hansen M, Kafle N (2014) Evaluating air carrier fuel efficiency in the US airline industry. Transp Res Part A: Policy Pract. 59: 306- 330.
- Abdelghany KF, Shah SS, Raina S, Abdelghany FA (2004) A Model for Projecting Flight Delays during Irregular Operation Conditions. JATM. 10(6): 385 – 394.
- Hansen M, Hsiao C (2005) Going South? An Econometric Analysis Of US Airline Flight Delays From 2000 To 2004. TRR: J TRB. 1915: 85 – 94.
- Hair JF, Black WC, Babin BJ, Anderson RE (2010) Multivariate Data Analysis. (7th Edn), Upper Saddle River, NJ: Prentice Hall, US.


