A Comparison of Radiographic Acetabular Measurements in Elderly Patients with and without Osteoarthritis
Samona J*, Elia C, Les C, Jackson A, Little B, Darwiche H, Vaidya R
Detroit Medical Center, McLaren Regional Medical Center, USA.
*Corresponding Author
Jason Samona DO,
Detroit Medical Center, McLaren Regional Medical Center,
USA.
Tel: 248-9396263
E-mail: jasonsamona@yahoo.com
Received: November 29, 2015; Accepted: January 07, 2016; Published: January 11, 2016
Citation: Samona J et al., (2016) A Comparison of Radiographic Acetabular Measurements in Elderly Patients with and without Osteoarthritis Int J Anat Appl Physiol. 2(1), 14-19. doi: dx.doi.org/10.19070/2572-7451-160002
Copyright: Samona J© 2016. This is an open-access article distributed under the terms of the Creative Commons Attribution License, which permits unrestricted use, distribution and reproduction in any medium, provided the original author and source are credited.
Abstract
This paper analyzed anatomical similarities and differences of the acetabulum between patients with hip OA, compared to patients without OA.
Review of AP pelvic radiographs in patients with femoral neck fractures (patients with OA were excluded) and patients with OA of the hip scheduled for THA.
No significant difference exists in AI or CE angle between the 2 groups, but patients without OA had a significantly higher DW ratio. Depth: Width CE angle ratio increased significantly with age in both the entire sample, and in the female-only subgroup.
The study provides radiographic means to measure normal values which can serve as a possible reference point for proper prosthesis placement in total hip arthroplasty procedures and in hip fracture repair
2.Materials and Methods
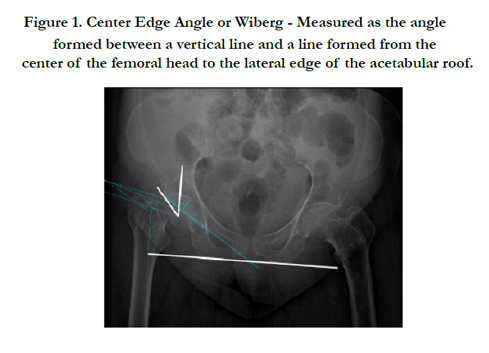
2.1.Center Edge Angle
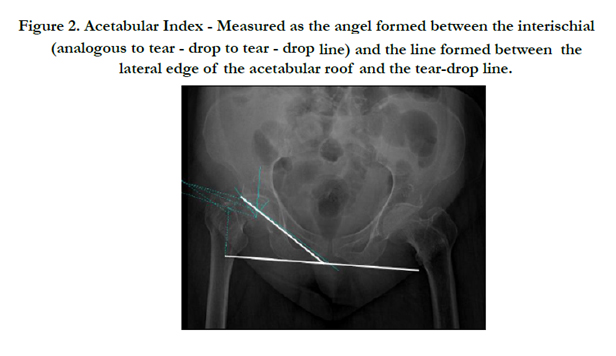
2.2.Acetabular Index
2.3.Acetabular Depth/Width Ratio
3.Results
4.Discussion
5.References
Introduction
Osteoarthritis is a degenerative joint disease affecting the articular cartilage and osseous structures of the effected joints. This disease is more common in women than in men, and has numerous predisposing factors, including previous injury to a joint, obesity, as well as numerous genetic components [1-3]. Primary, or idiopathic, OA has been correlated with femoral acetabular impingement (FAI) and developmental dysplasia of the hip (DDH) [5]. DDH is generally accepted as an etiology of hip OA and is categorized as primary or secondary to dislocation or subluxation.
To better understand acetabular development in patients with primary acetabular dysplasia (PAD), Kobayashi et al., studied the center edge angle (CEA) and Sharp’s angle (acetabular index) of the unaffected contralateral hip of patients diagnosed with unilateral developmental dysplasia of the hip. He noted significant differences in the measurements of children after the age of six years, with the critical point of measurement at twelve years of age. They also found that patients with a CE angle of <15° did not develop a normal acetabulum [6]. Rhee et al. [7] investigated measurements such as the Shenton line in skeletally mature patients to assess proximal femoral subluxation an indication of acetabular dysplasia. Jacobsen et al. [8] describe hip dysplasia and age as being associated with hip OA, using joint-space width <2mm on plain radiographs as the indicator for hip OA.
When assessing hip anatomy on plain films, CEA, Acetabular Index (AI) and Depth:Width (D:W) ratio are commonly used [9]. Accepted normal values for adults for the CEA and AI angles have been established through past research, most notably for younger patients (between 20-30 years of age) [10, 11]. There is limited or no data available pertaining to normal values for CEA, AI and D:W ratio in elderly patients. The elderly population is the sector of the population most notably effected by OA, and therefore most likely to receive orthopedic intervention such as arthroplasty to combat this pathology, or hip fracture repair in the trauma setting.
The purpose of this article is to analyze the anatomical acetabular measurements in elderly patients, and compare these measurements in patients who have already developed osteoarthritis of the hip verses those elderly patients who have not. We will compare these parameters to previously identified normal reference ranges. This may in turn allow us to better understand the anatomical differences driving the needs for arthroplasty, while obtaining an overall improved understanding of the osseous anatomical variants of the hip. These values may also serve as a guide to the orthopedic surgeon in terms of proper prosthesis placement and need for osseous modification through surgical means to obtain a more anatomically acceptable placement for total arthroplasty components and hip fracture repair prostheses. We hypothesize that there will be marked differences between the two groups in all measurement parameters.
Materials and Methods
This study was an IRB-approved retrospective review preformed on 282 patients at our Institution which is a Level one Trauma Center which also has a robust Arthroplasty service. Pelvic AP radiographs of 141 consecutive patients suffering from acute femoral neck fractures with no evidence of OA and 141 patients diagnosed with symptomatic OA scheduled for THA were included in the study. Patients were excluded from the study if they had previous fractures at the hip in question, neoplastic and post traumatic OA or poor x-rays.
A sample size of convenience was utilized. The data from both groups were collected and compared to one another. All data was obtained from the hospital PACS system (CIS Cerner USA) hip radiographs ranging over a 5 year period. There was no exclusion based on race or gender.
The non-OA group consisted of 49 male patients and 92 female patients. The age range of this group ranged from 33 – 97 years with an average age of 73 years.
The osteoarthritis group consisted of 68 male and 73 female patients. The age range of this group ranged from 33 – 85 years with an average age of 58 years.
Radiographic measurements between the two groups consisted of the center edge angle of Wiberg (CEA, degrees), acetabular depth/width ratio (D:W) and acetabular index (AI, degrees) [12, 13]. Two analysts (CE, JS) made the measurements; the final measurement for each patient was the average of the two observations. The method in which each individual measurement was obtained is explained below.
The CEA was measured according to the protocol described by Wiberg et al. in 1939 [13]. A horizontal line is created on the AP Pelvis radiograph in respect to the patient’s orientation, via creating a straight line from the inferior point of one teardrop line to the inferior point of the contralateral tear-drop line. This “horizontal” could also be recreated by measuring from the inferior margin of one ischium to the inferior margin of the contralateral ischium, thus ensuring accuracy by comparing for parallelism between these two horizontal lines. An angle was then drawn, extending from the lateral edge of the acetabulum to the center of the femoral head and then extending vertically from that point. (Figure 1).
The protocol described by Sharp et al. in 1961 was used to obtain this measurement [12]. A line extending from the lateral edge of the acetabulum was made to intersect the inferior point of the tear-drop line. The “horizontal”, as previously described, was used to form a resultant angle when these lines were made to intersect, designated as the acetabular index (Figure 2).
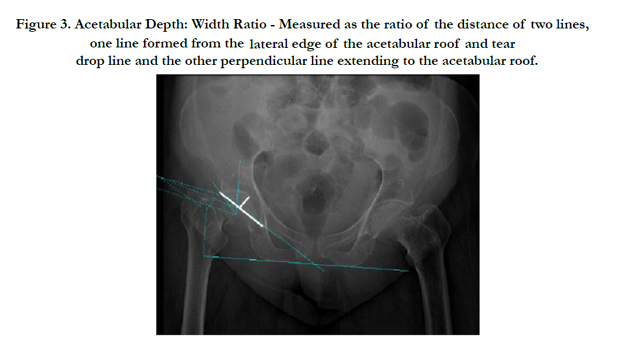
Stulberg and Cooperman et al. set forth the manner in which the depth:width ratio was measured in this paper [14, 15]. A line starting at the superior lateral edge of the acetabulum extended to the more inferior tear-drop, thus designating the acetabular width. A second line, representative of acetabular depth, is drawn perpendicular to the previous line representative of the acetabular width. This depth line began at the center of the width line, and extended to the center most roof of the acetabulum (Figure 3).
For each of the measured parameters (Acetabular index, Depth: Width ratio, and CE angle), as well as for patient age, the effect of diagnosis (OA or fracture) and gender was evaluated with a twoway ANOVA, with post-hoc Fisher’s LSD test. For the ANOVAe, alpha was set to 0.05 for main effects, and to 0.10 for interactions. Alpha was then set to 0.05 for post-hoc tests (SigmaPlot 12.0, Systat Software, Inc.).
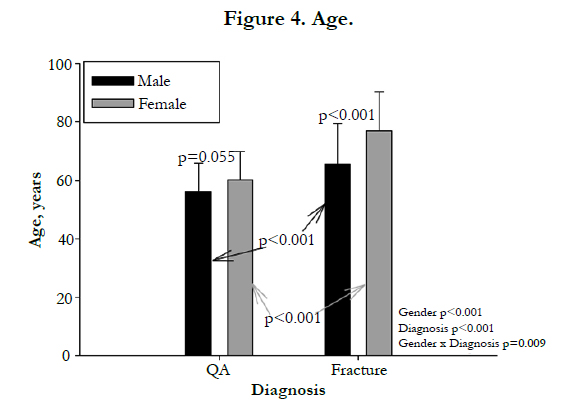
When it became apparent that there were significant differences in patient age between both diagnostic groups and genders, linear regressions were performed between age and each of our measured parameters, for each gender:diagnosis group. Alpha = 0.05 (Figure 4).
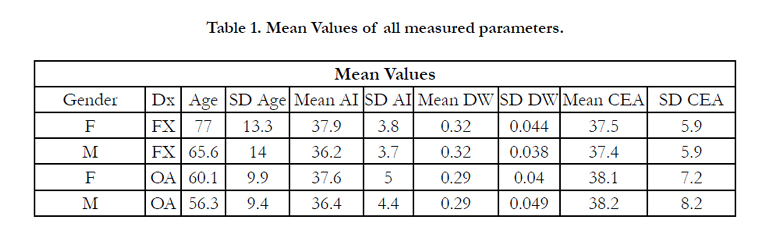
Results (please refer to table 1)
Age: Gender p<0.001 (F>M), Dx p<0.001 (Fx> OA), Interaction p=0.009, Males alone: Fx> OA, p<0.001, Females alone: Fx> OA, p<0.001, OA alone: F NSD M (p=0.055), Fx alone: F > M, p<0.001.
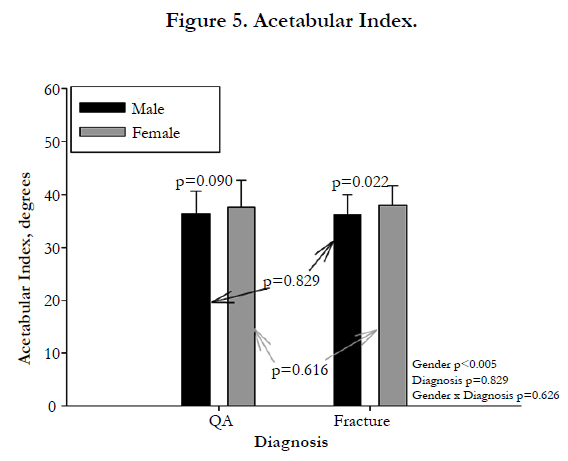
AI: Gender p=0.005 (F > M), Dx p=0.876, Interaction p=0.626 (Figure 5)
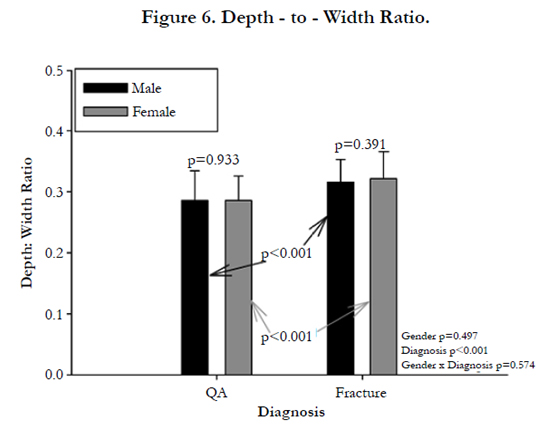
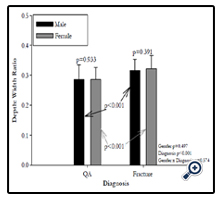
DW: Gender p=0.497, Dx p<0.001 (Fx> OA), Interaction p=0.574 (Figure 6)
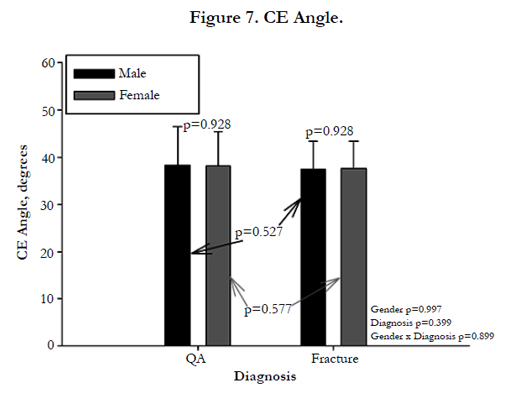
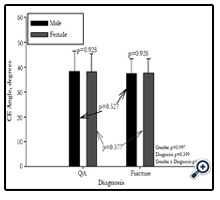
CEA: Gender p=0.997, Dx p=0.399, Interaction p=0.899(Figure 7)

Relationship between CEA and AI
If Dysplasia is defined as CEA <= 25
0/141 found in non-OA group
4/141 found in OA group
Chi-square p=0.131, power =0.309
If Dysplasia is defined as CEA <=20
0/141 found in non-OA group
1/141 found in OA group
Chi-square p=1.000, power=0.047
Using a 3-way CEA dysplasia definition (>25:Normal, 20-25: Dysplasia, <=20: Severely dysplastic)
Chi-square p=0.131, power=0.407
If Dysplasia is defined as AI>=43
7/141 found in non-OA group
11/141 found in OA group
Chi-square p=0.055, power=0.471
Trend: more dysplasia than expected in the OA group
Fracture patients were significantly older than OA patients, both overall and within each gender. Women in the study were significantly older than the men, both overall and within each diagnostic group.
Acetabular Index was not demonstrably related to patient age in any subgroup (p > 0.14). Depth:Width ratio increased significantly with age in both the entire sample, and in the femaleonly subgroup (p < 0.008); in neither case did the adjusted r^2 for the regression exceed 0.039. CE Angle increased significantly with age in both the OA and the OA Female subgroups (p < 0.05); in neither case did the adjusted r^2 for the regression exceed 0.043.
Females in the study had a significantly higher Acetabular Index than did males. This appeared to be largely driven by differences in the fracture patients. There was no demonstrable effect of diagnosis on this parameter, nor was there a significantly demonstrable interaction between diagnosis and gender.
Fracture patients had a significantly higher Depth: Width ratio than did OA patients, for both males and females. There was no demonstrable effect of gender on this parameter, nor was there a significant interaction between diagnosis and gender.
There was no demonstrable effect of either diagnosis or gender on CE angle, nor was there a statistically demonstrable interaction between diagnosis and gender.
Discussion
Through extensive radiographic evaluation, it is evident no difference in AI (34.955 F vs 38.952 OA) (p=0.764) or CE angle (36.082 F vs 31.304 OA) exists between the 2 study groups(p=0.302). In those individuals without a known diagnosis of OA, they had a significantly higher DW ratio than those with known OA (0.278 vs 0.314) (p<0.001). Overall, the Depth:Width CE angle ratio increased significantly with age in both the entire sample, and in the female-only subgroup (p<0.008); in neither case did the adjusted r^2 for the regression exceed 0.039.
If we only included patients greater than or older than 70 years of age, the averages for AI would be 37.05 OA vs 37.66 F, CE would average 39.24 OA vs 37.77 F, as compared to D:W averaging .281 OA vs .322 F. These trends follow the same statistical pattern of no significant difference between AI or CE angle between the Fracture and Osteoarthrits groups, but there indeed is a significant difference between these 2 groups in terms of D:W ratio.
Through extensive radiographic evaluation of anterior-posterior pelvic x-rays to analyze anatomical variances between patients with OA and non-OA patients, our data revealed acetabulardepth:width ratio between the two groups to have a statistically significant difference. This may be due to joint space narrowing associated with OA, therefore decreasing the anticipated value of the depth:width ratio in the OA group. Further analysis in pre and post arthritic changes in hips comparing the change in the depth:width ratio may identify trends that can better correlate with an anatomical predisposition.
There was no statistically significant difference between the two diagnostic groups with respect to CEA or AI. Moreover, the difference between diagnostic groups in these parameters was less than our inter-observer variation. These findings suggest that the differences between groups may not be clinically relevant.
Fowkes et al. studied 200 AP hip radiographs to identify normal reference ranges for CE angle and AI in men and women. They found a mean CE angle measurement of 36.3° (SD 13.8°), 37.7° for men and 34.9° for women. With respect to AI, they found a mean measurement of 38.8° (2SD 32.1-45.5°), 38.0° in men and 39.6° in women [10]. The average values of the measured parameters of this study correspond within one standard deviation of the average numbers obtained by Fowkes et al. This suggests that the values obtained in this study for both groups are within the normal reference range identified by Fowkes et al and that there is no anatomical difference between the OA and fracture groups with respect to the CEA and AI.
Although our data did not show any significant differences between the two diagnostic groups with respect to CEA and AI, it has limitations. Plain radiographs are effected by the technique and the position of the pelvis at the time of the x-ray. Perhaps CT scans will show a difference if they are examined. Although this is difficult to do as we do not recommend the routine use of CT scans on patients with arthritis. Also, we did have a difference in the age of our fracture patients compared to those with arthritis. This could be a potential limitation if it had any effect on the different diagnosis group. However the older age of the non osteoarthritic patients is a benefit as it shows that these more elderly patients despite increased age still did not show much change from the OA patients. The OA patients included in this study suffered from severe symptomatic osteoarthritis whom had failed previous non-surgical means of treatment to resolve their symptoms, which would deem them adequate surgical candidates for total joint arthroplasty.
In this study we found that there were no significant differences that could be found between the two groups when measuring the CE angle and acetabular index. We did do a calculation to show how many individuals it would take to show a significant difference we need to include that here. Although these measurements are used in pediatric population to identify DDH and show correlation with OA, this assumption cannot be made in the adult population using these parameters. The DW ratio was significantly different and may be a risk factor for developing OA, but most likely it is a late radiographic finding related to the presence of OA. We do not believe that the acetabular shape will predispose adult patients to the development of OA. The results do not support a direct correlation between acetabular shape and future development of OA. The authors of this study believe the coupling mechanism between the acetabulum and femoral head is of greater important compared to looking at each morphology and radiographic findings in isolation. The measurements of this study provide radiographic means to measure normal values for osseous structures which can serve as a possible reference point for proper prosthesis placement in total hip arthroplasty procedures and in hip fracture repair. Further investigation measuring other hip parameters comparing patients with normal hips to OA hips may be warranted in future studies, along with utilization of these measurements to recreate hip anatomy in the surgical theatre in order to obtain more anatomically acceptable prosthesis placement.
References
- Hartz AJ, Fischer ME, Bril G, Kelber S, Rupley D Jr, et al. (1986) The association of obesity with joint pain and osteoarthritis in the HANES data. J Chronic Dis 39(4): 311-319.
- Jordan JM, Luta G, Renner JB, Linder GF, Dragomir A, et al. (1996) Selfreported functional status in osteoarthritis of the knee in a rural southern community: the role of sociodemographic factors, obesity, and knee pain. Arthritis Care Res 9(4): 273-278.
- Felson DT, Zhang Y, Anthony JM, Naimark A, Anderson JJ (1992) Weight loss reduces the risk for symptomatic knee osteoarthritis in women. The Framingham Study. Ann Intern Med 116(7): 535-539.
- Brandt K (1997) Osteoarthritis: Clinical patterns and pathology. In: Textbook of Rheumatology, (5th edtn), W.B. Saunders, Philadelphia. 1383.
- Ganz R, Leunig M, Leunig-Ganz K, Harris WH (2008) The etiology of osteoarthritis of the hip: an integrated mechanical concept. Clin Orthop Relat Res 466(2): 264-272.
- Kobayashi D, Satsuma S, Kuroda R, Kurosaka M (2010) Acetabular development in the contralateral hip in patients with unilateral developmental dysplasia of the hip. J Bone Joint Surg Am 92(6): 1390-1397.
- Rhee PC, Woodcock JA, Clohisy JC, Millis M, Sucato DJ, et al. (2011) The Shenton line in the diagnosis of acetabular dysplasia in the skeletally mature patient. J Bone Joint Surg Am 93(Suppl 2): 35-39.
- Jacobsen S, Sonne-Holm S (2005) Hip dysplasia: a significant risk factor for the development of hip osteoarthritis. A cross-sectional survey. Rheumatology (Oxford) 44(2): 211-218.
- Nelitz M, Guenther KP, Gunkel S, Puhl W (1999) Reliability of radiological measurements in the assessment of hip dysplasia in adults. Br J Radiol 72(856): 331-334.
- Fowkes LA, Petridou E, Zagorski C, Karuppiah A, Toms AP (2011) Defining a reference range of acetabular inclination and center-edge angle of the hip in asymptomatic individuals. Skeletal Radiol 40(11): 1427-1434.
- Werner CM, Copeland CE, Ruckstuhl T, Stromberg J, Turen CH, et al. (2011) Relationship between Wiberg's lateral center edge angle, Lequesne's acetabular index, and medial acetabular bone stock. Skeletal Radiol 40(11): 1435-1439.
- Sharp IK (1961) Acetabular dysplasia: the acetabular angle. J Bone Joint Surg Br 43:268–272.
- Wiberg G (1939) Studies on dysplastic acetabular and congenital subluxation of the hip joint: with special reference to the complications of osteoarthritis. Acta Chir Scand 83(Suppl 58).
- Stulberg SD, Harris WH (1974) Acetabular dysplasia and development of osteoarthritis of hip. In: The Hip. Proceedings of the Second Open Scientific Meeting of the Hip Society. Mosby, St Louis. 82-93.
- Cooperman DR, Wallensten R, Stulberg SD (1983) Acetabular dysplasia in the adult. Clin Orthop Relat Res (175): 79-85.


