BMI-For-Age Cut-Off as an Indicator of Adiposity among In-School Children (Age 4-11 Years) in Obio/Akpor LGA, Rivers State, Nigeria
Aigbogun EO Jr1, Ibeachu PC2*, Ikechukwu E3
1 Department of Human Anatomy, Centre for Occupational Health, Safety and Environment, University of Port Harcourt, Rivers State, Nigeria.
2 Faculty of Basic Medical Sciences, Department of Human Anatomy, College of Health Sciences, University of Port-Harcourt, Rivers State, Nigeria.
3 Faculty of Clinical Science, Department of Social and Preventive Medicine, University of Port Harcourt, Rivers State, Nigeria.
*Corresponding Author
Chinagorom P. Ibeachu BSc, PhD, MSc
Department of Human Anatomy, Faculty of Basic Medical Sciences,
College of Health Sciences, University of Port-Harcourt, Rivers State, Nigeria.
Tel: +234-803-702-7190
E-mail: Chinacute4christ@yahoo.com
Received: October 27, 2017; Accepted: November 28, 2017; Published: November 30, 2017
Citation: Aigbogun EO Jr, Ibeachu PC, Ikechukwu E. BMI-For-Age Cut-Off as an Indicator of Adiposity among In-School Children (Age 4-11 Years) in Obio/Akpor LGA, Rivers State, Nigeria. Int J Pediat Health Care Adv. 2017;4(7):63-69. doi: dx.doi.org/10.19070/2572-7354-1700018
Copyright: Ibeachu PC© 2017. This is an open-access article distributed under the terms of the Creative Commons Attribution License, which permits unrestricted use, distribution and reproduction in any medium, provided the original author and source are credited.
Abstract
Background: Childhood overweight and obesity has been an issue of great concern to developing and developed nation where as degenerative underweight has ravaged the underdeveloped and war turn countries.
Aim: This present study investigated the nutritional status of in-school children in Obio/Akpor Local Government Area of Rivers State using the WHO Body Mass Index-for-Age percentiles cut-offs.
Design and Methods: This study was designed as a cross-sectional analytical research. A total of 310 in-school children comprising of 149 boys and 161 girls were multi-staged randomly selected from primary schools within Obio/Akpor LGA of Rivers state, Nigeria. Anthropometric determination of weight and height of the selected children were carried out by standard methods. Stages of development (early childhood [4-7 years] and late childhood [8-11 years]) and sex-specific prevalence of adiposity were determined using WHO BMI-for-age percentile cut-offs. SPSS version 23 (IBM® Armonk, New York) was used to analyse the data.
Results: The Prevalence of overweight was found to be 29%; with 44% in children age 4-7years and 15% for children age 8-11years. Chi-square (X2) analysis showed that more girls (33.7%) than boys (29.1%) were significantly overweight (F=2.138, P=0.032); however nutritional status was not associated with sex (χ2=3.12, P>0.05) but with developmental stage when stratified with sex (χ2=52.306, P<0.01).
Conclusion: The prevalence of overweight was high; but higher in females than males, observed at early childhood. Greater adiposity at early childhood with gradual reduction through late childhood may be associated with high calorie-based dieting, reduced exercise and sedentary life among younger children.
2.Introduction
3.Significance for Public Health
4.Research Design and Methods
4.1 Demographic Data
4.2 Anthropometric Measurements
4.3 Statistical analysis
5.Results
5.1 Sex and Nutritional Status
5.2 Stages of Development and Nutritional Status
5.3 Sex and the Nutritional Status of Children at Early (4-7 years) and Late (8-11 years) Childhood
6.Discussion
7.Conclusion
8.Acknowledgements
9.References
Keywords
BMI-for-Age Percentile; In-School Children; Adiposity; Obio/Akpor Local Government Area.
Introduction
Childhood overweight and obesity has been an issue of concern for both developing and developed countries [1] while underdeveloped and war turn countries still suffers ravaging underweight and nutritional impoverishment. Overweight andobesity are linked to more deaths worldwide than underweight. Most of the world's population live in countries with high motility associated with overweight and obesity as observed in underweight [2]. WHO report for 2014 identified a doubled prevalence of worldwide obesity between 1980 and 2014. In 2013, 42 million children under the age of 5 were overweight or obese. Overweight and Obesity which was once considered a high-income country problem, are now on the rise in most urban settlements of low- and middle-income countries. There is a higher percentage of about 30% increase in childhood overweight and obesity of lower- and middle-income countries when compared to that of high-income countries [2].
Childhood obesity have long considered as the most serious public health challenges of the 21st century, with evidence of increased morbidity and mortality across the globe [3]. Obesity can harm nearly every system in a child’s body. The heart and lungs, muscles and bones, kidneys and digestive tract and the hormones that control blood sugar and puberty are target in obesity which can have negative social and emotional consequences [4]. Sadly, overweight or obese youth have substantially higher odds of remaining so through adulthood [5], thus increasing their risk of disease and disability later in life.
Hunger, underweight, and stunting of children have over the years been a nutritional concerns across Africa, and even at present, 20 to 25% of pre-schoolers in sub-Saharan Africa have been said to be underweight [6]. Child overweight and obesity are on the rise too, as the percentage of pre-schoolers in Africa who are overweight or obese have more than doubled over the past two decades, from 4% in 1990 to 8.5% in 2010 [7]; however, statistics shows that the increase are more obvious in Northern Africa than the rest of the continent. WHO [2], Ogden et al., [8] and NCHS [9] reported that Childhood obesity has more than doubled in children and tripled in adolescents in the past 30 years; with the fundamental cause associated with energy imbalance between calories consumed and expended [2, 10, 11]. Globally, there is increased consumption of fatty food, coupled with increased physical inactivity due to the increasingly sedentary nature of children both in and out of school, changing modes of transportation, and increased urbanization [10, 11]. According to Lobstein et al., [1] and Mogre et al., [12] childhood overweight and obesity is currently not only associated with the economic status of the country, as both developed, developing and underdeveloped countries have high prevalence. The issues of obesity cuts across both social and economic norms of a country as changes in dietary and physical activity patterns are often the result of environmental and societal changes associated with poorly formulated policies in sectors associated with human endeavours [2].
Studies have shown that overweight/obese children and adolescent when compared to their normal counterparts are at a higher risk of growing up to remain obese, even at adulthood [13, 14]. Also Freedman et al., [13] indicated that children who became obese as early as age 2 were more likely to be obese as adults, with a strong established between childhood obesity and cardiovascular diseases [2, 15], cancer and osteoarthritis [16]. Several nonpathologic factors (lifestyle) such as physical inactivity, television viewing/video games [12, 17], pre-and post-school activities, diet (especially midnight snacking) [12], bedtime [18-20] as well as an obesogenic environment [12, 17] has been shown to be the cause of increasing prevalence of obesity among children. Strategies for reducing obesity have been explored and these include but not limited to; Limiting unhealthy foods (refined grains and sweets, potatoes, red meat, processed meat) and beverages (sugary drinks), Increase availability of healthier food and beverage choices in public service venues [20], Increasing physical activity, Limiting television time, screen time, and other “sit time”, Improving sleep [18-21], healthy habits during pregnancy, reducing stress [20], among others.
Therefore this study was carried out to determine the nutritional status (using the WHO BMI-for-Age percentile cut-offs) of in-school children of ages 4-11 years in Obio/Akpor Local Government Area of Rivers State.
Significance for Public Health
This work is significance to public health because the economic and social burden of childhood overweight and obesity on the parent and the nation is grave. The nutritional status of children can be effectively evaluated using the BMI-for-age percentile, as it takes into consideration growth pattern with respect to age. The evaluation of children in any Nigerian state cannot be holistic, because of the complex settlement systems; thus the need to study the Local Government Areas (LGAs) separately is very significant. Obio/Akpor is the second richest LGA in Nigeria and has developed rapidly causing a spontaneous change in life style which has created an opportunity for obesity/overweight to thrive. Therefore, in designing an interventionary and management plan, it is necessary to have a good understanding of the dynamics, backed up by statistical evidence, to ensure effective strategy to tackle the causes and not the symptoms.
Research Design and Methods
This research is designed in the form of quantitative, normative and analytical cross-sectional survey to collect data from a set of in-school children from age 4-11 years within Obio/Akpor LGA of Rivers State, through a multistage random sampling technique involving 310 randomly selected children. Ethical approval was obtained from the Ethics Committee of the University of Port (reference number UPH/R&D/REC/04), while informed consent were received from the primary school headmasters and proprietors prior to commencement of the research. The research was carried out in line with the current Revised CIOMS (Council for International Organization of Medical Sciences) International Ethical Guidelines. This study was carried out from June 19, 2016 to October 2016.
Demographic data such as age, sex, mode of transport to school and parents’ occupation were obtained from the comprehensive schools’ record and the participating pupils.
About three hundred and ten (310) in-school children who presented themselves for measurement were given health education and detailed information on the aim as well as the objectives of this study. Two anthropometric variables (height and weight) were measured using standard procedure. The height was measured to the nearest 0.1cm using a standiometer and the weight was measured to the nearest 0.5kg using digital weighing scale, while the ages of the children were obtained from a comprehensive school register.
The data collected from the fieldwork were sorted out in two categories; early childhood=4-7years and late childhood= 8-11years, assigning separate codes for each category. The data collected were manually compiled, summarized and entered into master sheets. Coding and entries were checked with both the master sheet, and the computer. Data processing was done first manually on the data master sheets using results from questionnaire and then it was entered into the 2013 EXCELSHEET and crosschecked for errors.
Age- and sex-specific classification of overweight and obesity were determined by BMI-for-age percentile cut-off points; as recommended by the World Health Organisation [22]. Classification based on the WHO cut-off points using percentiles were as follows; values>95th percentile (overweight), 85th-95th percentile (at risk of overweight), 5th-85th percentile (normal), and <5th percentile (underweight). These values are age specific and differ from one age to another. BMI was calculated as weight (kg) divided by height (m) squared. Subjects were categorized into 2 groups based on the WHO recognized children’s developmental stages; 4-7 years (early childhood) and 8-11 years (late childhood); coincidentally, the grouping aligned with the Nigerian in-school age range.
SPSS Version 23 (IBM® Armonk, New York, USA) ANOVA and Unpaired t-test was used in assessing sex differences in the measured anthropometric parameters. Fisher’s Chi-square trend analysis and Z-test of proportionally were used to determine the association between BMI-for-age status with age, sex, and the stages of childhood development. Confidence level was set at 95% and p<0.05 was considered to be statistically significant.
Results
The data used in this study were expressed in graphs and tables. Presented in Figure 1 are the sex distributions of the participants. Table 1 summarizes the demographic characteristics of the studied participants and the comparative analysis was done in Table 2-5. The study included 141 boys (45.5%) and 169 girls (54.5%) distributed in the age groups; 4 years (48, 15%), 5 years (45, 15%), 6 years (28, 9%), 7 years (28, 9%), 8 years (35, 11%), 9 years (30, 10%), 10 years (44, 14%), 11 years (52, 17%) (Figure 1). The mean (±S.D) weight of male in-school children was 24.11 ± 5.07 kg while female was 25.41 ± 5.22 kg. Their height did not vary significantly as boys were slightly taller (1.15±0.11mm) than girls (1.14 ± 0.10mm). The mean (±S.D) body mass index (BMI) of boys was calculated to be 19.42 ± 2.73 kg/m2 while girls had a BMI of 19.42 ± 3.39 kg/m2. The weight and body mass index of the children showed significant variation which no variance was observed in the height [Table 1].
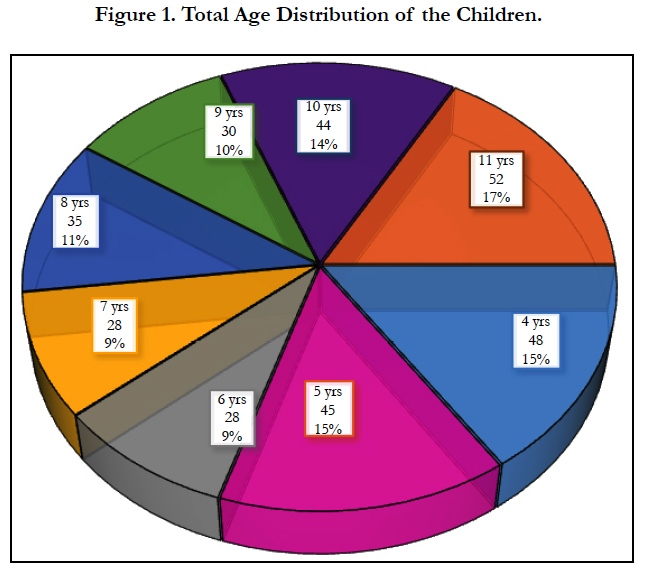
Figure 1. Total Age Distribution of the Children.
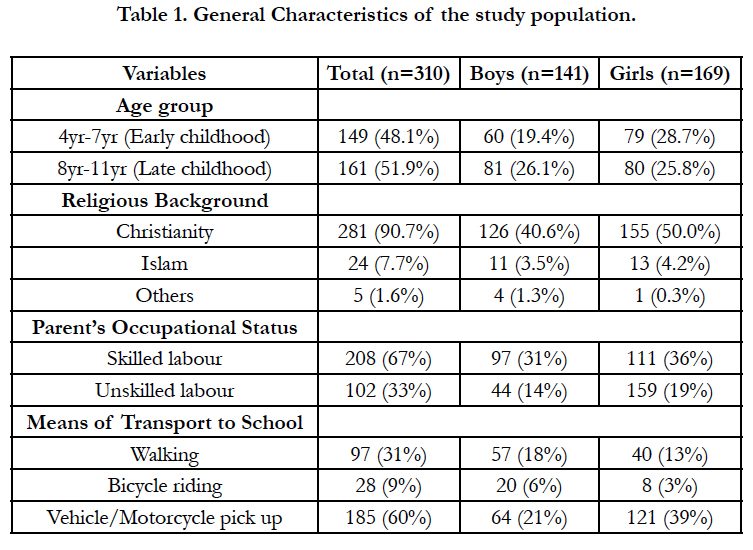

Table 1. General Characteristics of the study population.
Generally from Table 2, 48.1% (149/310) of the studied participants were aged 4-7 years of age; more girls (89; 28.7%) than boys (60; 19.4%) were observed within that age range while 51.9% (161/310) were aged 8-11; more boys (81; 26.1%) than girls (80; 25.8%) were observed within that age range. Christians were observed to be 281 (90.7%), Islamist 24 (7.7%) while others 5 (1.6%) included those who declined disclosing their religious affiliation. 208 (67%) of the children indicated their parents as skilled workers while 102 (33%) stated unskilled labour as their parents occupational status. 97 (31%) of the children walked to school while 28 (9%) ride a bicycle and 185 (60%) makes use of pick-up vehicles/motorbikes.
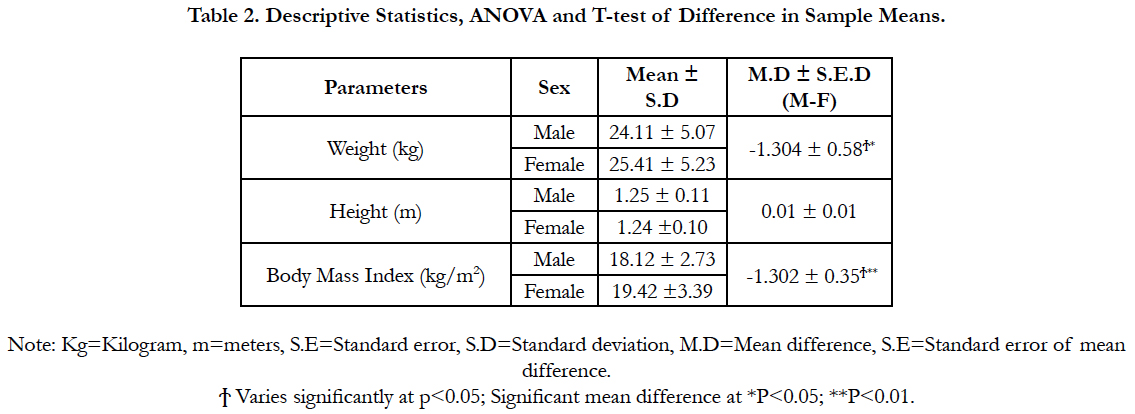
Table 2. Descriptive Statistics, ANOVA and T-test of Difference in Sample Means.
The nutritional status of the children were determined and compared using the BMI-for-Age cut offs percentile, ANOVA and t-test with two broad classifications;
[1] Sex of the child
[2] Stages of development (early childhood and late childhood)
The comparison of the distribution of the BMI-for-age status of the sexes presented in Table 3 showed that 4.2% of the total children were underweight, 26.5% were at risk of overweight, 28.7% were overweight, and 40.6% were normal. The test of association showed no relationship between sex and nutritional status (χ2=6.98; P=0.072). Insignificant but higher number of boys (6.4%) compared to 2.4% of girls were found to be underweight (F=1.757; P=0.064). On the other hand, almost equal proportions of normal children were observed (41.8% of boys and 39.6% of girls) (F=0.393; P=0.697). By proportion more boys (29%) were found to be at risk of being overweight than girls (24%), but the difference was not significant (F=0.958; P=0.337) and significantly greater percentage of girls (33.7%) were overweight when compared to boys (23%) (F=0.958; P=0.337).
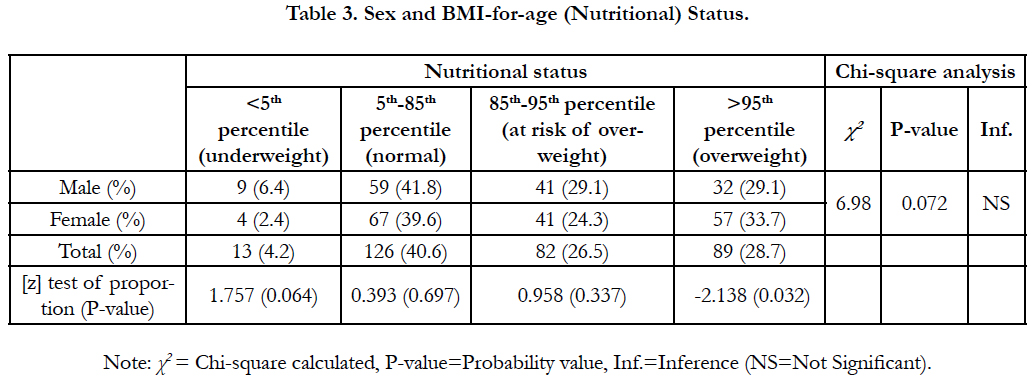
Table 3. Sex and BMI-for-age (Nutritional) Status.
Table 4 displays the outcome for the comparison of nutritional status of children at early (4-11yrs) and late (8-11yrs) childhood. Among the studied children in their early childhood, 5% (7/149) were underweight, 31% (46/149) at risk of becoming overweight, 44% (65/149) overweight, 31% (21/149) had normal BMI-forage status. At late childhood, 6% (4/161) were underweight, 22% (36/161) at risk of becoming overweight, 15% (24/161) overweight, 59% (95/161) had normal BMI-for-age status. Except for the underweighted group of children (F=0.619; P=0.535)), the normal group had significantly higher percentage at the late stage (F=6.109, P<0.001) while the group of children at risk of obesity (F=2.251, P=0.024) and overweight (F=6.181, P<0.001) were significantly higher in the group of children within age 4-7 years (their early stage).
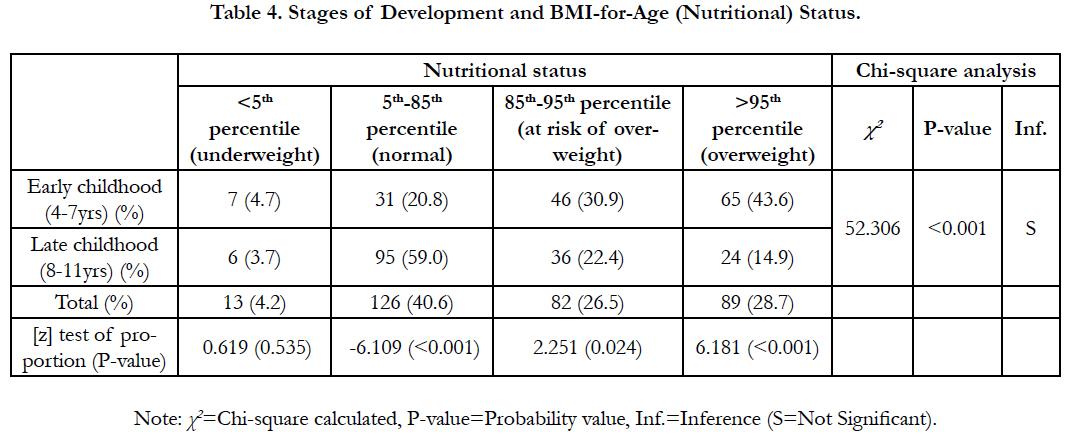
Table 4. Stages of Development and BMI-for-Age (Nutritional) Status.
The comparison of male and female children with nutritional status at their early and late childhood was presented in Table 5. The chisquare analysis showed that the outcome of the nutritional status of the children at early childhood was significantly associated with sex (χ2=14.493, P=0.002); as 7.1% of male children within age 4-7 years where observed to be underweight as against 2.5% for the female children. Significantly, more male (31.4%) than female (11.4%) children were observed to be normal (F=3.007, P=0.003) and more female (31.4%) than male (31.4%) children were observed to be overweight (F=2.495, P=0.013).When the nutritional status of children at late childhood was related to sex, there was no significant association (χ2=3.171, P=0.366), although more boys (25.9%) were observed to be at risk of being overweight while girls children were overweight (18.8% as against 11.1% for females). However, the Z-test of proportionality did not reveal any significant difference in the distribution (P>0.05).
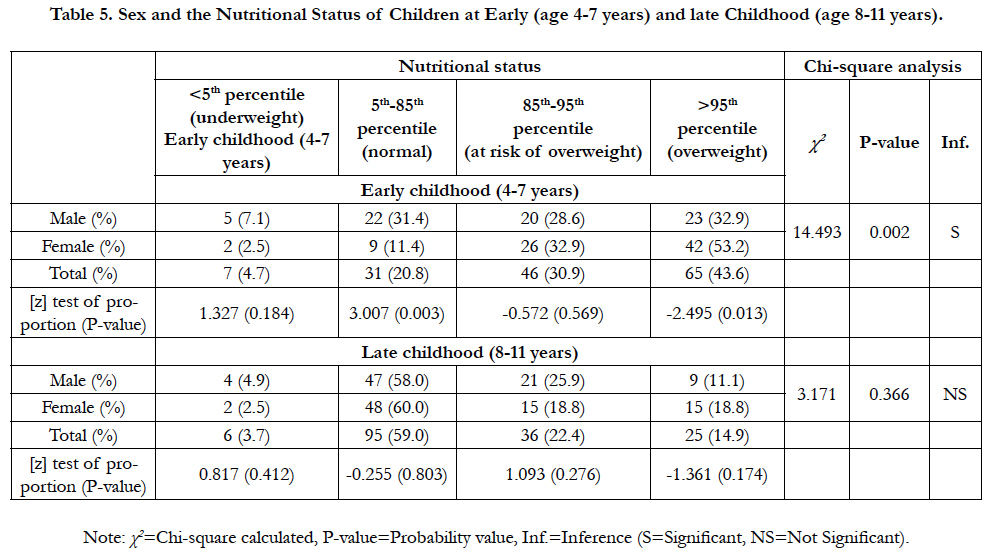
Table 5. Sex and the Nutritional Status of Children at Early (age 4-7 years) and late Childhood (age 8-11 years).
Discussion
Childhood overweight and obesity has been an issue of great concern for both developing and developed countries.[1-3]Body mass index (BMI) is NOT a diagnostic tool but a screening tool used to identify and classify individuals who are below or above normal weight. The use of BMI-for-age percentile cutoffs limits the discrepancy in age and sex for children. BMI-forage is regards as one of the standard measure of the nutritional status of children between ages 2 to 19 years, because at such age, there is a greater probability that their BMI could rapidly change [23]. The expert committees’ of W.H.O recommendations are to classify BMI-for-age at or above the 95th percentile as overweight and between the 85th and 95th percentile as “at risk of overweight” [24]. Overweight rather than obesity is a preferred term for describing children and adolescents with a BMI-for-age equal to or greater than the 95th percentile.
In this study, the prevalence of overweight for the Abio/Apkor in-school children was 28.7%; with 43.6% contributed by age's 4-7years and 15% by children between ages 8-11years. The result was higher than those of Janssen [25] which he reported childhood overweight/obesity prevalence of 25.4% in Malta and 21.2% in Wales. A study in Brazil by de Assis et al., [26] reported childhood overweight/obesity prevalence of 22% among 7-10 year olds. In Saudi Arabia, El Mouzan et al., [27] reported childhood and adolescent overweight, obesity and severe obesity prevalence of 23.1%, 9.3% and 2% respectively. Mogre et al., [12] revealed an overweight/obesity prevalence of 17.4% for the Tamale population of North Ghana. An overweight/obesity prevalence of 17% has been reported among children aged 10-16 years in Greece and Italy [25]. The prevalence rate in this study was higher than those of Greece and Italy, Tamale population of North Ghana, Malta and Wales but lower than the prevalence rate in Saudi Arabia.
Reduction in BMI with increasing age was observed in this study. However, no sex association was established in the outcome of this research which is in contrast to the findings of Janssen[25]; that sex influences BMI. More male children were underweight than female children, as observed in a study by Fazili et al., [28] among 5-14 year old higher underweight prevalence in boys. A study by Mogre et al., [12] among school-aged children in Tamale, Ghana and several other studies in other Sub-saharan African countries have reported also malnutrition associated underweight [29-32].
In this study, children at early childhood was significantly influenced by sex, however at late childhood no sex influence was noticed although females were more likely to be overweight than males during childhood development. Overweight was significantly associated with the stage of childhood development; as it significantly reduced with age. The lower prevalence of overweight at age 8-11 years is an indication that adipose deposit can be overgrown which could be as a result of significant increase in height to weight gain, accompanied by increased stress experienced at late childhood with need for bodily activities. In contrast to the findings of Schultz [33] reported that overweight significantly increased with age while obesity did not in a crosssectional study of Aboriginal kids aged 5-15 years. Toriola et al., [34] also reported that overweight and obesity among rural black South African children aged 10-16 years increased with age, peaking at age 12 years but declined thereafter. This present study only covered children within age 4-11 years without separating overweight and obese which may have contributed to the differences in the relationship between age and level of childhood overweight.
Although Schultz [33] and Toriola et al., [34] classified obesity and overweight separately in contrast with the W.H.O recommendation of 1996 reviewed in 2002 with some charts realigned in 2010. The joint classification of overweight and obesity used in this study may have contributed to the high prevalence of overweight among in-school children in Obio/Akpor Local Government Area.
Conclusion
It could be concluded that the prevalence of overweight was high; but higher in females than males, observed at early childhood. Greater adiposity experienced in early childhood with gradual reduction through late childhood may be associated with high calorie-based dieting, reduced exercise and sedentary life among younger children.
The finding of this study reinforces the World Health Organization report of 1996; that BMI status is significantly affected by the age and developmental stages but not sex.
Acknowledgements
We sincerely appreciate all private and public school within Obio/Akpor LGA for giving us an unrestricted access to their pupils which formed the subject of this study. We acknowledge the efforts of the principals and head teachers for their cooperation throughout the research period.
References
- Lobstein T, Baur L, Uauy R. Obesity in children and young people: a crisis in public health. Obes Rev. 2004 May; 5 Suppl 1:4–104. PubMed PMID: 15096099.
- World Health Organization (WHO). Media Centre/Events/Fact Sheet/Obesity and Overweight. Fact sheet No. 311; 2015.
- World Health Organization (WHO). Global strategy on diet, physical activity, and health: childhood overweight and obesity 2012. 2015 May 17.
- Ebbeling CB, Pawlak DB, Ludwig DS. Childhood obesity: public-health crisis, common sense cure. Lancet. 2002 Aug 10;360(9331):473-82.
- Singh AS, Mulder C, Twisk JW, Van Mechelen W, Chinapaw MJ. Tracking of childhood overweight into adulthood: a systematic review of the literature. Obes Rev. 2008 Sep; 9(5):474-88.
- United Nations. Childinfo.org: Statistics by area / child nutrition / undernutrition / progress. 2012. Accessed May 17, 2015.
- de Onis M, Blossner M, Borghi E. Global prevalence and trends of overweight and obesity among preschool children. Am J Clin Nutr. 2010 Nov;92(5):1257-64. PubMed PMID: 20861173.
- Ogden CL, Carroll MD, Kit BK, Flegal KM. Prevalence of obesity and trends in body mass index among US children and adolescents, 1999-2010. JAMA. 2012 Feb; 307(5):483-490. PubMed PMID: 22253364.
- National Center for Health Statistics (NCHS). Health, United States, 2011: With Special Features on Socioeconomic Status and Health. Hyattsville, MD; U.S. Department of Health and Human Services; 2012.
- Daniels SR, Arnett DK, Eckel RH, Gidding SS, Hayman LL, Kumanyika S, et al. Overweight in children and adolescents: pathophysiology, consequences, prevention, and treatment. Circulation. 2005 Apr 19;111(15):1999-2012. PubMed PMID: 15837955.
- Center for Disease Control (CDC). National diabetes fact sheet: national estimates and general information on diabetes and prediabetes in the United States. Atlanta, GA: U.S. Department of Health and Human Services 2011.
- Mogre V, Gaa PK, Abukari RNS. Overweight, obesity and thinness and associated factors among school-aged children (5-14 years) in Tamale, Northern Ghana. Eur Sci J. 2013;9(20).
- Freedman DS, Khan LK, Dietz WH, Srinivasan SA, Berenson GS. Relationship of childhood obesity to coronary heart disease risk factors in adulthood: the Bogalusa Heart Study. Pediatrics. 2001 Sep;108(3):712–718. PubMed PMID: 11533341.
- Freedman DS, Kettel L, Serdula, MK, Dietz WH, Srinivasan SR, Berenson GS. The relation of childhood BMI to adult adiposity: the Bogalusa Heart Study. Pediatrics. 2005 Jan;115(1):22–27. PubMed PMID: 15629977.
- Vignerova J, Humenikova L, Brabec M, Riedlova J, Blaha P. Long-term changes in body weight, BMI, and adiposity rebound among children and adolescents in the Czech Republic. Econ Hum Biol. 2007 Dec;5(3):409-425. PubMed PMID: 17766203.
- Office of the Surgeon General. The Surgeon General's Vision for a Healthy and Fit Nation. Rockville, MD, U.S. Department of Health and Human Services; 2010.
- Andersen RE, Crespo CJ, Bartlett SJ, Cheskin LJ, Pratt M. Relationship of physical activity and television watching with body weight and level of fatness among children: results from the Third National Health and Nutrition Examination Survey. JAMA. 1998 Mar;279(12):938-942. PubMed PMID: 9544768.
- Sekin M, Yamagam T, Handa K, Saito T, Nanri, S, Kawaminami, K, et al. A dose-response relationship between short sleeping hours and childhood obesity: results of the Toyama Birth Cohort Study. Child Care Health Dev. 2002 Mar;28(2):163-170. PubMed PMID: 11952652.
- Snell EK, Adam EK, Duncan GJ. Sleep and the body mass index and overweight status of children and adolescents. Child Dev. 2007 Feb;78(1):309- 323. PubMed PMID: 17328707.
- Harvard University, Harvard T.H Chan School of Public Health, Boston, USA. Turning around the epidemic: Obesity Prevention Strategies. Obesity Prevention Source. 2015 May 24.
- Maddah M, Rashidi A, Mohammadpour B, Vafa R, Karandish M. In-school snacking, breakfast consumption, and sleeping patterns of normal and overweight Iranian high school girls: a study in urban and rural areas in Guilan, Iran. J Nutr Educ Behav. 2009 Jan-Feb;41(1):27-31. pubMed PMID: 19161917.
- World Health Organization. Physical status: the use and interpretation of anthropometry. Report of a WHO Expert Committee. World Health Organ Tech Rep Ser.1995;854:1-452. PMID: 8594834.
- Pietrobelli A, Faith MS, Allison DB, Gallagher D, Chiumello G, Heymsfield SB. Body mass index as a measure of adiposity among children and adolescents: A validation study. J Pediatr. 1998 Feb;132(2):204-10. PubMed PMID: 9506629.
- Himes JH, Deitz WH. Guidelines for overweight in adolescent preventive services: recommendations from an expert committee. The Expert Committee on Clinical Guidelines for Overweight in Adolescent Preventive Services. Am J Clin Nutr. 1994 Feb;59(2):307-16. PubMed PMID: 8310979.
- Janssen I, Katzmarzyk PT, Boyce WF, Vereecken C, Mulvihill C, Roberts C, et al., Comparison of overweight and obesity prevalence in schoolaged youth from 34 countries and their relationships with physical activity and dietary patterns. Obes Rev. 2005 May;6(2):123-32. PubMed PMID: 15836463.
- de Assis MAA, Rolland-Cachera MF, de Vasconcelos de-AG F, Bellisle F, Calvo MCM, Luna MEP, et al. Overweight and thinness in 7-9 year old children from Florianópolis, Southern Brazil: a comparison with a French study using a similar protocol. Revista de Nutrição 2006;19(3):299-308.
- El Mouzan MI, Foster PJ, Al Herbish AS, Al Salloum AA, Al Omer AA, Qurachi MM, et al., Prevalence of overweight and obesity in Saudi children and adolescents. Ann Saudi Med. 2010 May-Jun; 30(3): 203-208. PubMed PMID: 2886870.
- Fazili, A, Mir AA, Pandit IM, Bhat IA, Rohul J, Shamila H. Nutritional Status of School Age Children (5-14 years) in a Rural Health Block of North India (Kashmir)Using WHO Z-Score System. The Online Journal of Health and Allied Sciences. 2012;11(2):2.
- Kimani-Murage EW, Kahn K, Pettifor JM, Tollman SM, Dunger DB, Gomez-Olive XF, et al., The prevalence of stunting, overweight and obesity, and metabolic disease risk in rural South African children. BMC Public Health 2010;10:158.
- Onis de-M, Monteiro C, Akre J, Clugston G. The worldwide magnitude of protein-energy malnutrition: an overview from the WHO Global Database on Child Growth. American J of Clin Nutr 2001; 75(6):971-977.
- Mamabolo RL, Alberts M, Steyn NP, Delemarre-van de Waal HA, Levitt NS. Prevalence and determinants of stunting and overweight in 3- year-old black South African children residing in the Central Region of Limpopo Province, South Africa. Public Health Nutr. 2005 Aug;8(5):501-8. PubMed PMID: 16153331.
- Ene-Obong H, Ibeanu V, Onuoha N, Ejekwu A. Prevalence of overweight, obesity, and thinness among urban school-aged children and adolescents in southern Nigeria. Food Nutr Bull. 2012 Dec;33(4):242-50. PubMed PMID: 23424890.
- Schultz R. Prevalence of overweight and obesity among children in remote Aboriginal communities in central Australia. Rural Remote Health 2012;12:1872. PubMed PMID: 22463700.
- Toriola AL, Moselakgomo VK, Shaw BS, Goon DT. Overweight, obesity and underweight in rural black South African children. South African J of Clin Nut 2012; 25(2): 57-61.


